Chromosoma (2010) 119:255–266 DOI 10.1007/s00412-009-0254-0
RESEARCH ARTICLE
Structure and size variations between 12A and 12D homoeologous chromosomes based on high-resolution cytogenetic map in allotetraploid cotton Kai Wang & Wangzhen Guo & Zaijie Yang & Yan Hu & Wenpan Zhang & Baoliang Zhou & David M. Stelly & Z. Jeffrey Chen & Tianzhen Zhang
Received: 15 October 2009 / Revised: 11 December 2009 / Accepted: 21 December 2009 / Published online: 2 February 2010 # Springer-Verlag 2010
Abstract Cotton is a model system for studying polyploidization, genomic organization, and genome-size variation because the allotetraploid was formed 1-2 million years ago, which is old enough for sequence divergence but relatively recent to maintain genome stability. In spite of characterizing random genomic sequences in many polyploidy plants, the cytogenetic and sequence data that decipher homoeologous chromosomes are very limited in allopolyploid species. Here, we reported comprehensive analyses of integrated cytogenetic and linkage maps of homoeologous chromosomes 12A and 12D in allotetraploid cotton using fluorescence in situ hybridization and a large number of bacterial artificial chromosomes that were anchored by simple sequence repeat markers in the corresponding linkage maps. Integration of genetic loci into
physical localizations showed considerable variation of genome organization, structure, and size between 12A and 12D homoeologous chromosomes. The distal regions of the chromosomes displayed relatively lower levels of structural and size variation than other regions of the chromosomes. The highest level of variation was found in the pericentric regions in the long arms of the two homoeologous chromosomes. The genome-size difference between A and D sub-genomes in allotetraploid cotton was mainly associated with uneven expansion or contraction between different regions of homoeologous chromosomes. As an attempt for studying on the polyploidy homoeologous chromosomes, these results are of general interest to the understanding and future sequencing of complex genomes in plant species.
Electronic supplementary material The online version of this article (doi:10.1007/s00412-009-0254-0) contains supplementary material, which is available to authorized users.
Introduction
K. Wang : W. Guo : Z. Yang : Y. Hu : W. Zhang : B. Zhou : T. Zhang (*) National Key Laboratory of Crop Genetics and Germplasm Enhancement, Cotton Research Institute, Nanjing Agricultural University, Nanjing 210095, China e-mail:
[email protected] D. M. Stelly Department of Soil and Crop Sciences, Texas A&M University, College Station, TX 77843, USA Z. J. Chen Institute for Cellular and Molecular Biology and Center for Computational Biology and Bioinformatics, University of Texas, One University Station, A-4800, Austin, TX 78712, USA
Cotton, cultivated in nearly 100 countries, is the most important natural textile fiber and the second largest oilseed crop. The genus Gossypium consists of ∼50 species, including 40-45 diploids (2n=2x=26) and five allotetraploids (2n=4x=52) (Fryxell 1992). Two groups of diploid species, designated A- and D-genome, diverged from a common ancestor about 5-10 million years ago (MYA). These diploid species were combined to form new allotetraploid species through a polyploidization event that occurred 1–2 MYA, giving rise to five divergent allotetraploid species (Cronn et al. 2002; Seelanan et al. 1997; Wendel 1989). Two of the allotetraploid species, Gossypium hirsutum and Gossypium barbadense, account for ∼95% and ∼5% of worldwide cotton cultivation, respectively. The genus Gossypium not only has its economic
256
importance, but also provides an excellent system for the study of genome evolution and polyploidization in plants. Polyploidy or whole genome duplication is common in many plants and some animals (Otto and Whitton 2000). It is estimated that all angiosperms underwent at least one event of polyploidy in their evolutionary history, and ∼70% of flowering plants are polyploids (Masterson 1994). After polyploidization, the genomes may undergo genetic and epigenetic changes, leading to gene expression and phenotypic variation (Chen 2007). In cotton, duplicate genes originating from the progenitors evolve independently at the same rate as those of their diploid progenitors (Cronn et al. 1999) and display few genomic changes in the allotetraploids (Liu et al. 2001). In the analysis of AdhA and CesA genomic regions and random whole-genome shotgun trace reads, the genome-size difference in cotton is probably associated with the expansion and contraction of repetitive elements including transposons, whereas the homoeologous sequences flanking the genes are highly conserved (Grover et al. 2004, 2008; Hawkins et al. 2006). However, a generally high level of sequence conservation between homoeologous genomic regions makes it difficult to annotate and assemble whole-genome shotgun sequences in allotetraploid species including cotton and wheat. To dissect the genomic complexity in allotetraploid cotton, extensive efforts have been placed on developing high-density genetic maps. To date, over 1,000 DNA markers have been mapped in the populations of allotetraploid cotton (Guo et al. 2008; Rong et al. 2004). In addition, over 350,000 expressed gene sequence tags (ESTs) have been analyzed (Udall et al. 2006; Yang et al. 2006), which revealed an enrichment of genome-specific ESTs during early stages of fiber development (Yang et al. 2006). Moreover, several large insert bacterial artificial chromosome (BAC) libraries have been developed (Hu et al. 2009; Tomkins et al. 2001; Yin et al. 2006). Although linkage maps provide useful genetic information including colinearity of DNA markers, physical distance, and organization of the homoeologous chromosomes in the allopolyploid species are largely unknown. In addition, many DNA markers are monomorphic and cannot be mapped in both homoeologous linkage groups. Integration of DNA markers into cytogenetic maps provides unique insights into genome organization at the chromosomal level (Wang et al. 2006a). Direct localization of genetically mapped sequences onto chromosomes using fluorescence in situ hybridization (FISH) is a powerful method for mapping plant chromosomes (Jiang and Gill 2006; Kato et al. 2005; Lakatošová and Holečková 2007; Schwarzacher 2003). Meiotic pachytene chromosomes are often used for developing high-resolution FISH maps in plants because they are 10-25 times longer than somatic metaphase chromosomes and the morphology of the chromosomes and cytological
Chromosoma (2010) 119:255–266
landmarks are well preserved (De Jong et al. 1999; Fransz et al. 1998; Harper and Cande 2000; Xu and Earle 1996). Previous cotton cytogenetic maps were limited to mitotic or meiotic metaphase chromosomes using repetitive DNA (Hanson et al. 1996; Ji et al. 2007; Zhao et al. 1998), BACs (Hanson et al. 1995), and DNA marker-derived BACs (Wang et al. 2006b, 2007b, 2008). This is partly because tetraploid cotton contains many chromosomes (2n=4x=52), and it is difficult to prepare pachytene chromosomes (Jack Mursal and Endrizzi 1976). To date, integrated genetic and cytogenetic maps using pachytene chromosomes were not available in cotton (Ji et al. 2007). Here, we report the first high-resolution integrated genetic and cytogenetic maps of homoeologous chromosomes 12A and 12D, which contain important genes related to fiber fuzz, gland development, and male sterility in allotetraploid cotton (Chen et al. 2009; Dong et al. 2007; Rong et al. 2005). The advantages of using chromosomes 12A and 12D also includes that no chromosome translocations (Gerstel 1953) and inversions (Rong et al. 2004; Guo et al. 2008) compared with their diploid ancestors have been found on these two chromosomes. The pachytene chromosomes of 12A and 12D were mapped using monomorphic and polymorphic BACs that were anchored by DNA markers (Wang et al. 2007a). Integration of genetic loci into physical localizations showed considerable variation of genome organization, structure, and size between 12A and 12D homoeologous chromosomes.
Methods Materials G. hirsutum acc. TM-1 was used for cytological studies. All BACs used for FISH mapping were identified by screening two genomic BAC libraries derived from TM-1 (Hu et al. 2009) and a restorer line, 0-613-2R (G. hirsutum), for cytoplasmic male sterile line of Gautieria harknessii (Yin et al. 2006). The BACs from these libraries were identified by the prefixes “t” for TM-1 BACs and “r” for restorer line BACs. The simple sequence repeat (SSR) markers used for BAC screening were selected from high-density genetic maps derived from the populations of tetraploid Gossypium species (Guo et al. 2008). Chromosome preparation Meiotic pachytene chromosome spreads were prepared as previously described (Wang et al. 2006b) with several modifications. Briefly, young buds containing pachytenestage meiocytes were incubated at 37°C for 5 h in an enzyme mixture containing 2% cellulose and 2% pectolyase in
Chromosoma (2010) 119:255–266
10 mM citrate buffer, pH 4.5. After washing in deionized water, several anthers were carefully transferred onto an ethanol-washed glass slide with a drop of 60% acetic acid (v/v), and the pollen mother cells were dissected out by teasing apart the anthers using forceps. After covering with a coverslip, the material was immediately squashed on a hot plate at 80°C. The slides were stored at −70°C. After removing the coverslips, slides were dehydrated through an ethanol series (70, 90, and 100%; 5 min each) and used in FISH. FISH The FISH procedure was similar to the previously published protocol (Wang et al. 2007c). In order to reduce the background, all BAC probes for each chromosome were separated into two or three cocktails and then applied in two or three rounds of hybridization using high-quality pachytene chromosome preparations. Biotin- and digoxigeninlabeled probes were detected using rhodamine-conjugated anti-digoxigenin and fluorescein-conjugated avidin (Roche Diagnostics), respectively. Chromosomes were counterstained with DAPI (4′, 6-diamidino-2-phenylindole; Sigma, USA) and antifade (Vector, USA) under a coverslip. Image analysis Slides were examined under an Olympus BX51 fluorescence microscope. The gray images of chromosome and FISH signal channels were captured and merged using Image-Pro Express software V5.0 with an Evolution VF CCD camera (Media Cybernetics, USA). To determine physical positions of signals, only chromosomes without apparent morphological distortion were analyzed, and their physical positions of signals were measured using ImagePro Express. Final image adjustments were performed using Adobe Photoshop 6.0 software. The path of the chromosomes was computationally traced and straightened according to the manual provided by the Image J software V1.41 (http://rsb.info.nih.gov/ij).
Results High-resolution cytogenetic maps of 12A and 12D homoeologous chromosomes To construct a cytogenetic map with a high resolution, we screened as many BACs as possible using the SSR markers anchored on homoeologous chromosomes 12A and 12D in tetraploid cotton (Guo et al. 2008). For example, SSR primer pair NAU1237 produced two polymerase chain reaction fragments in G. barbadense cv. Hai7124 and two
257
in G. hirsutum acc. TM-1 (Fig. S1a), one pair of which was co-dominant and polymorphic, NAU1237-160 in Hai7124 and NAU1237-155 in TM-1, and mapped on chromosome 12A (Guo et al. 2008). However, another fragment NAU1237-140 was monomorphic between Hai7124 and TM-1 and could not be mapped. This unmapped locus is probably located in its homoeologous chromosome 12D. Using the SSR primer pair NAU1237, we identified two positive BAC clones, r081K08 associated with the polymorphic locus NAU1237-155 and designated polymorphic BAC, and t215O23 related to the monomorphic locus NAU1237-140 and designated monomorphic BAC. Using our previously described method (Wang et al. 2007a, b), we performed FISH analysis using r081K08 BAC simultaneously with another BAC r043C02 that was known to be on chromosomes 12A (Wang et al. 2007a), and both BACs (r081K08 BAC as same as r043C02) were co-localized in the same chromosome 12A (Fig. S1b). As expected, another BAC t215O23 was mapped on 12D in FISH analysis. This approach has been proved to be useful for identification and mapping of more BACs onto homoeologous chromosomes in allotetraploid cotton (Wang et al. 2007a). We selected 92 SSR markers that dispersed ∼3-cM intervals along the entire linkage maps of 12A and 12D and used them to screen for the corresponding BACs. A total of 85 positive BACs, 26 derived from 19 monomorphic SSR markers and 59 from 54 polymorphic SSRs were identified using 73 SSR markers. Out of 85 BACs, 53 (62.4%) were not mappable because they produced high hybridization background or light signals that were scattered on the chromosomes other than 12A and 12D. Consistent with our previous results, these BACs may contain one or more dispersed repetitive elements, suggesting a high amount of repetitive DNA dispersed in tetraploid cotton (Wang et al. 2006b, 2007b). The wide distribution of repetitive DNA leads to a relatively low percentage (37.6%) of available BACs that can be used for FISH analysis in tetraploid cotton. The remaining 32 BACs that consistently produced unambiguous bright FISH signals on chromosome 12A or 12D were used in the construction of cytogenetic maps on pachytene chromosomes (Table 1). Among them, ten BACs were derived from monomorphic SSR markers, and three, t283I16, t208C15, and r070L23, were homoeologousspecific BACs because they generated bright signals on both 12A and 12D, indicating sequence homology between these BACs retained in 12A and 12D (Wang et al. 2007a; Fig. S2a-c). BAC t097G20 was mapped to the centromeric region of all 52 chromosomes not only in mitosis, but also in meiosis (Fig. S2d, e) in tetraploid cotton and probably contained centromere-specific repeats. Nevertheless, the centromere location can be accurately defined using this centromere-specific BAC t097G20. Together, 32 BACs
258
Chromosoma (2010) 119:255–266
Table 1 List of BACs and their corresponding DNA markers used in the study BAC
Types
Anchored chr.
SSR marker
t263K12 t336G12 t200M10 r078J02 r075A11 r043C02 t174A01 r038P15 r051E21 r079A04 t259M16 t097G20 t283I16
Pa P Mb M M P P M M P M cent H c, P
12A 12A 12A 12A 12A 12A 12A 12A 12A 12A 12A
NAU4047-400 NAU3561-370 NAU4090-255 NAU877-205 NAU2356-170 NAU2096-200 BNL1673-190 NAU1231-250 BNL3537-180 NAU2251-165 NAU3896-230
12A
NAU2715-180
t208C15 r070L23 t163D05 t331N02 t215O23 t081H09 t246C12 t107F20 r010G17 t112E02 r105F05 r004O22 t110E13 r075N02 r046P23 t259L20 r012M10 t115A01
H, M H, M P P M P P P P P P P P P P P M P
12D 12D 12D 12D 12D 12D 12D 12D 12D 12D 12D 12D 12D 12D 12D 12D 12D 12D
NAU5079-800 BNL598-125 NAU4089-190 NAU877-205 NAU1237-155 BNL3816-195 NAU3006-220 BNL840-165 BNL1669-170 NAU4912-160 NAU2372-265 BNL341-130 NAU3291-290 JESPR136-150 NAU3905-140 NAU2251-155 BNL4059-225 JESPR300-205
r067L14
P
12D
NAU3896-230
a
polymorphic BACs
b
monomorphic BACs
c
homoeologous BACs
generated a total of 36 cytogenetic markers (FISH signals), which were used to construct integrated genetic and cytogenetic maps of homoeologous chromosomes 12A and 12D (Fig. 1). Cytogenetic map of chromosome 12A A total of 15 SSR-derived BACs (Table 1) including six monomorphic, five polymorphic, three homoeologousspecific (t283I16, t208C15, and r070L23), and one centromeric BAC (t097G20) were mapped on chromosome 12A
(Figs. 1 and 2a). Five of them were localized in the short arm and nine in the long arm. To compare genetic and cytogenetic maps, we measured the FISH signals of each BAC from ten cells with clear chromosome spreads and calculated the relative position of FISH signals in a cytogenetic map (Fig. 2b). The genetic distances of SSR markers associated with the corresponding BACs were also converted into the relative positions in the corresponding linkage map (Fig. 2a). We found that the orders and positions of polymorphic and monomorphic BACs on chromosome 12A were concordant with marker positions in the corresponding linkage group. Mapping monomorphic BACs can increase the number of mapped homoeologous loci. Of six monomorphic BACs, three (r038P15, r051E21, and t259M16) were mapped with relative distances of 78.0, 86.6, and 100%, respectively, in the long arm of 12A. BAC r051E21 was localized between two homoeologous-specific BACs t208C15 and r070L23, overlapping with r070L23. The other three monomorphic BACs, t200M10, r078J02, and r075A11, were mapped between the centromere and BAC t336G12 or SSR marker NAU3561-370 in the short arm of 12A (Fig. 2b). Intriguingly, the monomorphic BAC r075A11 was located in the short arm of chromosome 12A, whereas its corresponding genetic locus NAU2356-170 was mapped in the long arm of 12D (Fig. 2b, c). This suggests a rearrangement between 12A and 12D homoeologous chromosomes. To test the coverage of genetic markers in the distal ends of 12A, all DNA markers near the ends of both arms were used to screen for BAC libraries. NAU4047-400, one of the four markers tested, detected a BAC for FISH. The marker was located in the short arm of the linkage map, and its corresponding BAC was located near the end of short arm (Fig. 1c), ∼1.8% of the length from the top of the chromosome (Fig. 2b). Another monomorphic BAC t259M16 was mapped near the end of the long arm (Fig. 1c). No corresponding BAC clone was found for the end-marker JESPR300-210. BAC t115A01, corresponding to JESPR300-205 in the linkage map 12D, was located within the chromosomal arm proximal to t259M16 (see below). The analysis of integrated cytogenetic and linkage maps indicated that a good coverage of genetic markers in the linkage map and a complete colinearity between genetic loci and physical positions of corresponding BACs in 12A. Cytogenetic map of chromosome 12D We developed a cytogenetic map of chromosome 12D using 21 BACs, including two monomorphic (t215O23 and r012M10), 15 polymorphic, three homoeologous-specific (t283I16, t208C15, and r070L23), and one centromeric BAC (t097G20; Table 1). The homoeologous-specific and centromeric BACs were common markers for both 12A and 12D. Similar to what was found in chromosome 12A, there
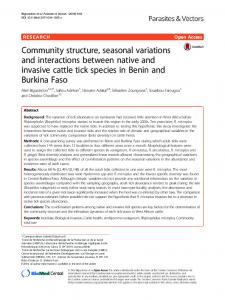
Chromosoma (2010) 119:255–266 Fig. 1 BAC FISH mapping of pachytene chromosomes 12A and 12D in allotetraploid cotton. a, b Chromosomes 12A (a) and 12D (b) from different pachytene cells of TM-1 were hybridized with 15 and 21 BAC clones, respectively. The centromere-specific BAC t097G20 hybridized to all 52 cotton centromeres (red signals). Arrowheads indicate centromeres in homoeologous chromosomes 12A and 12D. c, d Chromosomes 12A (c) and 12D (d) were computationally straightened from images shown in a and b, respectively. Mapped BACs are shown on the right. Bars 10 µm
259
a
c
t263K12 t336G12 t200M10 r078J02
d t163D05 t331N02
r075A11
t097G20 t097G20 t215O23 t081H09 t246C12 t107F20 r010G17 r043C02
b t174A01
t283I16
t112E02 r105F05 r004O22 t110E13 t283I16 r075N02
r038P15 r046P23 t208C15 r051E21 r070L23 r079A04
t208C15 r070L23 t259L20 r012M10
t259M16
was an obvious difference between the relative physical positions detected by polymorphic BACs and the genetic distances detected by linkage analysis near the end of two arms (Fig. 2c, d). Within a chromosomal arm such as the pericentric region of the long arm, the physical and genetic distances were relatively consistent. The order of polymorphic and monomorphic BACs in chromosome 12D was generally colinear with that of corresponding genetic markers in the linkage map, and only a few closely linked loci, between NAU4912- 160 and NAU2372- 265, JESPR300- 205 and NAU3896-230, and NAU2715-250 and NAU3291-290, displayed changes in the order between the genetic markers and BAC locations (Fig. 2c, d). For example, BACs t107F20 and t246C12 nearly overlapped, although the genetic distance between their corresponding genetic markers BNL386-195 and NAU3006-220 was 4.6 cM. Both polymorphic BAC r067L14 and monomorphic BAC t259M16 of NAU3896-230 were located near the end of chromosomes 12A and 12D (Fig. 1c, d), consistent
t115A01 r067L14
with the location of SSR marker NAU3896-230 near the end of the linkage map. To evaluate the coverage of markers and BACs in the short arm of the linkage map 12D, we screened for BACs using 11 SSR markers located at 0∼ 41.2 cM in the distal region of short arm (Guo et al. 2008). Two SSR markers NAU4089-190 and NAU877-205 (25.6% and 31.5% from the distal end of short arm, respectively) detected polymorphic BACs that produced unambiguous FISH signals. The physical locations of corresponding BACs were 9.4% and 13.0% from the distal end of short arm (Figs. 1d and 2d). The first integrated cytogenetic and linkage maps of homoeologous chromosomes 12A and 12D indicate that the orders of most genetic markers tested are colinear with corresponding BAC FISH signals. However, some discrepancies exist; r078J02 and t331N02 derived from NAU877 were anchored in the short arm of both chromosomes. However, physical positions between NAU1237-associated t215023 BAC and NAU3006-associated BAC t246C12 or
260
Chromosoma (2010) 119:255–266
a
b
c
d
a
Linkage map of 12A Relative SSR position markers (%)
Cytogenetic map of 12A Relative BACs position (%)
Linkage map of 12D Relative SSR position markers (%)
Cytogenetic map of 12D Relative BACs position (%)
Linkage map of 12A Relative SSR position markers (%)
0.0
NAU3109-295
1.8 2.8
t263K12 t336G12
7.5
NAU4047-400
9.4 10.5
t200M10 r078J02
11.5
34.2
BNL3816-125
41.6
NAU1237-155
46.0
NAU2096-200
55.7
BNL1673-190
78.3 79.5 81.0
NAU3862-450
9.4 13.0
NAU3561-370
Centromere
63.0
0.0
21.4
r075A11
28.9
t097G20
46.0
57.9
r043C02
t174A01
24.5 25.6
NAU4090-255 NAU4089-190
31.5 34.0
NAU877-205 BNL3816-195
38.6 40.2 40.5 44.4
NAU3006-220 NAU2356-170 BNL840-165 BNL1669-170
51.0 51.4 52.5 57.2 58.1 60.0 63.3 66.2
NAU2372-265 NAU4912-160 BNL341-130 NAU2715-250 NAU3291-290 NAU1231-250 JESPR136-150 NAU3905-140
69.9
BNL3537-180
76.9
NAU2251-155
NAU2715-180
NAU5079-800 BNL598-125 NAU2251-165
97.0
BNL4059-225
100.0
JESPR300-210
69.8
t283I16
78.0
r038P15
85.9 86.6 87.2 91.4
t208C15 r051E21 r070L23 r079A04
100.0
t259M16
93.3 94.3
NAU3896-230 JESPR300-205
100.0
NAU3084-235
28.5 30.3 33.8 36.5 37.1 41.1
t163D05 t331N02
NAU3109-295
7.5
NAU4047-400
11.5
NAU3561-370
34.2
BNL3816-125
41.6
NAU1237-255
46.0
NAU2096-200
55.7
BNL1673-190
63.0
NAU2715-180
78.3 79.5 81.0
NAU5079-800 BNL598-125 NAU2251-165
97.0
BNL4059-225
100.0
JESPR300-210
t097G20 Centromere t215O23 t081H09 t246C12 t107F20 r010G17
61.2 62.0 64.2
t112E02 r105F05 r004O22
70.4 71.3 75.2
t110E13 t283I16 r075N02
83.8 86.8 87.5 91.1
r046P23 t208C15 r070L23 t259L20 r012M10 t115A01 r067L14
97.3 99.1 100.0
0.0
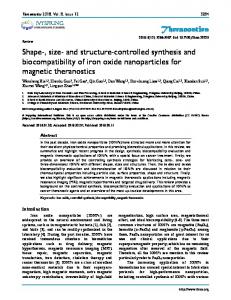
Fig. 2 An integrated cytogenetic map of homoeologous chromosomes 12A and 12D showing a high correlation between genetic positions of SSR markers and their corresponding physical locations of BACs. a, c The partial genetic maps of homoeologous chromosomes 12A (a) and 12D (c; Guo et al. 2008), in which the marker positions (cM) were converted to the positions relative to the total length of the linkage group (%). b, d Ideograms of pachytene chromosome 12A (b) and 12D (d) based on the FISH mapping results shown in Fig. 1. Heterochromatic regions with bright DAPI staining
are shown in dark blue. Green and red circles represent FITC and rhodamine signals, respectively, of FISH generated by BAC probes. The positions of BACs on the chromosome were drawn based on the data from ten samples and were converted to the distances relative to the length of the chromosome (%). The polymorphic and monomorphic BACs were linked to corresponding SSR markers by black and black dotted lines, respectively. The dot-dash lines indicate the BACs with homoeologous-specific markers. Bar represents 10 µm or 10 cM in the cytogenetic and linkage maps, respectively
NAU2356-associated r075A11 in 12D were reversed in 12A. This may be caused by a chromosome rearrangement possibly an inversion between NAU1237 and NAU2356 in 12D in the pericentric region relative to that in 12A.
intensity of euchromatin and heterochromatin along the chromosome (Fig. 2b, d). The majority of heterochromatin was distributed in the pericentric regions of 12A and 12D. A larger DAPI-staining block in the pericentric region of 12A than that of 12D indicated more heterochromatin in 12A. BAC r075A11 in 12A and t215O23 and r010G17 in 12D were localized in the pericentric regions of heterochromatin. Without Cot-1 DNA blocking, the FISH signals of these BACs in mitotic metaphase chromosomes were visible on all chromosomes or one homoeologous group of chromosomes (Fig. S3) probably because these BACs contain high amounts of repetitive DNA sequences that are dispersed in the genome. The overall similar patterns and distributions of euchromatic and heterochromatic
Structural differences between homoeologous chromosome 12A and 12D We analyzed the distribution of euchromatic and heterochromatic regions in two homoeologous chromosomes using DAPI-staining method (Kapuscinski 1995). The DAPI staining patterns were averaged from pachytene chromosomes in 20 cells. The length and intensity of blue staining regions corresponded to the relative length and
Chromosoma (2010) 119:255–266
regions suggest stable maintenance of chromatin structures between these two homoeologous chromosomes. Detection of three homoeologous-specific BACs t283I16, t208C15, and r070L23 in this study indicated a homologous relationship between these three regions of two homoeologous chromosomes (Fig. S2). We further analyzed the homology and diversity of 12A and 12D homoeologous relationships using BAC-FISH intensities and patterns. To detect weak signals, we increased the probe DNA to 300 ng or more in each FISH assay using the protocol developed in maize (Kato et al. 2006). Only the signals that were found in three or more cells were further analyzed. The BACs mapped on chromosome 12D were divided into two groups. The first group included 13 BACs spanning from 61.2% to 100% in the distal region of the long arm, and the remaining seven BACs, including five being in the pericentric region of the long arm and two in the distal region of the short arm, belonged to the second group. Interestingly, we detected all 13 FISH signals of the first-group BACs in 12D, as well as in the distal regions of the long arm in 12A, although the FISH signals in 12A were weaker than that in 12D (Fig. 3a), except for three homoeologous-specific BACs and r067L14. Their orders were completely colinear between these two homoeologous chromosomes, indicating conservation of genome structure in the long arm of 12A. To our surprise, among the second group of seven BACs derived from 12D, only one BAC (t163D05) in the distal regions of short arm generated a weak homoeologous signal in 12A (Fig. 3b), and BACs r010G17 and t081H09 produced very weak and unstable signals in 12A. This suggests genomic changes in this pericentric region between 12D and 12A. The changes might occur in the progenitor species prior to polyploidization or in the homoeologous chromosomes evolution after polyploidization. To test this, we hybridized five 12D-derived BACs (t215O23, t081H09, t246C12, t107F20, and r010G17) that generated no signals in 12A (Fig. 3b) with A-genome diploid cotton, Gossypium arboreum. No hybridization was found in the diploid cotton either (Fig. S4). Together with integrated cytogenetic maps, we suggest a chromosomal rearrangement that is most likely driven by illegitimate recombination in this region prior to polyploidization. Excluding three homoeologous-specific BACs and one centromere-specific BACs, we divided 11 BACs in 12A into two groups: six in the long arm and five in the short arm. Six long-arm BACs, except for r043C02, generated bright FISH signals in 12D (Fig. 3c), although r079A04 and t174A01 produced relatively weak signals in 12D. Five short-arm BACs generated bright FISH signals in 12D, and t263K12 and t336G12 produced brighter signals than other three BACs (Fig. 3d). The physical order of all BACs tested was consistent between two homoeologous chromosomes. Like in 12D, the BACs in the distal regions of 12A
261
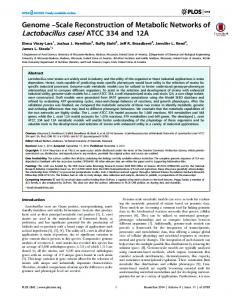
produced brighter FISH signals than those in pericentric regions, suggesting that the sequence identity is generally higher in the distal regions than in the pericentric regions of the two homoeologous chromosomes. Genome-size variation between homoeologous chromosomes 12A and 12D To test genome-size variation between 12A and 12D homoeologous chromosomes, we measured the lengths of both mitotic-metaphase and meiosis-pachytene chromosomes in 50 and 20 well-spread cells, respectively. The centromere location was accurately defined using the centromere-specific BAC t097G20. The total lengths of 12A and 12D were 141.91 and 107.76 µm, respectively, in the pachytene stage and 3.05 and 2.30 µm, respectively, in the metaphase stage. The arm ratios (short/long), 0.54 and 0.55 in the metaphase, and 0.41 and 0.40 in the pachytene were very similar in 12A and 12D. Two homoeologous chromosomes showed the same stretching ratio (∼47 times) between pachytene and metaphase stages. The total length of chromosome 12A was 1.3-fold longer than that of 12D (Table 2). To find out the locations of size differences between the two chromosomes, we calculated the ratios of physical distances between the same pair of BACs using 13 D-subgenome- and 5 A-subgenome-specific BACs that detected FISH signals on both chromosomes as presented above (see Fig. 3a, d). As expected, the distance ratios (A/D BACs) between 13 out of 19 pairs of BAC tested were larger than 1 (Fig. 4), indicating a longer chromosomal segments in 12A than in 12D. Two regions displaying largest values with ratios of 2.8 between t336G12 and t200M10 and 1.83 between t097G20 to t112E02 may be responsible for genome-size variation between 12A and 12D. The more expansion between t097G20 and t112E02 in 12A than that in 12D indicated a high amount of heterochromatin in the pericentric region of 12A, which is consistent with the DAPI-staining results. The largest ratio of 2.8 between t336G12 and t200M10 indicated either an expansion in 12A or a deletion in 12D. Our comprehensive analysis of integrated genetic and cytogenetic maps suggests that uneven expansion or contraction between different regions of homoeologous chromosomes leads to genomesize variation in A and D homoeologous chromosomes.
Discussion Integrated genetic and cytogenetic maps of homoeologous chromosomes 12A and 12D Several cotton genetic maps have been developed and refined through linkage analysis using molecular markers
262
Chromosoma (2010) 119:255–266
b
a
t163D05 t331N02 t215O23 t081H09 t246C12 t107F20 r010G17
Chr. 12D
Chr. 12D t115A01 r067L14 r012M1 t259L20 r070L23 t208C15 r046P23
Chr. 12A
r075N02 t283I16 t110E13 r004O22 r105F05 t112E02
Chr. 12A t163D05
c
d
t174A01
t174A01 r038P15
r051E21
t263K12 t336G12 t200M10 r078J02
r043C02
Chr. 12D
r075A11
Chr. 12A r038P15
t259M16 r079A04
r051E21 r079A04 t259M16
Chr. 12D Chr. 12A
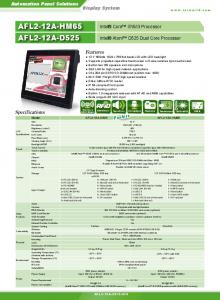
Fig. 3 FISH mapping showing variation between homoeologous chromosomes 12A and 12D. a One set of 13 BACs anchored on the long arm of 12D generated signals on both long arms of chromosomes 12A and 12D with the same order in one cell. BAC clones are indicated in chromosome 12A. b Seven BACs anchored on the short and long arms of 12D were hybridized, whereas only one BAC t163D05 produced signals in both chromosomes 12A and 12D. Another BAC r105F05 (red signals, arrowhead) was used as a control for the long arm. BAC clones are indicated in chromosome 12D. c
With the exception of r043C02, all BAC probes anchored on the long arm of chromosome 12A generated signals in chromosome 12A and 12D as well. BACs r079A04 and t174A01 produced weaker signals than others. BAC clones are indicated in both 12A and 12D. d Five BACs anchored on the short arm of chromosome 12A were hybridized with both chromosomes 12A and 12D with a consistent order. Note that the different distance between BACs t200M10 and r078J02. BAC clones are indicated in chromosome 12D. Bars 10 µm
(Guo et al. 2008; Nguyen et al. 2004; Rong et al. 2004). Although they are valuable genomic resources, the linkage maps provide little information about physical locations, distributions, distances, and sometimes orientations of genetic markers. Using a large number of markerassociated BACs, we developed the first comprehensive cytogenetic maps of homoeologous chromosomes 12A and
12D in tetraploid cotton. The integration between genetic positions of DNA markers into physical locations of BACs provides new insights into structure and organization of homoeologous chromosomes in tetraploid cotton, which will ultimately facilitate the assembly of cotton genomic sequences (Chen et al. 2007). Meiotic pachytene chromosomes are generally 10-25 times longer than metaphase
Chromosoma (2010) 119:255–266
263
Table 2 Lengths and arm ratios of pachytene chromosomes 12A and 12D in Gossypium hirsutum L. Type of chr.
Chr.
Short arm (µm)
Long arm (µm)
Total length (µm)
Arm ratio
No. cells
Mitotic metaphase
12A 12D 12A 12D
1.06±0.14 0.81±0.11 41.35±6.30 30.96±4.46
1.99±0.30 1.49±0.18 100.56±9.62 76.79±11.36
3.05±0.39 2.30±0.26 141.91±12.81 107.76±13.78
0.54±0.08 0.55±0.06 0.41±0.07 0.40±0.06
50 50 20 20
Meiotic pachytene
chromosomes and provide excellent cytogenetic maps with a resolution between metaphase chromosomes and DNA fibers (Harper and Cande 2000). The morphology and cytological landmarks of pachytene chromosomes are well
Fig. 4 Genome-size variation between homoeologous chromosomes 12A and 12D. Ideograms of pachytene chromosomes 12A and 12D based on the FISH mapping results shown in Fig. 2a, c. The segments separated by the same BAC pairs in chromosomes 12A and 12D are linked by lines, and the distance ratios are indicated. Values on the left of 12A and right of 12D are the cytological distances separating the BACs. The data are averaged from seven measurements
preserved, making it suitable for FISH mapping. Although cotton has relatively small chromosomes, pachytene chromosomes are notably long, ∼47 times longer than their corresponding mitotic metaphase chromosomes. FISH mapping using marker-associated BACs enables us to effectively integrate cytogenetic maps with corresponding genetic loci. The integrated cytogenetic maps of homoeologous chromosomes 12A and 12D indicated that the orders of most genetic markers are colinear with corresponding BAC locations although several closely linked loci in 12D display inconsistent orders or locations compared with those in BAC FISH maps. It is valueless for resolving small genetic distances in linkage maps. For example, two pairs of homoeologous BACs, t246C12 and t107F20 and r105F05 and t112E02, which were located on euchromatic and heterochromatic regions, respectively, and separated by 0.6 and 1.9 cM in linkage maps, were unambiguously resolved in pachytene FISH maps. The physical distance can be as close as 50 kb between two adjacent BACs t246C12 and t107F20. Although these two BACs did not overlap, after library screening using SSR markers NAU3006-220 and BNL840-165, we found BAC t246F19 with a 50-kb insert that bridged the two BACs, suggesting that the physical distance between BACs t246C12 and t107F20 is close to 50 kb. The HindIII-fingerprinting results indicated no overlap between these two BACs (data not shown). Suppression of genetic recombination in the pericentromeric regions often leads to the discrepancies between genetic and physical distances in many plant species, including maize (Wang et al. 2006a), wheat (Gill et al. 1996), tomato (Tanksley et al. 1992), barley (Kunzel et al. 2000), and sorghum (Islam-Faridi et al. 2002; Kim et al. 2005). In particular, recombination in the pericentromeric regions, which may account for up to 50% of the length of each chromosome, is highly suppressed in sorghum, wheat, and barley (Gill et al. 1993; Islam-Faridi et al. 2002; Kim et al. 2005; Kunzel et al. 2000). In this study, the genetic distance between markers NAU877-205 and BNL3816-195 is only 3.2 cM, representing 2.5% of total linkage distance of chromosome 12D in the linkage map (Guo et al. 2008), whereas the physical distance between these two markers corresponds to 20.8% of total length of the chromosome (Fig. 2d). This implies very low recombination rates in this
264
pericentromeric region. However, recombination between markers BNL1669-170 and NAU2372-265 in the long arm of 12D was also suppressed although there is no obvious heterochromatin in this region according to the DAPIstaining results (Fig. 2d). The two BACs are separated by 20.9% of the total chromosome length, which corresponds to only 6.6% of the total genetic distance. If the recombination suppression in this region is related with its chromosome rearrangement remains to be investigated. In chromosome 12A, the recombination suppression in the pericentromeric region was not detected because the current physical map consisted of a limited number of polymorphic BACs. Compared to the physical map (43.2% physical length), the recombination frequency (34.5%) was slightly reduced (1.25-fold) between markers NAU2096-200 and NAU3561-370, which covered the entire pericentromeric region extending to the short arm. However, marker NAU2096-200 was close to the pericentromeric heterochromatin block (Fig. 2b), and the genetic and physical distances between them were equal (46.0%). This suggests that 1.25-fold recombination reduction occurs in the pericentromeric region of the short arm, which is consistent with absence of recombination suppression in the pericentromeric region of 12D. Homologous relationships between chromosomes 12A and 12D G. hirsutum L. is an allotetraploid that contains two subgenomes originating from related ancestor species with different genome sizes. Genomic changes in homoeologous chromosomes have been studied in tetraploid cotton, suggesting that the homoeologous loci are mainly additive (Liu et al. 2001), evolve independently (Cronn et al. 1999), and well conserved in the regions containing AdhA and CesA genes (Grover et al. 2004, 2007). These results were obtained from analyzing random genomic sequences and a few pair of homoeologous BAC sequences. These views have been updated by our compressive analysis of two homoeologous chromosomes in tetraploid cotton. Among 31 BACs, 25 (81%) including three homoeologous-specific BACs, except for the centromere-specific BAC, produced consistent orders of FISH signals in both homoeologous chromosomes (Fig. 3). This suggests that the majority of homoeologous chromosomes 12A and 12D remains conserved and homologous after polyploidization that occurred ∼2 MYA (Cronn et al. 2002; Seelanan et al. 1997; Wendel 1989). However, five BACs located in the pericentromeric region from centromere to 41.1% in 12D do not have obvious FISH signals on its corresponding homoeologous chromosome 12A. The integrated cytogenetic and linkage maps indicated that this region has active recombination events in 12D, although the heterochromatic region is
Chromosoma (2010) 119:255–266
relatively small. All homoeologous-specific BACs were dispersed in the distal region of long arms. Likewise, BACs in the distal region of short arms generated bright homoeologous FISH signals. Several previous studies have shown that high recombination rates are usually correlated to high gene densities (Barakat et al. 1997; Broman et al. 1998; Collins et al. 1996; Gill et al. 1996; Thuriaux 1977). Our data imply that pericentromeric regions of long arms in homoeologous chromosomes 12A and 12D may also be gene-rich. In general, the distal regions of homoeologous chromosomes 12A and 12D are more similar than the pericentromic regions. Potential mechanisms for genome-size evolution in chromosomes 12A and 12D Conservation of genic and intergenic regions suggests that genome-size evolution between A- and D-subgenomes occurs at regional levels (Grover et al. 2004). This observation has not been tested in a genome-wide scale. Here, we provide a detailed chromosomal view of genomesize variation between homoeologous chromosomes 12A and 12D that show 1.3-fold size variation. Each alignment between homoeologous regions exhibits a 1.23-fold size variation, which is approximately the overall size difference (∼1.3-fold) between the two chromosomes. But uneven expansion or contraction between different regions of homoeologous chromosomes leads to genome-size variation in A and D homoeologous chromosomes. The distal regions of chromosomes 12A and 12D are highly conserved; however, either an expansion in 12A or a deletion in 12D occurred in this region between t336G12 and t200M10 result in 2.8 time difference in genome size between 12A and 12D. DAPI-staining and BAC-FISH all revealed that the more expansion with a high amount of heterochromatin in the pericentric region of 12A than that in 12D leads to more genome size in 12A. In summary, the first set of integrated genetic and cytogenetic maps in two homoeologous chromosomes in cotton presents a comprehensive and comparative analysis of conservation and changes in genetic and genomic footprints between these two homoeologous chromosomes. These maps have not only provided insights into genome evolution of homoeologous chromosomes but also serve as a template to facilitate genome sequencing and sequence assembly in tetraploid cotton.
Acknowledgments We thank Prof. Xiue Wang of Nanjing Agricultural University and Prof. Weichang Yu of Chinese University of Hong Kong for technical assistance in FISH analysis. This work was supported by the National Natural Science Foundation of China (30700510, 30730067), Natural Science Foundation of Jiangsu Province of China (BK2008333), and State Key Laboratory of Crop
Chromosoma (2010) 119:255–266 Genetics and Germplasm Enhancement (010-60066009, 01060060305-2). The work in the Z. Jeffrey Chen and David M. Stelly labs was supported by the grant from the US National Science Foundation Plant Genome Research grant (DBI0624077).
Conflict of interest The authors declare that they have no conflict of interest.
References Barakat A, Carels N, Bernardi G (1997) The distribution of genes in the genomes of Gramineae. Proc Natl Acad Sci USA 94:6857–6861 Broman KW, Murray JC, Sheffield VC, White RL, Weber JL (1998) Comprehensive human genetic maps: individual and sex-specific variation in recombination. Am J Hum Genet 63:861–869 Chen ZJ (2007) Genetic and epigenetic mechanisms for gene expression and phenotypic variation in plant polyploids. Annu Rev Plant Biol 58:377–406 Chen ZJ, Scheffler BE, Dennis E, Triplett BA, Zhang T, Guo W, Chen X, Stelly DM, Rabinowicz PD, Town CD, Arioli T, Brubaker C, Cantrell RG, Lacape JM, Ulloa M, Chee P, Gingle AR, Haigler CH, Percy R, Saha S, Wilkins T, Wright RJ, Van Deynze A, Zhu Y, Yu S, Abdurakhmonov I, Katageri I, Kumar PA, Mehboob Ur R, Zafar Y, Yu JZ, Kohel RJ, Wendel JF, Paterson AH (2007) Toward sequencing cotton (Gossypium) genomes. Plant Physiol 145:1303–1310 Chen D, Ding Y, Guo W, Zhang T (2009) Molecular mapping of genic male-sterile genes ms15, ms5 and ms6 in tetraploid cotton. Plant Breed 128:193–198 Collins A, Frezal J, Teague J, Morton NE (1996) A metric map of humans: 23,500 loci in 850 bands. Proc Natl Acad Sci USA 93:14771–14775 Cronn RC, Small RL, Wendel JF (1999) Duplicated genes evolve independently after polyploid formation in cotton. Proc Natl Acad Sci USA 96:14406–14411 Cronn RC, Small RL, Haselkorn T, Wendel JF (2002) Rapid diversification of the cotton genus (Gossypium: Malvaceae) revealed by analysis of sixteen nuclear and chloroplast genes. Am J Bot 89:707–725 De Jong JH, Fransz P, Zabel P (1999) High resolution FISH in plants—techniques and applications. Trends Plant Sci 4:258–263 Dong CG, Ding YZ, Guo WZ, Zhang TZ (2007) Fine mapping of the dominant glandless Gene Gle2 in Sea island cotton (Gossypium barbadense L.). Chin Sci Bull 52:3105–3109 Fransz P, Armstrong S, Alonso-Blanco C, Fischer TC, Torres-Ruiz RA, Jones G (1998) Cytogenetics for the model system Arabidopsis thaliana. Plant J 13:867–876 Fryxell PA (1992) A revised taxonomic interpretation of Gossypium L. (Malvaceae). Rheedea 2:108–165 Gerstel DU (1953) Chromosome translocations in interspecific hybrids of the genus Gossypium. Evolution 7:234–244 Gill KS, Gill BS, Endo TR (1993) A chromosome region-specific mapping strategy reveals gene-rich telomeric ends in wheat. Chromosoma 102:374–381 Gill KS, Gill BS, Endo TR, Taylor T (1996) Identification and highdensity mapping of gene-rich regions in chromosome group 1 of wheat. Genetics 144:1883–1891 Grover CE, Kim H, Wing RA, Paterson AH, Wendel JF (2004) Incongruent patterns of local and global genome size evolution in cotton. Genome Res 14:1474–1482 Grover CE, Kim H, Wing RA, Paterson AH, Wendel JF (2007) Microcolinearity and genome evolution in the AdhA region of diploid and polyploid cotton (Gossypium). Plant J 50:995–1006
265 Grover CE, Yu Y, Wing RA, Paterson AH, Wendel JF (2008) A phylogenetic analysis of indel dynamics in the cotton genus. Mol Biol Evol 25:1415–1428 Guo W, Cai C, Wang C, Zhao L, Wang L, Zhang T (2008) A preliminary analysis of genome structure and composition in Gossypium hirsutum. BMC Genomics 9:314 Hanson RE, Zwick MS, Choi S, Islam-Faridi MN, McKnight TD, Wing RA, Price HJ, Stelly DM (1995) Fluorescent in situ hybridization of a bacterial artificial chromosome. Genome 38:646–651 Hanson RE, Islam-Faridi MN, Percival EA, Crane CF, Ji Y, McKnight TD, Stelly DM, Price HJ (1996) Distribution of 5S and 18S-28S rDNA loci in a tetraploid cotton (Gossypium hirsutum L.) and its putative diploid ancestors. Chromosoma 105:55–61 Harper LC, Cande WZ (2000) Mapping a new frontier; development of integrated cytogenetic maps in plants. Funct Integr Genomics 1:89–98 Hawkins JS, Kim H, Nason JD, Wing RA, Wendel JF (2006) Differential lineage-specific amplification of transposable elements is responsible for genome size variation in Gossypium. Genome Res 16:1252–1261 Hu Y, Guo WZ, Zhang TZ (2009) Construction of a bacterial artificial chromosome library of TM-1, a standard line for genetics and genomics in Upland cotton. J Integr Plant Biol 51:107–112 Islam-Faridi MN, Childs KL, Klein PE, Hodnett G, Menz MA, Klein RR, Rooney WL, Mullet JE, Stelly DM, Price HJ (2002) A molecular cytogenetic map of sorghum chromosome 1. fluorescence in situ hybridization analysis with mapped bacterial artificial chromosomes. Genetics 161:345–353 Jack Mursal I, Endrizzi JE (1976) A reexamination of the diploidlike meiotic behavior of polyploid cotton. Theor Appl Genet 47:171– 178 Ji Y, Zhao X, Paterson AH, Price HJ, Stelly DM (2007) Integrative mapping of Gossypium hirsutum L. by meiotic fluorescent in situ hybridization of a tandemly repetitive sequence (B77). Genetics 176:115–123 Jiang J, Gill BS (2006) Current status and the future of fluorescence in situ hybridization (FISH) in plant genome research. Genome 49:1057–1068 Kapuscinski J (1995) DAPI: a DNA-specific fluorescent probe. Biotech Histochem 70:220–233 Kato A, Vega JM, Han F, Lamb JC, Birchler JA (2005) Advances in plant chromosome identification and cytogenetic techniques. Curr Opin Plant Biol 8:148–154 Kato A, Albert PS, Vega JM, Birchler JA (2006) Sensitive fluorescence in situ hybridization signal detection in maize using directly labeled probes produced by high concentration DNA polymerase nick translation. Biotech Histochem 81:71–78 Kim JS, Klein PE, Klein RR, Price HJ, Mullet JE, Stelly DM (2005) Molecular cytogenetic maps of Sorghum linkage groups 2 and 8. Genetics 169:955–965 Kunzel G, Korzun L, Meister A (2000) Cytologically integrated physical restriction fragment length polymorphism maps for the barley genome based on translocation breakpoints. Genetics 154:397–412 Lakatošová M, Holečková B (2007) Fluorescence in situ hybridisation. Biologia 62:243–250 Liu B, Brubaker CL, Mergeai G, Cronn RC, Wendel JF (2001) Polyploid formation in cotton is not accompanied by rapid genomic changes. Genome 44:321–330 Masterson J (1994) Stomatal size in fossil plants: evidence for polyploidy in majority of angiosperms. Science 264:421–424 Nguyen TB, Giband M, Brottier P, Risterucci AM, Lacape JM (2004) Wide coverage of the tetraploid cotton genome using newly developed microsatellite markers. Theor Appl Genet 109:167– 175
266 Otto SP, Whitton J (2000) Polyploid incidence and evolution. Annu Rev Genet 34:401–437 Rong J, Abbey C, Bowers JE, Brubaker CL, Chang C, Chee PW, Delmonte TA, Ding X, Garza JJ, Marler BS, Park CH, Pierce GJ, Rainey KM, Rastogi VK, Schulze SR, Trolinder NL, Wendel JF, Wilkins TA, Williams-Coplin TD, Wing RA, Wright RJ, Zhao X, Zhu L, Paterson AH (2004) A 3347-locus genetic recombination map of sequence-tagged sites reveals features of genome organization, transmission and evolution of cotton (Gossypium). Genetics 166:389–417 Rong J, Pierce GJ, Waghmare VN, Rogers CJ, Desai A, Chee PW, May OL, Gannaway JR, Wendel JF, Wilkins TA, Paterson AH (2005) Genetic mapping and comparative analysis of seven mutants related to seed fiber development in cotton. Theor Appl Genet 111:1137–1146 Schwarzacher T (2003) DNA, chromosomes, and in situ hybridization. Genome 46:953–962 Seelanan T, Schnabel A, Wendel JF (1997) Congruence and consensus in the cotton tribe. Syst Bot 22:259–290 Tanksley SD, Ganal MW, Prince JP, de Vicente MC, Bonierbale MW, Broun P, Fulton TM, Giovannoni JJ, Grandillo S, Martin GB et al (1992) High density molecular linkage maps of the tomato and potato genomes. Genetics 132:1141–1160 Thuriaux P (1977) Is recombination confined to structural genes on the eukaryotic genome? Nature 268:460–462 Tomkins JP, Peterson DG, Yang TJ, Main D, Wilkins TA, Paterson AH, Wing RA (2001) Development of genomic resources for cotton (Gossypium hirsutum L.): BAC library construction, preliminary STC analysis, and identification of clones associated with fiber development. Mol Breed 8:255–261 Udall JA, Swanson JM, Haller K, Rapp RA, Sparks ME, Hatfield J, Yu Y, Wu Y, Dowd C, Arpat AB, Sickler BA, Wilkins TA, Guo JY, Chen XY, Scheffler J, Taliercio E, Turley R, McFadden H, Payton P, Klueva N, Allen R, Zhang D, Haigler C, Wilkerson C, Suo J, Schulze SR, Pierce ML, Essenberg M, Kim H, Llewellyn DJ, Dennis ES, Kudrna D, Wing R, Paterson AH, Soderlund C, Wendel JF (2006) A global assembly of cotton ESTs. Genome Res 16:441–450 Wang CJ, Harper L, Cande WZ (2006a) High-resolution single-copy gene fluorescence in situ hybridization and its use in the construction of a cytogenetic map of maize chromosome 9. Plant Cell 18:529–544 Wang K, Song X, Han Z, Guo W, Yu JZ, Sun J, Pan J, Kohel RJ, Zhang T (2006b) Complete assignment of the chromosomes of
Chromosoma (2010) 119:255–266 Gossypium hirsutum L. by translocation and fluorescence in situ hybridization mapping. Theor Appl Genet 113:73–80 Wang K, Guo W, Zhang T (2007a) Detection and mapping of homologous and homoeologous segments in homoeologous groups of allotetraploid cotton by BAC-FISH. BMC Genomics 8:178 Wang K, Guo W, Zhang T (2007b) Development of one set of chromosome-specific microsatellite-containing BACs and their physical mapping in Gossypium hirsutum L. Theor Appl Genet 115:675–682 Wang K, Zhang YJ, Guan B, Guo W, Zhang T (2007c) Fluorescence in situ hybridization of bacterial artificial chromosome in cotton. Prog Biochem Biophys 34:1216–1222 Wang K, Guan B, Guo W, Zhou B, Hu Y, Zhu Y, Zhang T (2008) Completely distinguishing individual A-genome chromosomes and their karyotyping analysis by multiple bacterial artificial chromosome-fluorescence in situ hybridization. Genetics 178: 1117–1122 Wendel JF (1989) New World tetraploid cottons contain Old World cytoplasm. Proc Natl Acad Sci USA 86:4132–4136 Xu J, Earle ED (1996) High resolution physical mapping of 45S (5.8S, 18S and 25S) rDNA gene loci in the tomato genome using a combination of karyotyping and FISH of pachytene chromosomes. Chromosoma 104:545–550 Yang SS, Cheung F, Lee JJ, Ha M, Wei NE, Sze SH, Stelly DM, Thaxton P, Triplett B, Town CD, Chen ZJ (2006) Accumulation of genome-specific transcripts, transcription factors and phytohormonal regulators during early stages of fiber cell development in allotetraploid cotton. Plant J 47:761–775 Yin J, Guo W, Yang L, Liu L, Zhang T (2006) Physical mapping of the Rf1 fertility-restoring gene to a 100-kb region in cotton. Theor Appl Genet 112:1318–1325 Zhao XP, Si Y, Hanson RE, Crane CF, Price HJ, Stelly DM, Wendel JF, Paterson AH (1998) Dispersed repetitive DNA has spread to new genomes since polyploid formation in cotton. Genome Res 8:479–492
Ethical standards The experiments comply with the current laws of China.