sites of known enzyme structures, the comparison and alignment of protein structures has come to be .... a Type: Program (P); Server (S); Database (D). ...... pilot centers as well as six new specialized centers, including two centers dedicated to.
16 STRUCTURE COMPARISON AND ALIGNMENT Marc A. Marti-Renom, Emidio Capriotti, Ilya N. Shindyalov, and Philip E. Bourne
INTRODUCTION Since the 1970s, after the seminal work of Rossmann and Argos (1978) comparing binding sites of known enzyme structures, the comparison and alignment of protein structures has come to be a fundamental and widely used task in computational structure biology. Three main steps are needed for comparing two protein structures: first, the detection of their common similarities; second, the alignment of the structures based on such similarities; and third, a statistical measure of the similarity. Considering the first two steps, structure comparison refers to the analysis of the similarities and differences between two or more structures, and structure alignment refers to establishing which amino acid residues are equivalent between them. The majority of commonly used methods do a reasonably good job in recognizing obvious similarities between protein structures. However, the alignment of two or more structures is a more difficult task, and its accuracy may depend on the method or program used as well as what the user is trying to accomplish, which will be discussed subsequently. All programs that are briefly described in this chapter perform both steps and are commonly known as protein structure alignment methods. It is also important to immediately clear up any confusion between structure alignment and structure superposition since such terms are often interchanged in the literature. As mentioned above, structure alignment tries to identify the equivalences between pairs of amino acid residues from the structures to superpose, while structure superposition requires the previous knowledge of such equivalences. Thus, structure superposition tries to solve the simpler geometrical task of minimizing the distance between already known equivalent residues of the superimposed structures by finding a transformation that produces either the lowest root-mean-square deviation (RMSD) or the maximal equivalences within an Structural Bioinformatics, Second Edition Edited by Jenny Gu and Philip E. Bourne Copyright � 2009 John Wiley & Sons, Inc.
397
398
STRUCTURE COMPARISON AND ALIGNMENT
RMSD cutoff. Structure superposition methods have been around for some time (Diamond, 1976; Kabsch, 1976; Hendrickson, 1979; Kearsley, 1989). However, structure comparison and alignment methods, recently reviewed (Carugo, 2007; Mayr, Domingues, and Lackner, 2007), were developed later (Usha and Murthy, 1986; Sali and Blundell, 1990; Boberg, Salakoski, and Vihinen, 1992; Kikuchi, 1992; Shapiro et al., 1992; Holm and Sander, 1993b; Johnson, Overington, and Blundell, 1993; Orengo et al., 1993; Overington et al., 1993; Holm and Sander, 1994a; Lessel and Schomburg, 1994). We begin this chapter by introducing the use of protein structure comparison and alignment for characterizing a fundamental principle in biology. Then we describe the general approach to structure comparison by outlining some of the most widely used methods. Next, we introduce two particular scenarios involving protein structure comparison, multiple structure alignment and flexible structure alignment. Finally, the large-scale application of methods for protein structure comparison and their impact on characterizing structure space is introduced in the context of structure genomics. As a quick guide, a list of common Internet resources for protein structure comparison and alignment is provided in Table 16.1. Impact of Protein Structure Comparison and Alignment Similarly to sequence-based alignment methods, structure-based alignment methods have been widely used for characterizing biological processes. In fact, this book includes a broad overview of several approaches that rely on protein structure comparison and alignment: .
.
.
Chapters 17 and 18 introduce two widely accepted structure classification systems, the SCOP (Andreeva et al., 2004) and CATH (Greene et al., 2007) databases. Both efforts result in a hierarchical classification of the known structure space of protein domains. Chapter 21 focuses on methods for inferring protein function from structure (Godzik, Jambon, and Friedberg, 2007). In such approaches, structure alignments usually play an important role. Functional inference is relevant to structure genomics, which results in a rapid increase in the number of experimentally determined protein structures of unknown function (Chapter 40). Chapters 30 to 32 introduce protein structure prediction and model evaluation, which rely heavily on structure alignment methods for classifying the structure space, assessing the likely accuracy of a model, and/or evaluating its actual accuracy.
Chothia and Lesk (1986) first observed, when the number of structures was limited, that protein structure was more conserved than protein sequence. As such, protein structures can provide protein sequence alignments of an accuracy that would not be achievable from sequence alignments alone. This ability is becoming a major contribution to the field of structural bioinformatics and is best illustrated in the consideration of evolution studied through protein structure (Chapters 17, 18, and 23). On the Relationship Between Sequence and Structure Since evolution conserves protein structure more than protein sequence, it follows that the number of possible structure folds is less than the number of sequence families. How much is
INTRO DUCTION
399
T A B L E 1 6 . 1 . Popular Internet Resources for Structure Comparison and Alignment Name
Ta
Reference
Root URL
CATH CE
D P
http://www.cathdb.info http://www.sdsc.edu
CE-MC DALI DBAli FATCAT EXPRESSO GANGSTA KENOBI/K2
S D D S S S S
MAMMOTH
S
MAMMOTH-Mult
S
MultiProt
S
MUSTANG LGA lovoAlign
S S S
SARF2 SCOP SSAP STAMP
S D S S
POSA ProFit SALIGN
S S P
TM-Align TOPOFIT
S S
VAST
S
Greene et al. (2007) Shindyalov and Bourne (1998) Guda et al. (2004) Holm and Sander (1996) Marti-Renom et al. (2007) Ye and Godzik (2004) Armougom et al. (2006) Kolbeck et al. (2006) Szustakowski and Weng (2000) Ortiz, Strauss and Olmea (2002) Lupyan, Leo-Macias, and Ortiz (2005) Shatsky, Nussinov, and Wolfson (2004) Konagurthu et al. (2006) Zemla (2003) Martinez, Andreani, and Martinez (2007) Alexandrov (1996) Andreeva et al. (2004) Orengo and Taylor (1996) Russell, Copley, and Barton (1996) Ye and Godzik (2005) Not published Not published, MODELLER manual Zhang and Skolnick (2005b) Ilyin, Abyzov, and Leslin (2004) Madej, Gibrat, and Bryant (1995)
a
http://bioinformatics.albany.edu http://www.ebi.ac.uk http://www.dbali.org http://fatcat.burnham.org http://www.tcoffee.org http://gangsta.chemie.fu-berlin.de http://zlab.bu.edu http://ub.cbm.uam.es http://ub.cbm.uam.es http://bioinfo3d.cs.tau.ac.il http://www.cs.mu.oz.au http://as2ts.llnl.gov http://www.ime.unicamp.br http://123d.ncifcrf.gov http://scop.mrc-lmb.cam.ac.uk/scop http://www.cathdb.info http://www.compbio.dundee.ac.uk http://fatcat.burnham.org http://www.bioinf.org.uk http://www.salilab.org http://zhang.bioinformatics.ku.edu http://mozart.bio.neu.edu http://www.ncbi.nlm.nih.gov/ Structure/VAST/
Type: Program (P); Server (S); Database (D).
implied by ‘‘less than’’ is remarkable. There are a total of 20300 possible sequences of 300 residues, which is more than the number of atoms in the universe. However, evolution has selected a very small subset of those protein sequences (less than 30,000 in human) and an even smaller number of protein folds (1000–5000) (Reeves et al., 2006) (Chapter 2). As stated above, such a reduction from sequence space to structure space was first quantified by Chothia and Lesk in the 1980s (Lesk and Chothia, 1980; Lesk and Chothia, 1982; Chothia and Lesk, 1986; Chothia and Lesk, 1987), later confirmed by Sander and Schneider (1991), and recently updated by Rost (1999). To illustrate this relationship here, we have taken a set
400
STRUCTURE COMPARISON AND ALIGNMENT
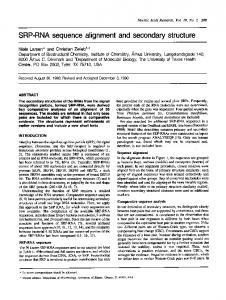
Figure 16.1. Structure similarity versus sequence similarity. Plotted data was obtained from 159,777 pair-wise structural alignments by MAMMOTH comparing 1000 randomly selected protein chains against the complete structural space deposited in the PDB as of March 2007(�87,000 chains). The 1,000 chains set was obtained from a nonredundant set of structures where alignments between any two chains in the list fails at least one of the following four cutoffs: a minimum of �
�
20% sequence identity, a minimum of 75% of Ca atoms aligned within 4 A, a maximum of 3 A Ca RMSD, and a maximum of 50 residues difference in length. Sequence identity is plotted against the number of superposed residues (left). The frequency distribution plotted against sequence identity with the 159,777 pair-wise structural alignments are shown on the right.
of 1000 randomly selected chains from 11,900 nonredundant chains in DBAli (MartiRenom, Ilyin, and Sali, 2001; Marti-Renom et al., 2007) to generate the plots in Figure 16.1. The data for the plots were obtained from 154,777 pair-wise alignments stored in DBAli, using as a query each of the 1000 selected chains that were aligned by MAMMOTH (Ortiz, Strauss, and Olmea, 2002) against all �87,000 chains in the Protein Data Bank (PDB) (Berman et al., 2000). Only pair-wise alignments that aligned at least 75% of the Ca atoms of a query structure are plotted. As already observed by Rost (1997), a substantial number of the similar pairs of structures have sequence identities near the values of randomly selected pairs of sequences (�10%). Moreover, Rost assessed that the symmetric shape of the distribution at low sequence identity (40% sequence identity, yet the structures within those regions are completely different (i.e., mostly b versus mostly a, respectively). In short, structure alignment methods and their results, although only a guideline, have been essential for characterizing the relationship between sequence and structure and its implications in protein evolution.
GENERAL APPROACH TO STRUCTURE COMPARISON AND ALIGNMENT Structure comparison and alignment is an NP-hard problem, which is only computationally tractable by using heuristics. As a result, the variety of solutions for aligning two protein structures reflect the differences in the heuristics used by each method. Moreover, even if the NP-hard problem were computationally tractable, it is very likely that for pairs of distantly related protein structures, the final alignment would not reveal new biological insights. In fact, for such protein pairs, different structure comparison methods may produce alignments that differ in every position (Godzik, 1996). Thus, it is important to experiment with a different algorithms and to assess the strengths and weaknesses of each method when the quality of the alignment is important to your research. There is a significant body of literature on protein structure comparison and alignment methods to help you in this regard. The reviews listed here are not exhaustive but do provide a historical perspective of the field. In 1994, Orengo comprehensively reviewed a series of methods used in protein structure domain classification (Orengo, 1994). Later on, Gibrat and coworkers reviewed the first structure comparison methods that were fast enough to be effectively used on large numbers of protein structures (Gibrat, Madej, and Bryant, 1996). Lemmen and Lengauer (2000) reviewed the more general field of molecular superposition within drug discovery. The authors provided a perspective on how superposition methods may effectively be used for database screening. In 2001, Koehl highlighted that although protein structure methods were mature enough to be applied in large-scale experiments, it was clear that a reliable score was still needed for assessing the significance of remote structure similarities (Koehl, 2001). Finally, a recent review by Carugo (2007) outlined most of the available methods for pairwise, multiple, and flexible structure alignment. In the next section, we outline a few of the most widely used methods for protein structure alignment. However, it is beyond the scope of this chapter to deal with each method in detail, nor to compare them. The intent is to give the reader a sense of the similarities and differences between such approaches. We refer the reader to the original papers for a full description of the methods and the resulting web resources listed in Table 16.1. All methods need to address three problems: 1. Representation: How to represent the input structures in a coordinate-independent space suitable for alignment. 2. Optimization: How to sample the space of possible alignment solutions between the structures. 3. Scoring: How to score a given alignment and determine its statistical significance. We discuss seven widely used and cited protein structure alignment methods: DALI (Holm and Sander, 1993b), SSAP (Orengo and Taylor, 1996), VAST (Madej, Gibrat, and Bryant, 1995; Gibrat, Madej, and Bryant, 1996), SARF2 (Alexandrov, 1996),
401
402
STRUCTURE COMPARISON AND ALIGNMENT
CE (Shindyalov and Bourne, 1998), MAMMOTH (Ortiz, Strauss, and Olmea, 2002), and SALIGN (Sali and Blundell, 1990) with regard to how they address the three problems of structure alignment. A broader list of available methods can be found in Table 16.1. Briefly, the DALI algorithm, which is used in the FSSP database (Holm and Sander, 1994b), aligns two structures by generating a comparison matrix of intramolecular distances and optimizes that matrix using a Monte Carlo procedure. The SSAP algorithm, which is used in the CATH database (Greene et al., 2007), is a method for automatically comparing 3D structures using a double dynamic programming optimizer. The VAST algorithm, which is part of the NCBI’s structure computational services, is a fast similarity search method based on a vector representation of protein structures. The SARF2 algorithm, designed as a similarity search method, compares the spatial arrangements of secondary structure elements computed from the coordinates of proteins. The CE algorithm, also implemented in a multiple structure alignment method CE–MC (Guda, Pal, and Shindyalov, 2006), uses a combinatorial extension (CE) method to extend highly similar pairs of residues, optimizing the best path using dynamic programming (CE) and Monte Carlo optimization (CE–MC). The MAMMOTH algorithm, also implemented in a multiple structure alignment method MAMMOTH-Mult (Lupyan, Leo-Macias, and Ortiz, 2005) and used in the DBAli database (Marti-Renom, Ilyin, and Sali, 2001; Marti-Renom et al., 2007), is a fast method for aligning two structures based on a vector representation of intramolecular distances compared by a dynamic programming optimizer. Finally, the SALIGN command of the MODELLER package (Sali and Blundell, 1993), which is also used in the DBAli database, compares structure properties calculated from the 3D coordinates of two or more proteins that are then aligned by a dynamic programming optimizer. We now look at each of these methods in more detail according to the three issues associated with comparison. Protein Structure Representation DALI uses a distance matrix to represent each structure (Phillips, 1970). Thus, proteins are effectively transformed into 2D arrays of distances between all their Ca atoms. This has the advantage of placing all structures in a simplified common frame of reference. Conceptually, the problem is then straightforward, as if one is imagining each structure’s contact map transparently overlaid. Overlap along the diagonal then represents similar backbone conformations (secondary structure) and off-diagonal similarity in tertiary structure. Moving one sheet of paper horizontally or vertically relative to the other to achieve overlap represents gap insertion into one or other of the structures. A later version of DALI introduced an initial quick lookup of common secondary structure elements (SSEs) between the two proteins. SSAP (Sequence Structure Alignment Program) uses the Cb atoms to generate a set of vectors connecting residues (in the case of glycine, a dummy Cb is used). Such vectors effectively represent the structure in two dimensions providing both position and directionality. VAST (Vector Alignment Search Tool), as the name suggests, represents structures as a set of vectors. In this case, the vectors are calculated from the secondary structure elements whose type, directionality, and connectivity infer the structure topology of the protein. SARF2 transforms the coordinate representation in a set of SSEs using the Ca atom of each residue to calculate the deviation of a-helices and b-sheets from typical SSEs conformations.
C O M P A R IS O N A L G O R I T H M A N D O P T I M I Z A T I O N
CE (Combinatorial Extension) represents proteins as a set of Ca distances for octamers (i.e., between eight consecutive residues in the structure). Each pair of octameric fragments that can be aligned within a given threshold is considered an aligned fragment pair (AFP). MAMMOTH (MAtching Molecular Models Obtained from THeory) transforms the original coordinates of the protein structure into a set of six unit-vectors calculated from the Ca trace of consecutive heptamers (Chew et al., 1999). SALIGN represents proteins by a set of properties or features either calculated from their sequences and structures or arbitrarily defined by the user. Such properties are sequence residue type, interresidue distance, fractional side-chain accessibility, secondary structure, local structure conformation, and a user-specified feature.
COMPARISON ALGORITHM AND OPTIMIZATION DALI creates a set of submatrices of fixed size by collapsing the original distance matrices into regions of overlap. Submatrices are then joined if there is an overlap between adjacent fragments. The optimal superposition of the final matrices is then obtained using the branch and bound algorithm (Holm and Sander, 1996). SSAP searches for the optimal structure alignment by using a double dynamic programming algorithm. First, a set of selected matching positions is defined by applying a dynamic programming algorithm to the matrix of differences between Cb vectors of positions i and k (i is the residue index in the first protein and, k is the residue index in the second protein) and all other positions in their respective proteins. Second, the final Sik matrix is obtained by comparing vectors between Cb atoms at pairs of positions i and j of the same protein to the Cb atoms from the selected matching positions. The final alignment is then computed over the matrix of scores Sik by a second dynamic programming step. VAST uses a Gibbs sampling algorithm from seed SSE pairs to find alternative alignments of SSEs and scoring them by comparing the matches with randomly generated sets of SSE pairs. The final alignment is further refined using a Monte Carlo optimization procedure. SARF2 evaluates pairs of similar SSEs between two structures by comparing the angle between them, the shortest distance between their axes, the closest point on the axes, and the minimum and maximum distances from each SSE to their medium line. SARF2 implements a graph-based optimizer used to solve the maximum clique problem for searching the largest ensembles of the mutually compatible pairs of SSEs. Finally, an extension and refinement of the alignment is computed by adding additional residues to the alignment until a user-defined RMSD threshold is reached. CE uses a combinatorial extension algorithm to identify and combine the most similar AFPs between the compared structures. Three similarity thresholds guide the heuristic procedure for finding the optimal alignment between two proteins. First, a threshold is used to define a set of AFPs between the two structures and to select the AFP that will seed the structure alignment. Second, an iterative process is used to identify new AFPs to be added to the seed alignment (i.e., with a single AFP in the first iteration). The alignment will be then extended if the addition of a new AFP maintains the alignment score within the second threshold. Finally, a third threshold will be used to identify the best possible alignments within a set of solutions. To speed up the process, new extensions of the alignment will be
403
404
STRUCTURE COMPARISON AND ALIGNMENT
performed only with AFPs within 30 residues distance to the current alignment ends. Further optimization is performed on selected alignments by using a dynamic programming algorithm over an interprotein distance matrix. MAMMOTH obtains a similarity matrix between any two heptamers by calculating a URMS (unit-vector root mean square) through optimally superposing their unit-vectors. Then, a dynamic programming algorithm computes the optimal path over the similarity matrix. Finally, a variant of the heuristic implemented in MaxSub (Siew et al., 2000) is used to identify the largest local structure alignment within a given RMSD threshold. SALIGN computes a dissimilarity matrix between equivalent properties from two or more structures. The dissimilarity score is computed by comparing a weighted sum of the six properties representing the proteins. Then, the final alignment will be obtained by finding the optimal path in the matrix by a local or global dynamic programming algorithm using either an affine gap penalty or an environment-dependent gap penalty function. Statistical Analysis of Results DALI computes the statistical significance of an alignment score by using as a background the distribution of scores from an all-against-all comparison of 225 representative structures with less than 30% sequence identity (Hobohm et al., 1992). Such a statistic is expressed as the number of standard deviations from the average score derived from the database background distribution (i.e., a Z-score). SSAP does not explicitly calculate the statistical significance of the SSAP score. However, the scores are empirically calibrated against known structure alignments from the CATH database. Thus, a SSAP score higher than 70 is indicative of topological similarities between the compared structures. VAST computes a p-value to assess the statistical significance of an alignment score. Such a statistic is calculated in a similar manner to its sequence counterpart, BLAST (Altschul et al., 1990). Thus, the p-value for an alignment by VAST is proportional to the probability that its score can be obtained by randomly aligning SSE pairs. As is also true of BLAST, the considered population of possible solutions weights the final p-value. SARF2 final alignment score is calculated as a function of the RMSD and the number of matched Ca atoms between the compared structures. The statistical significance of the final score is then obtained by comparing it to the background distributing of scores from aligning the leghemoglobin protein against a set of 426 nonredundant structures (Fischer et al., 1995). CE computes a Z-score for the final alignment using a set of alignments between representative structures with less than 25% sequence identity (Hobohm et al., 1992). The RMSD and gap score for such alignments are then used to generate normal distributions to calculate the final Z-score of the computed alignment. This normal distribution was later updated with a more realistic extreme value distribution (Jia et al., 2004). MAMMOTH calculates a p-value statistic to assess the significance of a pair-wise alignment. The p-value estimation is based on an extreme value fitting of the scores resulting from a set of random structure alignments (Abagyan and Batalov, 1997). SALIGN does not explicitly calculate a statistical significance of the score from the final alignment. Thus, the user is simply presented with the final dissimilarity score obtained by the optimizer. However, when comparing structures, SALIGN returns a quality score, which � corresponds to the average percentage of equivalent Ca atoms within 3.5 A between all pairs of structures in the alignment.
S A M P L E R E S U L T S FR O M S T R U C T U R E C O M P A R I S O N A N D A L I G N M E N T
HOW WELL ARE WE DOING? Most structure comparison methods will detect global structural similarity between two proteins. However, diverse methods may identify different structure similarity for local alignmnets. Even when local or global similarity can be detected, the details of the sequence alignment derived from structure comparison may differ. Godzik showed that different methods for structure comparison could result in very different alignments for pairs of proteins with low sequence identity (Godzik, 1996). Differences could be so extreme that two methods may result in alignments different at every position. Similar conclusions were obtained comparing several structure classification systems (Hadley and Jones, 1999) or structurally aligning the catalytic core of several protein kinases (Scheeff and Bourne, 2006). Given the heuristics used in protein structure alignment methods, such differences are not surprising. Any method for protein structure alignment needs to balance coverage versus accuracy. In other words, a method may align the core of a protein at very high accuracy (i.e., very low RMSD) and very low coverage (i.e., omitting loop regions), while a second method may prefer to increase the coverage (i.e., include the loop regions in the alignment) to the detriment of accuracy (i.e., increasing the RMSD). How best to address this problem? In part, the answer lies in the question that you wish to address. Certainly, maximizing the biological relevance of a result is going to be the most desirable outcome in the majority of cases. We will come back to this issue at the end, and for now consider the implications of not achieving the optimum biological alignment. Consider the case of comparing expert hand-generated alignments of protein kinases against those produced by the CE algorithm (Scheeff and Bourne, 2005). CE was unable to reproduce an optimal, manually curated alignment of 18 protein kinase structures of low sequence similarity (