Keywords: structure from motion, sequential Monte Carlo methods, video analysis ... and Chen, 1998) proposed a general SMC framework for dynamic systems,.
Structure From Motion Using Sequential Monte Carlo Methods Gang Qian and Rama Chellappa Center for Automation Research, Department of Electrical and Computer Engineering, University of Maryland, College Park, MD 20742-3275, USA
Abstract. In this paper, the structure from motion (SfM) problem is addressed using sequential Monte Carlo methods. A new SfM algorithm based on random sampling is derived to estimate the posterior distributions of camera motion and scene structure for the perspective projection camera model. Experimental results show that challenging issues in solving the SfM problem, due to erroneous feature tracking, feature occlusion, motion/structure ambiguity, mixed-domain sequences, mismatched features, and independently moving objects, can be well modeled and effectively addressed using the proposed method. Keywords: structure from motion, sequential Monte Carlo methods, video analysis Abbreviations: SfM – structure from motion; SIS – sequential importance sampling
Table of Contents 1
Introduction
2
2
Bayesian Motion Estimation
4
3
Estimation of Translation Magnitude and Scene Structure
21
4
Experimental Results and Performance Analysis
31
5
Conclusion
42
A
A Proposition
43
B
Proof of Equation (33)
43
C
Proof of Equation (46)
44
c 2004 Kluwer Academic Publishers. Printed in the Netherlands. °
ijcv_sis.tex; 15/01/2004; 14:55; p.1
2
Gang Qian and Rama Chellappa
1. Introduction
In general, structure from motion (SfM) refers to the task of of recovering the 3D (stationary or dynamic) scene structure and sensor motion trajectory given a set of 2D (monocular or stereo) image frames obtained from a (calibrated or uncalibrated) optical camera. In this paper, we focus on SfM using image frames captured by a monocular calibrated camera - i.e., the principal point and the field of view (FOV) of the camera are assumed to be known. The SfM problem has been a very active research area in computer vision since early eighties when Longuet-Higgins published the famous ”eight point” algorithm (Longuet-Higgins, 1981). The past two decades have witnessed a multitude of methods for solving the SfM problem. These methods can be classified based on the camera projection models (perspective/affine projection), observation sources (image pair, image tuple or video sequence), and token types (sparse feature correspondence, dense optical flow field, lines or curves, or even direct SfM techniques that do not extract any tokens from the images). Reviews and comparison of different SfM methods can be found in (Jerian and Jain, 1991; Huang and Netravali, 1994; Faugeras, 1993; Tian et al., 1996; Jebara et al., 1999; Oliensis, 2000). Although many algorithms have been developed, few give satisfactory performance in real applications. To develop an SfM method that performs well in practice, one must consider the following issues: (1) observation noise (noise present in token correspondence or in computing optical flow), (2) feature occlusion, (3) motion/structure recovery ambiguities, (4) mixtures of image sequences having both small and large baselines and (5) mismatched tokens and/or independently moving objects in the observed image frames. Being able to handle these issues is critical for producing practical SfM algorithms. Although recently, elegant methods have been reported in (Soatto and Brockett, 1998; Forsyth et al., 1999), more progress needs to be made in addressing the issues raised above.
ijcv_sis.tex; 15/01/2004; 14:55; p.2
Structure From Motion Using Sequential Monte Carlo Methods
3
In this paper, we focus on developing a robust statistical SfM method using noisy sparse feature correspondences from calibrated video sequences under perspective projection. Since a moving camera can be viewed as a kinematic system with its motion characterized by state parameters, a state space model can be used to describe the camera motion. However, due to perspective projection, the observation equation of the kinematic system is nonlinear. Although nonlinear filtering techniques such as the extended Kalman filter and its variants (Broida et al., 1990; Azarbayejani and Pentland, 1995; Chiuso et al., 2002) have been applied to solve the SfM problem, the results are not satisfactory. Recently, sequential Monte Carlo (SMC) methods have received more attention for estimation, prediction, filtering and smoothing of nonlinear/non-Gaussian state space models. Several SMC methods have been proposed in various scenarios. Isard and Blake developed the CONDENSATION algorithm (Isard and Blake, 1996) for shape and contour tracking. The Monte Carlo filter proposed by Kitagawa (Kitagawa, 1996) can be viewed as a generalized algorithm dealing with the state estimation problem for a nonlinear/non-Gaussian dynamic system. The particle filter (or bootstrap filter) (Gordon et al., 1993) is a variant of the SMC method. In nature, these methods are very similar: samples and weights are propagated from successive time instants to describe distributions of interest. Liu and Chen (Liu and Chen, 1998) proposed a general SMC framework for dynamic systems, the sequential importance sampling and some of the above methods can be interpreted as special cases of the general sequential importance sampling framework. In this paper, we mainly follow the notations and approach of Liu and Chen (Liu and Chen, 1998). In the SfM problem, both camera motion and scene structure are estimated. In our approach, the camera motion is estimated first using an SMC method based on the epipolar constraint, and then the scene structure is recovered using the motion estimates. Recently, the SMC technique was used for the SfM problem (Forsyth et al., 1999) by Forsyth, Ioffe and Haddon. In (Forsyth et al., 1999), the approach followed the spirit of the factorization
ijcv_sis.tex; 15/01/2004; 14:55; p.3
4
Gang Qian and Rama Chellappa
method (Tomasi and Kanade, 1992). It was shown that the SMC method is capable of selecting valid feature points for object shape reconstruction and moving object segmentation. However, since the method is a batch algorithm and a high-dimensional parameter estimation problem is being solved, the procedure is time consuming. Although it is possible to develop a similar algorithm using the perspective projection model, which is more suitable for practical applications, convergence problems and the efficiency of the resulting algorithm may limit its usefulness. In this paper, we develop a recursive algorithm for finding the posterior distribution of the sensor motion parameters using the perspective projection camera model and the sequential importance sampling (SIS) technique (Liu and Chen, 1998). The structure of the scene can be subsequently recovered. When the scene is dynamic, the algorithm can also detect points on the background. By finding the posterior distribution of the motion and scene structure parameters, a much clearer picture of the structure of the solution space can be obtained. Through this, not only can good estimates be found, but the uncertainty of the estimates can also be characterized.
2. Bayesian Motion Estimation
To solve the SfM problem means to find the optimal estimates for camera motion, scene geometry and segmentation which can provide the best interpretation of the observations using criteria such as the maximum a posteriori probability (MAP). In this paper, Prob(parameters —observation), the posterior distribution of the parameters, is approximated using random sampling methods. In this section, we first introduce the SIS technique. We then formulate the SfM problem using a state space model and then develop an SIS algorithm for finding the approximation to the posterior distribution of the state parameters. Before the presentation of algorithms, we would like to clarify some notations. Suppose we have a dynamic system. kk(x) () P
ijcv_sis.tex; 15/01/2004; 14:55; p.4
Structure From Motion Using Sequential Monte Carlo Methods
5
xt , the state parameters of the dynamic system at time t yt , the measurements observed from the system at time t Xt = {xi }ti=1 ,
the state sequence up to time t
Yt = {yi }ti=1 ,
the observation sequence up to time t
Let πt (xi ) = p(xi |Yt ) and πt (Xi ) = p(Xi |Yt ) be the posterior distributions of state at time i and that of the state sequence up to time i given observations up to time t. 2.1. S EQUENTIAL I MPORTANCE S AMPLING The SIS method is a recently proposed technique for approximating the posterior distribution of the state parameters of a dynamic system (Liu and Chen, 1998). Usually, the state space model of a dynamic system is described by observation and state equations. If the measurement is denoted by yt and the state parameter by xt , the observation equation essentially provides the conditional distribution of the observation given the state, ft (yt |xt ). Similarly, the state equation gives the Markov transition distribution from time t to time t + 1, qt (xt+1 |xt ). The goal is to find the posterior distribution of the states (x1 , x2 , · · · , xt ) given all the available observations up to t, πt (Xt ), which can be further decomposed using conditional probability as πt (Xt ) = P ({xi }ti=1 |{yi }ti=1 ) =
t Y
fi (yi |xi )qi (xi |xi−1 )
i=1
and q1 (x1 |x0 ) = π(x0 ) is the prior distribution of the state parameters. One way to represent the approximation of the posterior distribution is by a set of samples and their corresponding weights. Definition (Liu and Chen, 1998) A random variable X drawn from a distribution g is said to be properly weighted by a weighting function w(X) with
ijcv_sis.tex; 15/01/2004; 14:55; p.5
6
Gang Qian and Rama Chellappa
respect to the distribution π if for any integrable function h, Eg h(X)w(X) = Eπ h(X). A set of random draws and weights (x(j) , w(j) ), j = 1, 2, · · ·, is said to be properly weighted with respect to (w.r.t.) π if Pm
lim
m→∞
(j) (j) j=1 h(x )w Pm (j) j=1 w
= Eπ h(X)
(1)
for any integrable function h. (j)
Suppose {Xt }m j=1 is a set of random samples properly weighted by the (j)
set of weights {wt }m j=1 w.r.t. πt and let gt+1 be an arbitrary trial distribution. Then the recursive SIS procedure to obtain the random samples and weights properly weighting πt+1 is as follows. SIS steps: (Liu and Chen, 1998) for j = 1, · · · , m, (j)
(j)
(j)
(A) Draw Xt+1 = xt+1 from gt+1 (xt+1 |Xt ). Attach xt+1 to form (j)
(j)
(j)
Xt+1 = (Xt , xt+1 ). (B) Compute the ”incremental weight” ut+1 by (j) ut+1 (j)
(j)
(j)
=
πt+1 (Xt+1 ) (j)
(j)
πt (Xt )gt+1 (xt+1 |Xt )
(j)
and let wt+1 = ut+1 wt . (j)
(j)
It can be shown (Liu and Chen, 1998) that {Xt+1 , wt+1 }m j=1 is properly weighted w.r.t. πt+1 . Hence, the above SIS steps can be applied recursively to obtain the properly weighted set for future time instants once the corresponding observations are available. It is not difficult to show that given the properly weighted samples {Xt } w.r.t. the joint posterior distribution πt (Xt ), the “marginal” samples formed by the components in {Xt } of xi are properly weighted by the same set of weights respect to the marginal posterior distribution πt (xi ). Once the properly weighted samples of the joint distribution are obtained, the marginal distributions are approximated by the ”marginal” samples weighted by the same set of weights.
ijcv_sis.tex; 15/01/2004; 14:55; p.6
7
Structure From Motion Using Sequential Monte Carlo Methods
The choice of the trial distribution gt+1 is crucial in the SIS procedure since it directly affects the efficiency of the proposed SIS method. In our approach, we used gt+1 (xt+1 |Xt ) = qt+1 (xt+1 |xt )
because of the convenience it provides during the computation and the satisfactory performance the resulting SIS method gives in estimating structure and motion. It can be shown that in this case ut+1 ∝ f (yt+1 |xt+1 ), the conditional probability density function of the observations at t + 1 given the state sample xt+1 . f (yt+1 |xt+1 ) is also known as the likelihood function of xt+1 since the observations are fixed. In SIS, an additional resampling step (Liu and Chen, 1998) often follows the sample weight evaluation after drawing new samples for current state. j N Assume that sample set St = {Xtj }N j=1 is properly weighted by {wt }j=1 .
Resampling includes the following two steps.
Resampling: (Liu and Chen, 1998) (j)
(A) Draw a new sample set St0 from St according to the weights wt . (B) Assign equal weights to all samples in St0 . A major benefit of resampling is to statistically reduce bad samples (with small weights) and encourage good samples so that good samples will produce enough number of offspring to describe the distribution of future states. Since resampling will reduce the size of distinct samples, it might be harmful to do resampling when the variation of sample weights is small, i.e. when the samples are more or less equally weighted (important). Resampling is for a better empirical distribution of future states and it does not improve the estimation of current state since it introduces extra Monte Carlo variations in current samples. It is suggested to perform state estimation before resampling (Liu and Chen, 1998).
ijcv_sis.tex; 15/01/2004; 14:55; p.7
8
Gang Qian and Rama Chellappa
Sample Efficiency SMC are importance sampling based methods. The efficiency of a SMC method can be measured by comparing it with the direct sampling from the target distribution. Quantitatively, it can be represented by the effective sample size (ESS), which is the size of the samples needed to be drawn from the target distribution to have the equivalent estimation accuracy using the SMC algorithm. Fixing the number of samples used in SMC, a large ESS indicates high efficiency. Although ESS depends on the statistics (functions of the states) to be estimated, it can be approximately computed (Kong et al., 1994) from sample weights by ESS =
m 1 + m ∗ var(w)
(2)
where m is the number of samples used in SMC and w are the normalized weights of these samples. Over-resampling could greatly deteriorate the efficiency of a SMC algorithm and result in the sample impoverishment problem, in which case all samples collapse to only a few points in the state space. To avoid over-resampling and sample impoverishment, resampling is not performed in every recursion. Instead, only when the ESS is under certain threshold, resampling will be revoked.
2.2. OVERVIEW OF THE A LGORITHM In the SfM problem, both camera motion and scene structure are estimated. There are two main strategies for doing this (Soatto and Perona, 1998). In one strategy, the camera motion is estimated first using geometric constraints on rigid body motion such as the epipolar constraint, and then the scene structure is recovered using the motion estimates. In the other strategy, structure and motion are estimated simultaneously. The second strategy results in a highdimensional state space (the dimension increases linearly with the number of feature points), which is not favorable to the SIS procedure. In our approach, we use the first strategy: firstly the camera motion is solved and then the scene structure is computed based on motion estimates. The estimation of camera
ijcv_sis.tex; 15/01/2004; 14:55; p.8
Structure From Motion Using Sequential Monte Carlo Methods
9
motion can be once more divided into two steps. The camera motion parameters without translation magnitude is firstly estimated using the well-known epipolar constraint. Then the translation magnitude is computed through triangulation. In the remaining part of the paper, the following notations are used. xt , partial camera motion (without translation magnitude) at time t γt ,
camera translation magnitude at time t
z,
depth values of feature points
yt ,
feature correspondences at time t
Xt = {xi }ti=1 ,
partial camera motion sequence up to time t
Γt = {γi }ti=1 ,
sequence of camera translation magnitude up to time t
Yt = {yi }ti=1 ,
feature trajectories up to time t
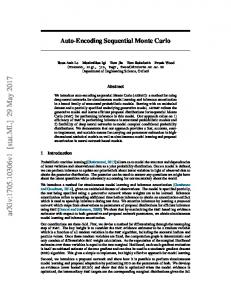
The complete structure and motion estimation algorithm can be illustrated by Figure 1. Three concatenated SIS procedures are involved in the complete algorithm, the first one for partial motion parameters, the second for translation magnitude and the last one for structure parameters. Each SIS procedure uses the results from both the preceding SIS procedure at the same time instant and the same SIS procedure at the previous time instant to update samples and weights. Hence, the complete camera motion and scene structure samples are built up progressively in dimension and recursively in time. Each of these SIS procedures will be discussed in details in the following sections.
2.3. S TATE S PACE M ODEL FOR C AMERA M OTION We first introduce the SIS procedure for partial camera motion parameters, without translation magnitude.
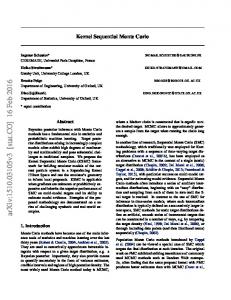
Parameterization of camera motion Before discussing the parameterization of camera motion, we introduce two 3D Euclidean coordinate systems used
ijcv_sis.tex; 15/01/2004; 14:55; p.9
10
Gang Qian and Rama Chellappa
Motion Estimation
Input video Feature Tracker
p( χt-1 |yt-1 )
Delay
p( χt | yt )
yt
Depth Estimation
p( Γt , χt |yt )
p(z,Γt , χt |yt )
Estimation of Translation Magnitude p(z|Γt-1,χt-1, yt-1 )
Delay
Figure 1.
XC ZC
XC
Ψx
YC ZC
Ψz
O
(α,β) O
Ψy YC
Figure 2.
in our research. One coordinate system is attached to the camera and uses the center of projection of the camera as its origin. It is denoted by C. The Z axis of C is along the optical axis of the camera, with the positive half-axis in the camera looking direction. The X-Y plane of C is perpendicular to the Z axis with the X and Y axes parallel to the borders of the image plane. Also, the X-Y -Z axes of C satisfy the right-hand rule. The other coordinate system is a world inertial frame, denoted by I. I is fixed on the ground. The coordinate axes of I are configured in such a way that initially, I and C coincide. When the camera moves, C travels with the camera and I stays at the initial position. It is worthy to mention that in our approach, the camera motion to be estimated is not between two successive time instants, instead, it is the globe overall motion of the camera in the world system I. By computing camera motion in I, the translation can be accumulated over time and the scene structure can be reliably estimated.
ijcv_sis.tex; 15/01/2004; 14:55; p.10
Structure From Motion Using Sequential Monte Carlo Methods
11
The global camera motion can be described by five parameters. mt = (ψx , ψy , ψz , α, β)T (ψx , ψy , ψz ) are the rotation angles of the camera about the coordinate axes of the inertial frame I and (α, β) are the elevation and azimuth angles of the camera translation direction, measured in the world system I. The unit vector in the translation direction is given by T(α, β) = (sin(α) cos(β), sin(α) sin(β), cos(α))T
(3)
In physical world, objects bear inertia during mechanical motion. Inertia resists sudden change of object motion and is proportional to the mass of mov˙ t , the ing objects. To capture the inertia of moving objects, we include m velocity of the above global motion parameter mt in the motion state vector. ˙ T ˙ t = (ψ˙ x , ψ˙ y , ψ˙ z , α, m ˙ β) Hence the state vector we use to represent camera motion is ˙ t) xt = (mt , m
State space model Given the above motion parameterization, a state space model can be used to describe the behavior of a moving camera. ˙ t + nm mt+1 = mt + m
(4)
˙ t+1 = m ˙ t + nm˙ m
(5)
yt = P roj(mt , P) + ny
(6)
˙ t are respectively the motion and moving velocity of the where mt and m camera. yt is the observation at time t, which contains 2D projections of feature points on the image plane at current time instant. nm and nm˙ denote the dynamic noise in the system, describing the time-varying property of camera motion parameters. If no prior knowledge about motion is available, a
ijcv_sis.tex; 15/01/2004; 14:55; p.11
12
Gang Qian and Rama Chellappa
random walk will be a suitable alternative for modeling the dynamic changes in camera motion. P roj(·) denotes the perspective projection function, describing the projection of feature points with structure P in world system I onto the image plane after camera motion mt . It can be interpreted as follows. Suppose the 3D position of a point p in the world system I is P = (X, Y, Z)T . and its 3D position in current camera-centered system C is Pt = (Xt , Yt , Zt )T . Then the projection of p onto the image plane after camera motion mt is Xt Zt Yt v = f Zt
u = f
(7) (8)
where f is the focal length of the camera. If the camera motion parameter at time t is xt = (Ψ, α, β), then Pt = R(Ψ)(P − γT(α, β))
(9)
where camera translation vector T is given by (3) and γ is the translation magnitude. Ψ = (ψx , ψy , ψz ) denotes the camera rotational angles and the rotation matrix R(Ψ) can be computed by
¡
2 n2 1 + 1−n1
¢
η
R(Ψ) =n1 n2 (1−η)−n3 ζ
n1 n2 (1−η)+n3 ζ n1 n3 (1−η)−n2 ζ
¡
¢ 2
n2 2 + 1−n2
η
n1 n3 (1−η)+n2 ζ n2 n3 (1−η)−n1 ζ
where n = (n1 , n2 , n3 )T =
Ψ |Ψ|
n2 n3 (1−η)+n1 ζ
¡
2 n2 3 + 1−n3
¢
(10)
η
is the direction cosine vector, ζ = sin |Ψ|,
and η = cos |Ψ|. 2.4. SIS
FOR
BAYESIAN M OTION E STIMATION
Based on the above state space model, we designed an SIS method for finding an approximation to the posterior distribution of the motion parameters. As mentioned above, the trial distribution in the SIS procedure used in our approach is chosen as gt+1 (xt+1 |Xt ) = qt+1 (xt+1 |xt ). Therefore, during the SIS step (A), we will draw samples from the distribution of xt + nx .
ijcv_sis.tex; 15/01/2004; 14:55; p.12
Structure From Motion Using Sequential Monte Carlo Methods
13
X
(x1 , y1) (u , v) ∆
r1
p
l
Principal point
r2
(x2 , y2)
Y
Image Plane
Figure 3.
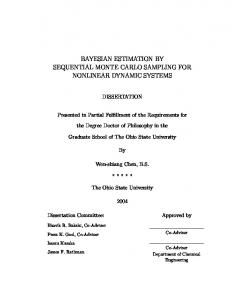
Computation of likelihood function To derive the likelihood function, consider the case when only one point is observed. Assume that at the initial time instant, a point p is projected to (u0 , v0 ) in the first image plane. At time t after camera motion xt , feature tracking results indicate that p is at (ut , vt ) in the image plane at current camera position. Due to the feature tracking noise, (ut , vt ) is a noisy measurement of the true projection of p. Suppose that the distribution of feature # noise is normal with zero mean and " tracking covariance matrix given by
σ2
0
0 σ2
.
When the camera only rotates, the likelihood function can be computed directly as
f ((ut , vt )|xt ) =
1 (ut − u0 (u0 , v0 , Ψt )2 (v − v 0 (u0 , v0 , Ψt ))2 exp −{ + } 2πσ 2 2σ 2 2σ 2 (11)
where (u0 , v 0 ) is the reprojected position of point p in current image plane after camera rotation. It can be computed using (u0 , v0 ) and camera rotation angles Ψt according to (8). In this case, the scene structure P is not involved in the computation of (u0 , v 0 ). When the camera motion includes non-zero translation, the computation of the likelihood f ((ut , vt )|xt ) becomes more difficult. (11) can not be used directly since P will be needed to compute (u0 , v 0 ) when T(α, β) is non-zero. However P is not represented in the state vector. To overcome this difficulty, in our approach, we applied conditional expectation over the structure to
ijcv_sis.tex; 15/01/2004; 14:55; p.13
14
Gang Qian and Rama Chellappa
derive the equation for the likelihood function: f ((ut , vt )|xt ) =
Z Pu
Pl
f (yt |xt , P)p(P)dP
(12)
where [Pl , Pu ] denotes the range of the feature depths such that all the features can be observed at both camera positions with positive feature depth values. However, the computation of the integral in (12) requires knowledge of the prior distributions of the scene structure P and the translation magnitudes, which are unknown. The epipolar constraint (Faugeras, 1993) is used here to resolve this difficulty. Recall that the epipolar constraint says that the perspective projections of a 3D point on the two image planes taken from different viewpoints lie on their corresponding epipolar lines, which are the intersections of the two image planes with the epipolar plane containing the 3D point and the two centers of projection (COP) of the camera. Given the image position of a point in one view and camera motion parameters between the two views, the epipolar line related to this point in the other view can be easily determined. Note that EP {f (yt |xt , P)} = EPt {f (yt |xt , Pt )} where Pt represents the image positions of the feature points at time t. The prior distribution of Pt is not available. We assume that Pt is uniformly distributed on the pixel sites on the corresponding epipolar line segments. Since no prior knowledge about the ratios between feature depth values and camera translation magnitude is given, the whole epipolar line is under consideration. However only the epipolar line segment that agrees with the positive-depth constraint is used to evaluate the above expectation. In this paper, we assume that the feature point positions in the first image frame are exact. Let l denote the epipolar line segment of p at t and let (x1 , y1 ), (x2 , y2 ) be the two terminal points of l. The locations of the two points are easy to find given the camera motion xt and the image position of p in the first frame using the positive-depth constraint. Let pl be the project of p onto l and ∆ be the distance from p to pl . Let r1 and r2 are the distances
ijcv_sis.tex; 15/01/2004; 14:55; p.14
Structure From Motion Using Sequential Monte Carlo Methods
15
from the two terminal points of l to pl . The likelihood function of the motion parameter given a single point observation is f ((u, v)|xt ) =
1 2π(r1 + r2 )σ 2
Z r2 −r1
exp −
r2 + ∆2 dr 2σ 2
(13)
2
=
∆ exp − 2σ r2 r1 2 √ (erf ( √ ) + erf ( √ )) 2 2π(r1 + r2 )σ 2σ 2σ
(14)
Given 2D trajectories of a set of feature points, multiple likelihood functions can be applied in different situations. If all the points are “good” features in the sense that they are not on moving objects nor mismatched, then f (yt |xt ) is obtained by multiplying the individual likelihood functions of the feature points. f (yt |xt ) =
M Y
(i) f (yt |xt )
=
i=1
M Y
(i)
(i)
f ((ut , vt )|xt )
(15)
i=1
where M is the total number of the observed feature points. In some cases, some of the points are known to be not “good” beforehand. If the number of “bad” points is less than half of the total number of tracked feature points, the following equation can be used to compute the likelihood function for the observations: f (yt |xt ) =
Y
(i)
f (yt |xt )
(16)
i∈G
where G = {i :
(i) f (yt |xt )
(i)
≥ median({f (yt |xt )}M i=1 , i = 1, 2, · · · , M }.
The SIS method for Bayesian motion estimation is then as follows. SIS Procedure for Camera Motion Distribution 1. Initialization. Suppose N samples are used to describe the motion distri(j)
(j)
(j)
˙ 0 }N bution. Draw motion samples {x0 }N j=1 = {m0 , m j=1 from π(x0 ), which is the initial distribution of the motion parameters before the camera moves. Note that before camera begins moving, x0 6= 0. Although the rotation angle Ψ and the translational vector are zero, the translational direction angles are uniformly distributed in their ranges. For each initial motion sample, the components of the rotation angles are all set to zero and the samples of α and β are drawn from two uniform distributions over [0, π] and [0, 2π], respectively.
ijcv_sis.tex; 15/01/2004; 14:55; p.15
16
Gang Qian and Rama Chellappa
Since video sequences are used as image sources other than sets of image frames in arbitrary orders, the changes of the motion parameters usually are small. Assume that the rotational angular velocity obeys normal distribution and the translational direction angle velocity, a uniform distribution. For simplicity, dynamic noises in camera motion velocities are sampled from the following distributions. n
ψ˙ι
∼ N (0, σι ), ι ∈ {x, y, z}
n ∼ U (−δ , δ ), κ ∈ {α, β} κ˙ κ κ
(17)
where σι ,δα and δβ are small positive real values. Since all the motion samples are drawn from a nearly exact distribution, equal weights are assigned to these samples. To cover the case of pure rotation, some samples are treated as pure rotation samples according to probability Ppr , which can be set based on the prior knowledge of the camera motion. If Ppr is not available, 0.5 could be a good guess. when t > 1, the weights of pure rotation samples are computed using the likelihood function for pure rotation given by (11). For t = 1, · · · , τ : 2. Sample generation. Draw new samples for current time instant based on (j)
samples from previous time instant. Samples {xt }N j=1 are drawn based on the camera motion dynamics specified by (5) and (6). Hence for the (j)
jth sample xt
(j)
(j)
˙ t ), = (mt , m (j)
mt
(j)
(j)
˙ t−1 + nm = mt−1 + m
˙ (j) ˙ (j) m = m ˙ t t−1 + nm
(18) (19)
nm and nm˙ are sampled from similar distributions as in (17), but with different values of variances. Usually, the dynamic noise variances in nm are smaller that those in nm˙ since most of the changes in mt have been ˙ t−1 . taken care of by the prediction through m 3. Sample transfer The status of camera motion in the sense of pure rotation can change from one time instant to the next time instant. Some
ijcv_sis.tex; 15/01/2004; 14:55; p.16
Structure From Motion Using Sequential Monte Carlo Methods
17
samples in the two groups are exchanged to accommodate the shift in motion between pure rotation and general motion. If no information about the change of camera motion is given, half samples of pure rotation and (j)
general motion are exchanged. Let {wpr } be the weights corresponding (j)
to pure rotation samples computed using (11) and {wg } the weights of general motion samples. The posterior probability that the sequence is pure rotation can be inferred using these two weight sets by P
P (pure rotation) =
(j) j wpr P (j) P j wpr + j
(20)
(j)
wg
4. Weight computation and re-sampling. (j)
− Compute the sample weights {wt }. For samples in the pure rotation group, the likelihood of a single feature point is computed using the function for pure rotation camera motion (11). Otherwise, the likelihood function for general camera motion (14) is used. If all feature points are good features without any mismatches, the product of the likelihood of all points is used as the weight for a motion sample as shown in (15). However, if some of the feature points are bad, (16) is used to compute the weight of a motion sample where only the likelihood of good feature points are used. The resulting (j)
(j)
samples and their corresponding weights (Xt , wt ) are properly weighted w.r.t. πt (Xt ). − Compute the current ESS using (2). When the ESS is lower than a threshold, (m/3 in our implementation), resample the above samples to amplify important motion samples so that good samples could be found for the motion parameters for the next time instant. By using these properly weighted sample-weight sets for each time instant, the mean of the motion parameters can be computed directly. Also since the sample-weight sequences after re-sampling approximates Xt in distribution, the MAP estimates of Xt can also be obtained by locating the modes of πt (Xt ).
ijcv_sis.tex; 15/01/2004; 14:55; p.17
18
Gang Qian and Rama Chellappa
2.5. DYNAMIC S CENES So far, we have discussed camera motion estimation for cases where the sets of features being tracked are good (static scene no mismatched feature points) and the number of bad feature points is less than the number of good ones. However, in real applications, the number of bad feature points is often larger than the number of points on the background. For example, multiple moving objects with different motion trajectories might be present in the scene and the features on these objects might be the majority of the tracked feature points. Therefore, the method proposed in the last section for dealing with mismatched feature points will not work well in this case. A new algorithm to simultaneously select good feature points and produce Bayesian camera motion estimates is required. This algorithm is now described.
Validity vector The state vector to be estimated is extended by adding a so-called validity vector v: ˙ t) xt = (vt , mt , m
(21)
˙ t represent the motion parameters. vt is a M × 1 vector. where mt and m (Recall that M is the number of feature points). Each entry of vt is associated with a feature point and indicates the possibility that the point is not mismatched and belongs to the background.
Trial function For the motion parameters mt , the trial function in the random sampling step in the SIS procedure remains the same. The trial function for the validity vector v, g(vt+1 |vt ), is similarly chosen as g(vt+1 |vt ) = πt (vt+1 |vt ) = P r(vt+1 |vt , Yt )
(22)
and the samples at t + 1 are drawn using vt+1 = γvt + ξ(mt , yt ) + nv
(23)
ijcv_sis.tex; 15/01/2004; 14:55; p.18
Structure From Motion Using Sequential Monte Carlo Methods
19
where nv is the noise in the validity vector and γ is an exponential forgetting factor, close to one. Equation (23) can be viewed as a definition for the conditional probability of vt+1 given vt . Both of them represent the possible time-varying nature of the validity vector: ξ(·) is a function used to update the current validity vector. Each element of ξ is given by ξi (mt , yt ) = (
eth 2 ei + 1 ) − sign(bei /eth c) ei + 1 eth
(24)
(i)
where ei = e(mt , yt ) is the distance from the ith feature point to its associated epipolar line given the motion parameters mt . eth is a prechosen threshold for this distance. When ei is larger than eth , ξi (·) is negative so (i)
that the corresponding value of vt is decreased. On the other hand, if ei is (i)
smaller than eth , ξi (·) produces a positive value and vt is increased. Therefore, during the recursion, in the validity vector, the components related to the feature points whose 2D motion trajectories can be well explained by the motion samples (with low epipolar distances) will have high positive values. For mismatched features or features on moving objects, since their motion trajectories can not be interpreted by resulting motion samples, their related components in v will have low negative values. Hence, the validity vector samples can be used to segment out features on the background.
Likelihood function In this case, the likelihood function of the observation given the state parameter is obtained as f (yt |xt ) ∝ I{P
x(i) |x(i)|
(v+ ) ≤7} t
M X
vt+ (i) exp {
i=1
−² } σu2 + σv2
(25)
I{fb (x)} (x) is an indicator function. fb (x) is a boolean function of x. If fb (x) is true, I{fb (x)} (x) returns one, otherwise zero. vt+ carries the positive components of νt , given by v (i), if v (i) > 0 t t vt+ (i) = 0, otherwise
(26)
ijcv_sis.tex; 15/01/2004; 14:55; p.19
20
Gang Qian and Rama Chellappa
Since at least seven feature points are required to uniquely determined camera motion, samples which have less then seven positive entries in the validity vectors are considered bad motion samples and eliminated from the SIS procedure. ² can be viewed as a weighted average of the squared epipolar distances of the features with positive entries in the validity vector. It is given by
PM
²=
2 + i=1 et (i) vt (i) PM + i=1 vt (i)
(27)
Based on the above discussion, the SIS method in the last section can be modified here by retaining the sampling step for the motion parameters, adding the sampling step for the validity vector according to (23), and computing the weights using (25). During the recursion, vt will evolve to a structure such that the entries corresponding to the background have similar large positive values while the other entries corresponding to the mismatched feature points or those on moving objects have small or negative values. Once the validity vector for the feature points is obtained, clustering methods such as the k-means algorithm can be applied to split the features into features on the background and features that belong to moving objects.
Relation to the EM algorithm The Expectation-Maximization algorithm (EM) (Hartley, 1958; Dempster et al., 1977) is a practical method for find the maxima of the likelihood of the state parameters of a system when some system parameters are unknown or only partial measurements are observed. The EM algorithm has been used to tackle the SfM problem without correspondences (Dellaert et al., 2000). It is also very possible that it can be used for camera motion estimation in the presence of independently moving objects. Actually, the SIS procedure we have presented here is very close to the EM algorithm in spirit. To solve the camera motion with moving objects, there are two tasks to be accomplished. The first one is to find the feature points on the background; the second one is to find the camera motion relative to the background. If the EM algorithm is used, the basic estimation scheme could be as follows. Start-
ijcv_sis.tex; 15/01/2004; 14:55; p.20
Structure From Motion Using Sequential Monte Carlo Methods
21
ing from an initial guess of the feature set on the background, at the M-step, estimate the motion parameters using current feature set assumed to be on the background. Then, at the E-step, using the newly obtained motion estimates, the probabilities of possible feature sets are evaluated. Large feature set with small residuals will have high probability. The expectation of the likelihood of the motion parameters is computed over all possible feature sets on the background. This expected value is then maximized over motion parameters based on current feature point assignment. The EM iteration is repeated. In our approach, the motion estimation using samples and weights computed from (25) can be viewed as the M-step but with many motion samples. and the update of the validity vector using (23) is similar to the E-step, with the assignment of the feature points are represented by the samples of the validity vectors. Our method using SIS can be viewed as a recursive version of the EM algorithm with only one step of iteration at one recursion.
3. Estimation of Translation Magnitude and Scene Structure
Recall that in the previous section, we selected the SfM computational scheme where the camera motion is estimated at first and then the structure parameters are recovered. Therefore, only rotation and translation direction angles are used to describe the camera motion and the translation size is not represented. In many practical applications, not only is one interested in the direction of translation, but also its magnitude. Remember that the translation is measured in the world coordinate system I. To be consistent, the structure parameters are also defined in system I, which is, in our configuration, identical to the camera-centered system before the movement of camera. In this paper only monocular image sequences are used as observations. It is well known that in this case the translation size and feature points’ depths can only be recovered up to a global scale factor, i.e. only their relative sizes can be estimated. Usually, one of the length quantity such as the depth values
ijcv_sis.tex; 15/01/2004; 14:55; p.21
22
Gang Qian and Rama Chellappa
is chosen as the length basis. This length quantity is called the normalization basis with normalized length 1. Translation magnitude and depth values are normalized with respect to the normalization basis. In our approach, we select the depth of the last feature point, zM , as the normalization basis for translation magnitude and the depths of other feature points. In this section, we show that the posterior distribution of translation sizes and the depths of the feature points can be approximated by a set of samples that are properly weighted by their weights w.r.t. the target distributions.
3.1. E STIMATION OF T RANSLATION M AGNITUDE Denote the translation magnitude at time t by γt . Let the sequence of the translation magnitude up to current time t be Γt = {γτ }tτ =1 . Recall that by using the SIS procedure for camera motion estimation described in the last section, p(Xt |Yt ) can be described by properly weighted samples. In this section, we would like to find samples and weights describing the joint distribution p(Γt , Xt |Yt ). We have the following theorem. Theorem 1. Let r and s be two random variables with joint distribution p(r, s). Assume that {s(i) }m i=1 are properly weighted by normalized weights (i)
{ws }m i=1 w.r.t. the marginal distribution p(s) with m À 1. (”Normalized weights” means that the summation of the weights is 1.) For each sample (j)
of s, say, s(i) , assume that {ri }nj=1 are properly weighted by normalized (j)
weights {wi }nj=1 w.r.t. the conditional distribution p(r|s(i) ) with n À 1. (j)
Then the combined samples {{ri , s(i) }nj=1 }m i=1 are properly weighted by (j)
(i)
{{wi ws }nj=1 }m i=1 w.r.t. the joint distribution p(r, s). Proof. Let h(r, s) be an integrable function of r and s. Z
Eh(r, s) =
h(r, s)p(r, s)drds
(28)
Z Z
=
s r
h(r, s)p(r|s)drp(s)ds
(29)
ijcv_sis.tex; 15/01/2004; 14:55; p.22
23
Structure From Motion Using Sequential Monte Carlo Methods
Since {s(i) }m i=1 are properly weighted samples w.r.t. p(s), (29) can be written as Eh(r, s) = lim
m Z X
m→∞
i=1 r
h(r, s(i) )p(r|s(i) )drws(i)
(30)
which can be approximated using sample-weight pairs properly weighted w.r.t. p(r|s(i) ) for i = 1, ..., m as Eh(r, s) = lim
m→∞
= lim
m→∞
m X
ws(i) lim
n→∞
i=1 m X i=1
n X
lim
n→∞
n X
(j)
(j)
h(ri , s(i) )wi
(31)
j=1 (j)
(j)
h(ri , s(i) )wi ws(i)
(32)
j=1
(j)
Therefore, the combined samples {{ri , s(i) }nj=1 }m i=1 are properly weighted (j)
(i)
by their respective weights {{wi ws }nj=1 }m i=1 w.r.t. the joint distribution p(r, s). The joint posterior distribution of Γt and Xt can be written as p(Γt , Xt |Yt ) = p(Γt |Xt , Yt )p(Xt |Yt ) Samples and weights that describe p(Xt |Yt ) can be computed easily using (j)
the SIS motion algorithm we proposed. If for each of the sample, say, Xt , we can find samples of translation magnitude properly weighted w.r.t. the (j)
conditional distribution p(Γt |Xt , Yt ), then the samples and weights w.r.t. their joint distribution can be formed using these two categories of sampleweight pairs based on Theorem 1. The samples of p(Xt |Yt ) are obtained (j)
recursively during the SIS procedure. Basically, new sample stream Xt formed by attaching the newly drawn sample i.e.
(j) Xt
=
(j) (j) (Xt−1 , xt ).
(j) xt
to the old stream
are
(j) Xt−1 ,
The weights are also updated accordingly. There-
fore, we desire to have a recursive sampling scheme for the complete motion distribution p(Γt , Xt |Yt ). It is easy to show that p(Γt |Xt , Yt ) = p(Γt−1 |Xt−1 , Yt−1 )p(γt |γt−1 )
p(yt |γt , xt ) p(yt |xt )
(33)
which indicates that we can recursively get samples of p(Γt |Xt , Yt ). The proof can be found in the Appendix. The following proposition shows that the above conditional distribution can be simplified.
ijcv_sis.tex; 15/01/2004; 14:55; p.23
24
Gang Qian and Rama Chellappa
Proposition 1. Assume that M feature points are tracked through an image sequence. Without loss of generality, the depth of the feature point, zM , is selected as the normalization basis for translation magnitude and structure parameters. Let Yt be its 2D trajectories in the image plane up to t. Then the conditional distribution p(Γt |Xt , Yt ) is completely determined only by Yt , namely, p(Γt |Xt , Yt ) = p(Γt |Xt , Yt )
(34)
Proof. Let z and ˜z be feature depth vector and the normalized depth, respectively. Since zM is the normalization basis, we have ˜z =
z zM
Let γt be the normalized translation magnitude at time t. The representation of depths of the first M − 1 points can be reparameterized using γt . Denote the relative depth by λt . Let’s call λt the translation-normalized depth vector. λt =
˜zC γt
(35)
where ˜zC is the truncated depth vector, containing the normalized depth values of the first M − 1 points. Although ˜zC could be fixed when the scene is rigid, usually λt is time-varying since γt changes. Let Λt be the sequence of the translation-normalized depth vector up to t, i.e. Λt = {λτ }tτ =1 . Denote the complementary set of Yt by YtC such that (YtC , Yt ) = Yt . The original conditional distribution can be written as Z
p(Γt |Xt , Yt ) = Z
=
Λt
Λt
p(Γt , Λt |Xt , YtC , Yt )dΛt p(YtC |Xt , Γt , Λt )p(Γt |Yt , Xt )p(Λt |Xt )p(Yt , Xt ) dΛt p(YtC |Yt , Xt )p(Yt , Xt )
Since Λt is translation-normalized, we have p(YtC |Xt , Γt , Λt ) = p(YtC |Xt , Λt ). Hence Z
p(Γt |Xt , Yt ) =
Λt
p(YtC |Xt , Λt )p(Γt |Yt , Xt )p(Λt |Xt ) dΛt p(YtC |Xt )
ijcv_sis.tex; 15/01/2004; 14:55; p.24
Structure From Motion Using Sequential Monte Carlo Methods
Z
= p(Γt |Yt , Xt )
Λt
25
p(YtC , Λt |Xt ) dΛt p(YtC |Xt )
= p(Γt |Yt , Xt )
The related recursion formula for the simplified conditional distribution is p(Γt |Xt , Yt ) = p(Γt−1 |Xt−1 , Yt−1 )p(γt |γt−1 )
p(yt |γt , xt ) p(yt |xt )
(36)
where yt is the image plane position of the last feature point at time t. Based on the above discussion, we present the following SIS procedure for finding an approximation to the joint distribution p(Γt , Xt |Yt ). SIS Procedure for Joint Motion Distribution 1. Initialization. At t = 1, − Motion sample acquisition. Compute the properly weighted sam(j)
(j)
m ples {x1 }m j=1 and their normalized weights {wx,1 }j=1 w.r.t. p(x1 |Y1 )
using the SIS procedure for camera motion distribution developed (j)
(j)
in the last section. Let X1 = {x1 } and Wx,1 = {wx,1 }. − Samples of translation magnitude. For each motion sample x(j) , j = 1, ..., m • Compute γ ∗(j) using x(j) as γ ∗(j) = arg max p(y1 |γ, x(j) )p(γ) γ
(37)
Assume that the magnitude of the translation can be uniformly distributed in the domain of positive real numbers. (k)
• Draw a set of samples {γj } around γ ∗(j) from a trial distribution g(γ|γ ∗(j) ) = N (γ ∗(j) , Σγ )
(38)
This trial distribution can also be of other forms.
ijcv_sis.tex; 15/01/2004; 14:55; p.25
26
Gang Qian and Rama Chellappa (k)
(k)
• Evaluate weights for samples {γj }. Let wj
be the weight of
(k) γj . (k)
(k) wj
∝
(k)
p(y1 |γj , x(j) )p(γj )
(39)
(k)
g(γj |γ ∗(j) )p(y1 |x(j) )
• Normalize the weights by (k)
(k) w ˜j
wj
=P
(40)
(k)
k
wj
(j)
(k
(j)
• Combine samples and weights. Υ1 = {γj , x(j) }nk=1 and Wγ,1 = (k)
(j)
(j)
(j)
{w ˜j wx,1 }nk=1 . Υ1 and Wγ,1 are properly weighted w.r.t. the (j)
conditional distribution p(Γ1 |X1 , Y1 ). − Samples and weights collection. According to Theorem 1, the col(j)
lection of the above combined samples, which is {Υ1 }m j=1 is prop(j)
erly weighted by the collection of the related weights {Wγ,1 }m j=1 w.r.t. the joint distribution p(Γ1 , X1 |Y1 ). For time instant t > 1 2. Motion sample acquisition. Based on the motion sequence samples up (j)
(j)
m to previous time, {Xt−1 }m j=1 and {wx,t−1 }j=1 , properly weighted sam(j)
(j)
m ples {Xt }m j=1 and their normalized weights {wx,t }j=1 w.r.t. p(Xt |Yt )
can be obtained using the SIS procedure for motion distribution. A mo(j)
tion sequence sample up to current time, Xt
is formed by adding mo(j)
tion sample of current time to the old motion sequence sample, Xt
=
(j) (j) (Xt−1 , xt ).
For each motion sequence sample X (j) , j = 1, ..., m 3. Translation magnitude sample generation. (j)
− Obtain samples of Γt−1 by resampling Υt−1 according to their weights (j)
(k)
Wγ,1 . Denote the newly drawn samples by {Γt−1,j }. − Predict translation magnitude of current time by sampling from the (k)
(k)
Markovian transition probability p(γt |γt−1 ). Let γt,j = |γt−1,j +
ijcv_sis.tex; 15/01/2004; 14:55; p.26
27
Structure From Motion Using Sequential Monte Carlo Methods
nγ | with nγ a Gaussian variable with zero mean and variance σγ . (k)
(k)
(k)
(k)
Attach it to Γt−1,j to form Γt,j = (Γt−1,j , γt,j ). (k)
− For each translation magnitude sample γt , compute its corresponding weight. (k) wj (j)
(j)
=
(k)
p(yt |xt , γt )
(41)
(j)
p(yt |xt )
(k)
(j)
where the p(yt |xt , γt ) and p(yt |xt ) can be easily computed using likelihood functions (11) and (14). Note that the depth of the feature point in current measurements, (the trajectories of the last feature point) is 1. − Normalize the weights by (k)
(k)
w ˜j
wj = P (k) k wj (j)
− Combine samples and weights. Υt (k)
(j)
(j)
(42) (k
(j)
(j)
= {Γt,j , Xt }nk=1 and Wγ,t =
(j)
{w ˜j ·wx,t }nk=1 . Υt and Wγ,t are properly weighted w.r.t. the con(j)
ditional distribution p(Γt |Xt , Yt ). From Proposition 1, these sam(j)
ples and weights are also properly weighted w.r.t. p(Γt |Xt , Yt ). − According to Theorem 1, the collection of the above combined (j)
samples, which is {Υt }m j=1 is properly weighted by the collec(j)
tion of the related weights {Wγ,t }m j=1 w.r.t. the joint distribution p(Γt , Xt |Yt ). When data of next time instant is available, go to step 2. By using the above SIS procedure, the joint camera motion distribution p(Γt , Xt |Yt ) can be approximated using weighted samples. 3.2. D EPTH E STIMATION Assuming the scene is static, the 3D positions of the feature points in the world system I are constant. We denote z by the constant depth values of
ijcv_sis.tex; 15/01/2004; 14:55; p.27
28
Gang Qian and Rama Chellappa
the feature points. Using the joint camera motion parameters, the conditional distribution of the feature depth values can be obtained. Then, Theorem 1 can be used to obtain joint structure and motion samples. The following theorem states the recursive relationship of the conditional depth distribution given joint motion parameters. Theorem 2. Given the joint camera motion distribution, the recursion equation for the conditional depth distribution of a set of static 3D points is as follows. p(z|Γt , Xt , Yt ) = p(z|Γt−1 , Xt−1 , Yt−1 )
p(yt |γt , xt , z) p(yt |γt , xt )
Proof. p(Γt , Xt , Yt , z) p(Γt , Xt , Yt ) p(yt |γt , xt , z)p(γt |γt−1 )p(xt |xt−1 )p(z, Γt−1 , Xt−1 , Yt−1 ) = p(yt |γt , xt )p(γt |γt−1 )p(xt |xt−1 )p(Γt−1 , Xt−1 , Yt−1 ) p(yt |γt , xt , z)p(z, Γt−1 , Xt−1 , Yt−1 ) = p(yt |γt , xt )p(Γt−1 , Xt−1 , Yt−1 ) p(yt |γt , xt , z) = p(z|Γt−1 , Xt−1 , Yt−1 ) p(yt |γt , xt )
p(z|Γt , Xt , Yt ) =
Using the joint motion distribution, which can be obtained using the SIS procedure discussed in the previous section, both the joint structure/motion p(z, Γt , Xt |Yt ) and marginal depth p(z|Yt ) distributions are easy to compute. p(z, Γt , Xt |Yt ) = p(z|Γt , Xt , Yt )p(Γt , Xt |Yt ) p(z|Yt ) = EΓt ,Xt {p(z, Γt , Xt )|Yt } Z
=
Γt ,Xt
p(z, Γt , Xt |Yt )dΓt dXt
(43) (44) (45)
Moreover, the recursion form of the marginal depth distribution can be easily derived. p(z|Yt ) =
p(Yt−1 ) p(z|Yt−1 ) p(Yt )
Z γt ,xt
p(yt |γt , xt , z)p(γt |γt−1 )p(xt |xt−1 )dγt dxt (46)
ijcv_sis.tex; 15/01/2004; 14:55; p.28
Structure From Motion Using Sequential Monte Carlo Methods
29
It is not difficult to prove using Theorem 1 and equation (33). The proof can be found in the Appendix. However, this recursion form does not explicitly utilize the motion estimate and hence will result large uncertainties and divergence in depth estimation. Therefore, in our approach, we use the recursion equation of depth distribution given by Theorem 2 and straightforwardly obtain samples and weights properly weighted w.r.t. p(z|Γt , Xt , Yt ), based on depth samples w.r.t. the previous conditional distribution p(z|Γt−1 , Xt−1 , Yt−1 ). Furthermore, the samples w.r.t. the joint structure/motion distribution can be formed using Theorem 1. The depth distribution p(z|Yt ) is therefore easily obtained by marginalization of the joint structure/motion distribution. Based on the above discussion, we have the following SIS procedure for recursively estimating the posterior distribution of depth. SIS Procedure for Joint Motion/Structure Distribution 1. Initialization. At t = 1, − Obtain samples and weights w.r.t. p(γ1 , x1 |Y1 ). Compute the prop(j)
(j)
erly weighted samples {γ1 , x1 } and their normalized weights (j)
{wm } w.r.t. p(γ1 , x1 |Y1 ) using the SIS procedure for joint camera motion distribution developed in the previous section. − Obtain samples and weights w.r.t. p(z|γ1 , x1 , Y1 ). (j)
(j)
• For each motion samples {γ1 , x1 }, compute z∗(j) , the maximum likelihood depth (MLD), as follows. z∗(j) = arg max p(yt |z, γ (j) , x(j) )π(z) z
(47)
(j)
• Draw a set of samples Z1 = {z(j,k) } around z∗(j) from a trial distribution g(z|z∗(j) ) = N (z∗(j) , Σ)
(48)
This trial distribution can also be of other forms.
ijcv_sis.tex; 15/01/2004; 14:55; p.29
30
Gang Qian and Rama Chellappa (j)
• Evaluate weights for samples in Z1 . Let w(j,k) be the weight of z(j,k) . (j)
w
(j,k)
(j)
p(yt |z(j,k) , γ1 , x1 )π(z(j,k) ) ∝ g(z(j,k) |z∗(j) )
(49)
• Normalize the weights by w(j,k) w ˜ (j,k) = P (j,k) kw (j)
Let W1 (j)
(50)
= {w ˜ (j,k) }k . According to Proposition 2 in Appendix,
(j)
(j)
(j)
(Z1 , W1 ) are properly weighted w.r.t to p(z|γ1 , x1 , Y1 ) − Joint motion and depth samples can then be easily obtained by properly combination of joint motion and conditional depth samples, using Theorem 1. Therefore, the joint motion samples, conditional depth samples and joint motion/depth samples are all ready for the initial time instant. For time instant t > 1 2. Motion sample acquisition. Compute the properly weighted samples (j)
(j)
(j)
m {Γt , Xt }m j=1 and their normalized weights {wm }j=1 w.r.t. p(Γ, Xt |Yt )
using the SIS procedure for joint motion distribution. 3. Depth sample and weight update (j)
(j)
− Depth resampling. For each motion samples {Γt , Xt }, resam(j)
(j)
(j)
pling the previous depth sample set Zt−1 , w.r.t. p(z|Γt−1 , Xt−1 , Yt−1 ), according to their weights Wt−1 . Denote the newly drawn samples (j)
by Zt . (k)
− Weight update. For each depth sample zt
(j)
in Zt , compute its
corresponding weight using current motion samples. (j)
(j)
w(j,k) = p(yt |γt , xt , z(k) ) (j)
Let Wt
(j)
by Wt
(j)
be {w(j,k) }k . Depth sample set Zt
(51)
is properly weighted
w.r.t. p(z|Γt , Xt , Yt ).
ijcv_sis.tex; 15/01/2004; 14:55; p.30
Structure From Motion Using Sequential Monte Carlo Methods
31
Using Theorem 1, the joint motion and depth samples can then be easily obtained. When data of next time instant is available, go to step 2. In the above SIS procedure, the depth distribution of individual feature point can be computed in parallel because the depth values of different feature points are statistically independent. The complete structure and motion estimation algorithm can be illustrated by Figure 1. After the discussion of three SIS procedures for partial camera motion, translation magnitude and scene structure, we can see that the complete camera motion and scene structure estimates from a video sequence are obtained progressively in dimension and recursively in time.
4. Experimental Results and Performance Analysis By using the above SIS methods, challenging issues in SfM problem such as occlusion, SfM ambiguity, mixed-domain sequence processing, and mismatched feature points can be elegantly handled. 4.1.. A C ASE S TUDY We first show some results using synthetic sequences. In the first example, a sequence with 13 feature points was generated. The size of the images in pixels is 512 × 512 and the field of view is 0.9237 radian. The baseline of the camera motion is not large. The translation magnitude ranges from 1 to 35 percents of the closed feature depth. The feature trajectories were corrupted by additive white Gaussian noise (AWGN) with standard deviation (STD) 0.5 pixel. During the camera motion computation, 5000 samples were used in the SIS procedure. The resultant marginalized motion distributions are shown in Figure 4. The ground truths of camera motion are indicated by thick solid lines. In Figure 4, (a,b,c) in the first row are the respective distributions of rotational angles ψx , ψy and ψz . The first two figures in the
ijcv_sis.tex; 15/01/2004; 14:55; p.31
32
Gang Qian and Rama Chellappa 5 z
DISTRIBUTION OF ψ
DISTRIBUTION OF ψ
DISTRIBUTION OF ψ
y
5
x
5 10
10
15
10
15
20
15
20
25
20
25
30
25
30
35
30
35 −2 0 2 ROTATION ABOUT THE X AXIS
(a)
−2 0 2 ROTATION ABOUT THE Z AXIS
(b)
(c)
EFFECTIVE SAMPLE SIZE
5
200
DISTRIBUTION OF β
DISTRIBUTION OF α
5 10
10
15
150
15
20
20
25
100
25
30
30
35 0
35 −2 0 2 ROTATION ABOUT THE Y AXIS
35 1 2 ELEVATION ANGLE
3
−2
(d)
0 AZIMUTH ANGLE
50 0
2
(e)
10
20 30 FRAME NUMBER
(f)
TRANSLATION MAGNITUDE
Figure 4. GROUND−TRUTH ESTIMATE
NORMALIZED DEPTH
0.5 0.4
2
1.5
0.3 0.2
0.5
0.1 0
1
10
20 30 FRAME NUMBER
(a)
0 0
5 10 FEATURE POINT INDEX
(b)
Figure 5.
second row show the distributions of translation direction angles α and β. In each figure, the distribution of the corresponding motion parameter at each time instant is shown from the top of the figure to the bottom with Y being the time instant and X being the value of each motion parameter. (ψx , ψy , ψz ) are in the range [−π, π]. α is in [0, π] and β in [0, 2π]. All the other motion distribution results in this paper can be interpreted in the same way. We see that the distributions of motion parameters have peaks very close to the ground truths. Figure 4(f) presents the effective sample sizes of the SIS procedure for motion distribution over the entire sequence. ESS at each time instant is computed using (2) from related sample weights. Figure 5 (a) shows the empirical mean and variance of translation magnitude at different time instant throughout the sequence. The ground-truth is shown by the dotted
ijcv_sis.tex; 15/01/2004; 14:55; p.32
33
Structure From Motion Using Sequential Monte Carlo Methods
1.5
1
0.5 0
20 30 FRAME NUMBER
10
(a)
DEPTH ESTIMATE
DEPTH ESTIMATE
DEPTH ESTIMATE
0
20 30 FRAME NUMBER
10
20 30 FRAME NUMBER
(i)
1
0
0
20 30 FRAME NUMBER
20 30 FRAME NUMBER
(j)
1
0
20 30 FRAME NUMBER
(h)
1.5
0.5
10
10
2
1.5
0.5
10
10
2
DEPTH ESTIMATE
DEPTH ESTIMATE
DEPTH ESTIMATE
1
1
(g)
2 1.5
0.5
(d)
0.5
(f)
2 1.5
0
0
20 30 FRAME NUMBER
20 30 FRAME NUMBER
1.5
1
0.5
(e)
10
2
1.5
1
0.5
10
0
20 30 FRAME NUMBER
2
1.5
0.5
10
(c)
2
1
0
0
20 30 FRAME NUMBER
1
0.5
(b)
2 1.5
1
0.5
DEPTH ESTIMATE
10
1.5
DEPTH ESTIMATE
1
2
DEPTH ESTIMATE
1.5
0.5 0
2
DEPTH ESTIMATE
2
DEPTH ESTIMATE
DEPTH ESTIMATE
2 1.5
1
0.5
10
20 30 FRAME NUMBER
(k)
0
10
20 30 FRAME NUMBER
(l)
Figure 6.
line. Figure 5 (b) shows the empirical mean of the depth distribution. The ground-truth of feature depth is marked by circles. Since we developed two SIS procedures for depth estimation with and without using scene rigidity constraint, two set of samples were obtained and their empirical mean are shown here. Estimates with and without scene rigidity constraint are marked by diamonds and squares, respectively. Since both estimates are very close to the ground truth, it is difficult to distinguish one from the other. Figure 6 shows the means and variances of depth distribution using the SIS procedure for static scenes. We see that in the beginning the estimates are not accurate and the variances are large, but as the translation magnitude accumulates, the depth estimates converge to the ground-truth and the variances also reduce. 4.2.. F EATURE O CCLUSION During the tracking of feature points through a video sequence, some of the feature points may be occluded by objects over in some frames. The occluded feature points are unobservable during that period of time, but they may
ijcv_sis.tex; 15/01/2004; 14:55; p.33
34
Gang Qian and Rama Chellappa
become visible in subsequent frames. In Tomasi and Kanade’s factorization method (Tomasi and Kanade, 1992), the image positions of the occluded feature points are interpolated from their past and future positions. In our approach, feature occlusion does not affect the basic theory of our algorithm. At each time instant, the occluded feature points are ignored when the weights are computed and only visible feature points are used as observations. The reduction in the number of observed feature points may make the motion estimation less accurate in the sense that the resulting posterior distribution has a larger variance than when more observations are used.
4.3.. M OTION AND S TRUCTURE A MBIGUITIES The ambiguities in motion and structure recovery have been noticed to be inherent (Adiv, 1989; Young and Chellappa, 1992). Although the ambiguities can be reduced by using rate data obtained from inertial sensors (Qian et al., 2001), inertial sensors are not widely applied yet and not many sequences were captured using cameras with inertial sensors. One dominant ambiguity arises from the similarity between the feature trajectories generated by translation parallel to the image plane and out-plane rotation (Daniilidis and Nagel, 1993) when the size of the field of view is small. It is usually referred as translation-rotation confusion. Given feature correspondences tracked through an image sequence, two questions need to be answered. The first one is whether SfM ambiguities exist for this sequence. The second one is: if it exists, what are the admissible solutions? Using our SISbased approach, both questions can be answered by looking at samples and weights describing the posterior distribution of the motion parameters. For feature trajectories obtained from an ambiguous image sequence, multiple modes can be found in distributions represented by the samples and weights. This answers the first question. Admissible solutions can be found by locating the modes of the distributions. in the solution space. The results shown in Figure 7 are obtained using an ambiguous sequence. During the generation
ijcv_sis.tex; 15/01/2004; 14:55; p.34
35
z
10
15
10
15
20
15
20
25
20
25
25
30
−2 0 2 ROTATION ABOUT THE X AXIS
30
−2 0 2 ROTATION ABOUT THE Y AXIS
(a)
(b)
(c)
EFFECTIVE SAMPLE SIZE
DISTRIBUTION OF β
60
10
15
50 40
15
20
30
20
25
20
25
1 2 ELEVATION ANGLE
3
(d)
−2 0 2 ROTATION ABOUT THE Z AXIS
70
5
DISTRIBUTION OF α
5 10
30 0
5
DISTRIBUTION OF ψ
10
30
5
DISTRIBUTION OF ψ
y
5
DISTRIBUTION OF ψ
x
Structure From Motion Using Sequential Monte Carlo Methods
30
10
0
2 4 AZIMUTH ANGLE
(e)
6
0
5
10 15 20 FRAME NUMBER
(f)
Figure 7.
of the sequence, the camera moved downward along the vertical axis of the image plane and simultaneously rotated about the horizontal axis. The field of view of the camera is only 0.2 radian. This is a typical set-up for producing the ambiguity of translation-rotation confusion. We observe in Figure 7 (e) that at least two different peaks exist in the distribution of the translational direction angle β, one near 0 and the other near π. These two modes represent two possible translation direction along the image plane: the mode near π indicates downward motion and the other upward. The distributions of rotation about the horizontal axis of the image plane is shown in (b), which bear multi-mode patterns and large variances. 4.4.. M IXED - DOMAIN S EQUENCE P ROCESSING The processing of mixed-domain sequences was discussed by Oliensis (Oliensis, 2000) as a challenge for SfM algorithms. Due to the constraints about camera translation (small or large) implicitly or explicitly assumed by researchers when SfM algorithms were designed, many existing SfM algorithms do not work well for mixed-domain sequences. In our approach, since no assumptions about translation are made, mixed-domain sequences can be
ijcv_sis.tex; 15/01/2004; 14:55; p.35
25
30
36
Gang Qian and Rama Chellappa 5 z
DISTRIBUTION OF ψ
DISTRIBUTION OF ψ
DISTRIBUTION OF ψ
y
5
x
5 10
10
15
10
15
20
15
20
25
20
25
30
25
30
35
30
35
40
35
40
40
−2 0 2 ROTATION ABOUT THE X AXIS
−2 0 2 ROTATION ABOUT THE Y AXIS
(a)
−2 0 2 ROTATION ABOUT THE Z AXIS
(b)
EFFECTIVE SAMPLE SIZE
5
1200
DISTRIBUTION OF β
DISTRIBUTION OF α
5
(c)
1400
10
10
15
1000
15
20
20
25
25
30
30
35
35
40 0
40 1 2 ELEVATION ANGLE
3
0
2 4 AZIMUTH ANGLE
(d)
6
800 600 400 200 0
(e)
10
20 30 FRAME NUMBER
(f)
TRANSLATION MAGNITUDE
Figure 8. 0.8
GROUND−TRUTH ESTIMATE
NORMALIZED DEPTH
2.5
0.6
2
1.5
0.4 0.2 0
1
0.5
10
20 30 FRAME NUMBER
(a)
40
0 0
5 10 FEATURE POINT INDEX
15
(b)
Figure 9.
correctly processed. In this example, a sequence containing both small and large translation was used. The camera translation magnitude ranges from 0.2 to 3.5 times of the depth of the nearest feature point. Therefore, this sequence has both small and large camera translation. The pixel size of the image frame in this example is 256 × 256. The feature point correspondences were contaminated by AWGN with zero mean and two pixels of STD. In the beginning, the signal-to-noise-ratio (SNR) of the feature correspondences is low because of small camera motion, it is very easy for EKF-based algorithm to converge to false solutions. Since in these algorithms, only one “optimal” solution is kept in the recursion, they will be trapped in the false solution. However, in our approach, as the posterior distribution of camera motion is approximated by samples and weights, good samples producing
ijcv_sis.tex; 15/01/2004; 14:55; p.36
40
37
Structure From Motion Using Sequential Monte Carlo Methods
1.5
1.5
1
0.5
1.5
1
0.5 20 30 FRAME NUMBER
0
40
10
1
0.5
1
0
10
DEPTH ESTIMATE
DEPTH ESTIMATE
1.5
1.5
1
0.5 10
20 30 FRAME NUMBER
(i)
10
40
1
0
20 30 FRAME NUMBER
20 30 FRAME NUMBER
(j)
10
40
40
2.5
2
2
1.5
1
0
20 30 FRAME NUMBER
(h)
0.5 10
0
40
1.5
0.5
40
1
0.5
2.5
2
20 30 FRAME NUMBER
2
(g)
2.5
2
40
1.5
1
0
40
20 30 FRAME NUMBER
2.5
2
(f)
2.5
DEPTH ESTIMATE
20 30 FRAME NUMBER
10
(d)
0.5
(e)
0
40
1.5
0.5 40
20 30 FRAME NUMBER
2.5
2
1.5
20 30 FRAME NUMBER
10
(c)
DEPTH ESTIMATE
DEPTH ESTIMATE
DEPTH ESTIMATE
1.5
10
0
40
2.5
2
0
20 30 FRAME NUMBER
1
0.5
(b)
2.5
0
1
0.5
(a)
2
1.5
DEPTH ESTIMATE
10
2.5
2
DEPTH ESTIMATE
0
2.5
2
DEPTH ESTIMATE
2
DEPTH ESTIMATE
2.5
DEPTH ESTIMATE
DEPTH ESTIMATE
2.5
1
0.5 10
20 30 FRAME NUMBER
(k)
40
0
10
(l)
Figure 10.
small residual errors will be kept in the sample set. When the SNR is low, motion samples both close to and far from to true camera motion are kept. When the camera moves further, the SNR is increased and samples far from the true motion produce large residual errors hence less weights are assigned to them and gradually they vanish from the SIS procedure while good samples close to the true motion remain in the sample set and keep tracking the camera motion. That is the basic reason why our approach can handle a wide range of image sequences regardless the types of camera motion and scene structure. The results of processing this mixed-domain sequence are shown in Figure 8. The camera translation and depth estimates are given in Figure 9. The corresponding depth estimation results are shown in Figure 10. The feature tracking noises in this example was higher than in the previous case since the sizes of the images were much smaller and the final results were slightly worse than that in the previous case.
ijcv_sis.tex; 15/01/2004; 14:55; p.37
38
Gang Qian and Rama Chellappa
4.5.. M ISMATCHED F EATURE P OINTS Mismatching of feature points is another source of measurement errors in the SfM problems. It happens when two or several features with similar appearances are located in image frames close to each other during the feature tracking process. This makes the feature tracker follow a wrong feature point instead of the correct one. The errors created by mismatched feature points cannot be statistically modeled using Gaussian random variables (Zhang, 1996). When mismatched feature points present, they affect the quality of the motion estimate if they are not dealt properly. Recall that in Section 2, when we derived the equation of the joint likelihood of the whole observation of all feature points, we suggested to use (16) if some features are mismatched. The median value of the likelihood of all feature points is found at first. Then “good” features whose likelihood is larger than this median value are found and the product of their likelihood is used as the joint likelihood of the whole observation. By using (16), the effect of mismatched points can be removed and motion estimates can still be obtained. Simultaneously, the mismatched feature points can be detected by looking for feature points with large residual errors which are the resultant epipolar distances in our approach. In our experiment, 50 feature points were tracked through a synthetic sequence and among them, 20 were mismatched. Figure 11 shows the posterior distributions of the motion parameters, where the likelihoods were evaluated using (16).
4.6.. P URE ROTATION In this experiment, the camera at first only rotated about the vertical axis of the image plane and after 20 frames, it started to move toward the right. In Figure 12, the posterior distributions of the motion parameters are shown. The posterior probability that the sequence is pure rotation is computed using (20) and is shown Figure 12 (f). We see that the probability is one in the beginning
ijcv_sis.tex; 15/01/2004; 14:55; p.38
39
10
DISTRIBUTION OF ψ
DISTRIBUTION OF ψ
10
DISTRIBUTION OF ψ
10
z
y
x
Structure From Motion Using Sequential Monte Carlo Methods
20
20
30
20
30
40
30
40
40
−2 0 2 ROTATION ABOUT THE X AXIS
−2 0 2 ROTATION ABOUT THE Y AXIS
(a)
−2 0 2 ROTATION ABOUT THE Z AXIS
(b)
(c)
10
DISTRIBUTION OF β
DISTRIBUTION OF α
10 20
20
30
30
40 0
EFFECTIVE SAMPLE SIZE
1000
40 1 2 ELEVATION ANGLE
3
0
(d)
2 4 AZIMUTH ANGLE
800 600 400 200 0
6
10
(e)
20 30 FRAME NUMBER
40
(f)
Figure 11.
5 z
DISTRIBUTION OF ψ
DISTRIBUTION OF ψ
DISTRIBUTION OF ψ
y
5
x
5 10
10
15
10
15
20
15
20
25
20
25
30
25
30
35
30
35
35
−2 0 2 ROTATION ABOUT THE X AXIS
−2 0 2 ROTATION ABOUT THE Y AXIS
(a)
−2 0 2 ROTATION ABOUT THE Z AXIS
(b)
(c)
1
DISTRIBUTION OF β
0.8
10
15
15
20
0.6
20
25
0.4
25
30 35 0
PROB. OF PURE ROTATION
5
DISTRIBUTION OF α
5 10
0.2
30 35
1 2 ELEVATION ANGLE
(d)
3
0
2 4 AZIMUTH ANGLE
(e)
6
0
10
20 FRAME NUMBER
(f)
Figure 12.
up to the 20th frame, which shows that the camera is only rotating. From around the 24th frame, it dramatically decreases to 0 because the camera started to translate.
ijcv_sis.tex; 15/01/2004; 14:55; p.39
30
40
Gang Qian and Rama Chellappa
4.7.. E XPERIMENTS U SING Yosemite S EQUENCE We have applied the proposed approach to the well-known Yosemite sequence. Feature points were detected and tracked through the sequences by using the well known KLT feature tracker (Tomasi and Shi, 1994). The reconstructed 3D model is shown in Figure 13. The depth variation in the valley can be clearly observed in the reconstructed model.
4.8.. E XPERIMENTS U SING R EAL I MAGES Real image sequences have been used to test the proposed algorithm. The KLT tracker is used to provide feature correspondences.
Outdoor sequence In the first example, an outdoor sequence is used. In the scene, there is a moving vehicle and some of the feature points are located on the moving vehicle. The up-most-left figure in Figure 14 shows one frame of the sequence and the remaining figures in Figure 14 show the reconstructed 3D model. We can clearly see the 3D structure of the tower and the ground plane.
Face sequence In the second example, a 3D face model is reconstructed from a face sequence. Since the proposed method is feature-based, the depth values of a set of feature points are first computed using the proposed approach and then the depth field of the entire object is obtained by using the interpolation function griddata in M ATLAB 6.1.0. Figures 15 show the intensity map of the face (the up-most-left one) and the reconstructed face model from different viewpoints.
UMASS PUMA2 sequence The 30-frame long PUMA2 sequence was taken by mounting a camera at the end of a robot arm. The robot arm was rotated for 120 degrees (2.09 rad.) and 30 image frames were taken. The radius of
ijcv_sis.tex; 15/01/2004; 14:55; p.40
Structure From Motion Using Sequential Monte Carlo Methods
41
the robot arm is approximately 1.8 feet. The PUMA2 sequence is not a purerotation sequence, because when the camera moves along a circle, it translates slightly. However, since the radius of the robot arm is small compared to the depth of scene, in the initial part of the sequence, the motion of the sequence is very close to pure rotation about the optical axis. Figure 16 shows the location and trajectories of feature points used to compute the motion of the camera. The motion distributions and P (pure rotation) of this sequence at different time instants are given in Figure 17. Plot (c) shows the ground-truth (the thick line) and computed distribution of the rotation about the optical axis. Plot (f) shows the posterior probability of pure rotation of the sequence at different time instant. In the beginning, this probability is one and it means that the sequence was categorized as a pure-rotation sequence. As the translation size increased, this probability goes to zero which is true according to the generative model of the sequence. Although EKF based algorithm has been used to estimate the camera motion using PUMA2 sequence and good motion estimates have been obtained (Wu et al., 1995), our algorithm is able to measure the probability of the pure rotation of the camera motion, without looking at the translation magnitude. It makes the measurement of this probability more direct and accurate and certainly is an advantage over other algorithms.
Dynamic scenes The SIS procedure for detecting moving objects in dynamic scenes has been tested using both synthetic and real images. One experimental results using real video is shown below. In this experiment, a sequence with a walking person was captured using a moving camera. Twenty feature points were detected and tracked throughout the sequence. Figure 18 shows their locations and trajectories in the image plane. Twelve feature points (No. 2, 3, 5, 6, 7, 8, 9, 13, 14, 15, 17, 19) are on the walking person and the remaining on the background. By using the modified SIS algorithm for dynamic scenes, the points on the walking person can be segmented out from the feature set. Since points on the walking person are relatively static
ijcv_sis.tex; 15/01/2004; 14:55; p.41
42
Gang Qian and Rama Chellappa
and they outnumbered the background features, the camera motion computed here is relative to the walking person. Figure 19 shows the posterior motion distributions. Figure 20 (a-c) are the empirical means and variances using the samples and weights of the validity vectors at initial, medium and late time instants. We see that the structure of the validity vector evolved to the desired pattern: entries corresponding to the points on the relative background have high positive values and those related to the relative moving objects are negative. As more frames are processed, the difference between the entries of these two categories in the validity vectors becomes large and the variances of the validity vector samples decrease, which indicates the convergence of the computation of validity vector. The segmentation result is shown in Figure 18 (c). Feature points belonging to the walking person are marked by circles.
5. Conclusion
A sequential importance sampling based SfM algorithm has been presented. The posterior distribution of the camera motion and scene structure are approximated by sample and weight sets. Experimental results using both synthetic and real images show that the proposed method is capable of dealing with the difficulties met in the SfM problem due to errors in feature tracking, feature occlusion, motion/structure ambiguity, mixed-domain sequences, mismatched feature points, and independently moving objects.
Acknowledgments
The work presented in this paper is partially supported by the Office of Naval Research under the grant N00014-011-0265. We are grateful to the anonymous reviewer for pointing out errors in an earlier version of the paper.
ijcv_sis.tex; 15/01/2004; 14:55; p.42
Structure From Motion Using Sequential Monte Carlo Methods
43
Appendix A. A Proposition Proposition 2. The distribution p(zt |γt , xt , yt ) is proportional to p(yt |γt , xt , zt )π(zt ).
Proof. The conditional distribution of zt given the observation and the motion parameter p(zt |γt , xt , yt ) can be written using the Bayes’ rule as p(zt , γt , xt , yt ) p(γt , xt , yt ) p(yt |zt , γt , xt )p(γt , xt , zt ) = p(γt , xt , yt ) Since the motion parameter and the depth values of the feature points are p(zt |γt , xt , yt ) =
independent, we have p(γt , xt , zt ) = p(γt , xt )π(z) Because γt , xt and yt are all known and p(γt , xt ) and p(γt , xt , yt ) are constants, we have p(zt |γt , xt , yt ) ∝ p(yt |γt , xt , zt )π(zt ) Hence p(zt |γt , xt , yt ) is proportional to p(yt |γt , xt , zt )π(zt ).
B. Proof of Equation (33)
p(Γt |Xt , Yt ) = p(Γt−1 |Xt−1 , Yt−1 )p(γt |γt−1 )
p(yt |γt , xt ) p(yt |xt )
Proof. p(Γt , Xt , Yt ) p(Xt , Yt ) p(yt |γt , xt )p(γt |γt−1 )p(xt |xt−1 )p(Γt−1 , Xt−1 , Yt−1 )) = p(yt |xt )p(xt |xt−1 )p(Xt−1 , Yt−1 ) p(yt |γt , xt ) = p(Γt−1 |Xt−1 , Yt−1 )p(γt |γt−1 ) p(yt |xt )
p(Γt |Xt , Yt ) =
ijcv_sis.tex; 15/01/2004; 14:55; p.43
44
Gang Qian and Rama Chellappa
C. Proof of Equation (46)
p(Yt−1 ) p(z|Yt ) = p(z|Yt−1 ) p(Yt )
Z γt ,xt
p(yt |γt , xt , z)p(γt |γt−1 )p(xt |xt−1 )dγt dxt
Proof. Recall that p(Γt |Xt , Yt ) = p(Γt−1 |Xt−1 , Yt−1 )p(γt |γt−1 ) p(z|Γt , Xt , Yt ) = p(z|Γt−1 , Xt−1 , Yt−1 ) p(Xt |Yt ) =
p(yt |γt , xt ) p(yt |xt )
p(yt |γt , xt , z) p(yt |γt , xt )
p(Yt−1 ) p(yt |xt )p(xt |xt−1 )p(Xt−1 |Yt−1 ) p(Yt )
Hence, we have Z
p(z|Yt ) =
Γt ,Xt
p(z, Γt , Xt |Yt )dΓt dXt
Z
=
Γt ,Xt
p(z|Γt , Xt , Yt )p(Γt |Xt , Yt )p(Xt |Yt )dΓt dXt
Z
p(yt |γt , xt , z) · p(yt |γt , xt ) Γt ,Xt p(yt |γt , xt ) p(Γt−1 |Xt−1 , Yt−1 )p(γt |γt−1 ) · p(yt |xt ) p(Yt−1 ) p(yt |xt )p(xt |xt−1 )p(Xt−1 |Yt−1 ) dΓt dXt p(Yt ) Z p(Yt−1 ) = p(z, Γt−1 , Xt−1 |Yt−1 )dΓt−1 dXt−1 · p(Yt ) Γt−1 ,Xt−1 =
p(z|Γt−1 , Xt−1 , Yt−1 )
Z
γt ,xt
p(yt |γt , xt , z)p(γt |γt−1 )p(xt |xt−1 )dγt dxt
p(Yt−1 ) = p(z|Yt−1 ) p(Yt )
Z γt ,xt
p(yt |γt , xt , z)p(γt |γt−1 )p(xt |xt−1 )dγt dxt
ijcv_sis.tex; 15/01/2004; 14:55; p.44
Structure From Motion Using Sequential Monte Carlo Methods
45
References
Adiv, G.: 1989, ‘Inherent Ambiguities in Recovering 3-D Motion and Structure from a Noisy Flow Field’. IEEE Trans. on Pattern Analysis and Machine Intelligence 11(5), 477–489. Azarbayejani, A. and A. Pentland: 1995, ‘Recursive Estimation of Motoin, Structure, and Focal Length’. IEEE Trans. on Pattern Analysis and Machine Intelligence 17, 562–575. Broida, T. J., S. Chandrashekhar, and R. Chellappa: 1990, ‘Recursive Estimation of 3-D Kinematics and Structure from a Noisy Monocular Image Sequence’. IEEE Trans. on Aerospace and Electronic Systems 26, 639–656. Chiuso, A., P. Favaro, , H. Jin, and S. Soatto: 2002, ‘Motion and Structure Causally Integrated Over Time ’. IEEE Trans. on Pattern Analysis and Machine Intelligence 24, 523–535. Daniilidis, K. and H. Nagel: 1993, ‘The Coupling of Rotation and Translation in Motion Estimation of Planar Surfaces’. In: IEEE Computer Vision and Pattern Recognition, New York, NY. pp. 188–193. Dellaert, F., S. Seitz, C. Thorpe, and S. Thrun: 2000, ‘Structure from motion without correspondence’. In: IEEE Computer Vision and Pattern Recognition, Hilton Head, SC. Dempster, A. P., N. M. Laird, and D. B. Rubin: 1977, ‘Maximum likelihood from incomplete data via the EM algorithm’. Journal of the Royal Statistical Society, B, 39, 1–38. Doucet, A., N. Freitas, and N. Gordon: 2001, Sequential Monte Carlo Methods in Practice. New York: Springer-Verlag. Faugeras, O.: 1993, Three-Dimensional Computer Vision: A Geometric Viewpoint. MIT Press. Forsyth, D., S. Ioffe, and J. Haddon: 1999, ‘Bayesian Structure from Motion’. In: International Conference on Computer Vision, Corfu, Greece. pp. 660–665. Gordon, N., D. Salmon, and A. Smith: 1993, ‘Novel Approach to non-linear/non-Gaussian Bayesian state estimation’. IEE Proceedings 140, 107–113. Hartley, H. O.: 1958, ‘Maximum likelihood from incomplete data’. Biometrics 14, 174–194. Hartley, R. and A. Zisserman: 2000, Multiple View Geometry. Cambridge, UK: Cambridge University Press. Huang, T. and A. Netravali: 1994, ‘Motion and Structure from Feature Correspondences: A Review’. Proceedings of the IEEE 82(2), 252–268. Isard, M. and A. Blake: 1996, ‘Contour Tracking by Stochastic Propagation of Conditional Density’. In: European Conference on Computer Vision, Cambridge, UK. pp. I:343–356. Jebara, T., A. Azarbayejani, and A. Pentland: 1999, ‘3-D Structure from 2D Motion’. IEEE Signal Processing Magazine 16, 66–84. Jerian, C. and R. Jain: 1991, ‘Structure from Motion: A Critical Analysis of Methods’. IEEE Trans. Systems, Man and Cybernetics 21, 572–588.
ijcv_sis.tex; 15/01/2004; 14:55; p.45
46
Gang Qian and Rama Chellappa
Kitagawa, G.: 1996, ‘Monte Carlo Filter and Smoother for Non-Gaussian Nonlinear State Space Models’. Journal of Computational and Graphical Statistics 5(1), 1–25. Kong, A., J. S. Liu, and W. H. Wong: 1994, ‘Sequential imputation method and Bayesian missing data problems’. Journal of the American Statistical Association 89, 278–288. Liu, J. S. and R. Chen: 1998, ‘Sequential Monte Carlo Methods for Dynamic Systems’. J. Amer. Statist. Assoc. 93, 1032–1044. Longuet-Higgins, H.: 1981, ‘A Computer Algorithm for Reconstructing a Scene from Two Projections’. Nature 293, 133–135. Oliensis, J.: 2000, ‘A Critique of Structure from Motion Algorithms’. Technical Report www.neci.nj.com/˜ homepages/oliensis/poleiccv.ps, NEC Research Institute, Princeton, NJ. Qian, G., R. Chellappa, and Q. Zheng: 2001, ‘Robust structure from motion estimation using inertial data’. Journal of the Optical Society of America A 18, 2982–2997. Soatto, S. and R. Brockett: 1998, ‘Optimal Structure from Motion: Local Ambiguities and Global Estimates’. In: IEEE Computer Vision and Pattern Recognition, Santa Barbara, CA. pp. 282–288. Soatto, S. and P. Perona: 1998, ‘Reducing Structure-From-Motion: A General Framework For Dynamic Vision Part 1: Modeling’. IEEE Trans. on Pattern Analysis and Machine Intelligence 20(9), 933–942. Tian, T., C. Tomasi, and D. Heeger: 1996, ‘Comparison of Approaches to Egomotion Computation’. In: IEEE Computer Vision and Pattern Recognition, San Francisco, CA. pp. 315–320. Tomasi, C. and T. Kanade: 1992, ‘Shape and Motion from Image Streams under Orthography: A Factorization Method’. International Journal of Computer Vision 9(2), 137–154. Tomasi, C. and J. Shi: 1994, ‘Good Features to Track’. In: IEEE Computer Vision and Pattern Recognition, Seattle, WA. pp. 593–600. Wu, T., R. Chellappa, and Q. Zheng: 1995, ‘Experiments on Estimating Egomotion and Structure Parameters Using Long Monocular Image Sequences’. International Journal of Computer Vision 15, 77–103. Young, G. and R. Chellappa: 1992, ‘Statistical Analysis of Inherent Ambiguities in Recovering 3-D Motion from a Noisy Flow Field’. IEEE Trans. on Pattern Analysis and Machine Intelligence 14(10), 995–1013. Zhang, Z.: July 1996, ‘Determining the Epipolar Geometry and its Uncertainty: A Review’. Technical report, French National Institute for Research in Computer Science and Control (INRIA) No. 2927.
ijcv_sis.tex; 15/01/2004; 14:55; p.46
Structure From Motion Using Sequential Monte Carlo Methods
47
Figure 13.
ijcv_sis.tex; 15/01/2004; 14:55; p.47
48
Gang Qian and Rama Chellappa
Figure 14.
ijcv_sis.tex; 15/01/2004; 14:55; p.48
Structure From Motion Using Sequential Monte Carlo Methods
49
Figure 15.
ijcv_sis.tex; 15/01/2004; 14:55; p.49
50
Gang Qian and Rama Chellappa
4
1
3 5
15 10
6
9 14 17
7
16
11 12
13
2 8
(a)
(b)
10
10
15
10
15
20
15
20
25
20
25
30
25
30
−2 0 2 ROTATION ABOUT THE X AXIS
5
DISTRIBUTION OF ψ
z
5
DISTRIBUTION OF ψ
y
5
DISTRIBUTION OF ψ
x
Figure 16.
30
−2 0 2 ROTATION ABOUT THE Y AXIS
(a)
(b)
−2 0 2 ROTATION ABOUT THE Z AXIS
(c)
5
DISTRIBUTION OF β
DISTRIBUTION OF α
5
PROB. OF PURE ROTATION
1
10
0.8
10
15
0.6
15
20
0.4
20
25
0.2
25
30 0
1 2 ELEVATION ANGLE
30
3
(d)
0
2 4 AZIMUTH ANGLE
6
0
5
10 15 20 FRAME NUMBER
(e)
(f)
Figure 17.
4 12
4 12 10
13 2 9 7 6 3 15
20
14 5
11 18
19 8
14
17
5 1
(a)
10
13 2 9 7 6 3 15
20
16
11 18
19 8
17
1
(b)
16
(c)
Figure 18.
ijcv_sis.tex; 15/01/2004; 14:55; p.50
25
30
51
20 40 60 80
100
20
DISTRIBUTION OF ψz
DISTRIBUTION OF ψy
DISTRIBUTION OF ψx
Structure From Motion Using Sequential Monte Carlo Methods
40 60 80
100
−2 0 2 ROTATION ABOUT THE X AXIS
40 60 80
100
−2 0 2 ROTATION ABOUT THE Y AXIS
(a)
20
(b)
−2 0 2 ROTATION ABOUT THE Z AXIS
(c)
40 60 80
100 0
1 2 ELEVATION ANGLE
20 40 60 80
100
3
(d)
EFFECTIVE SAMPLE SIZE
20
DISTRIBUTION OF β
DISTRIBUTION OF α
100
0
2 4 AZIMUTH ANGLE
80 60 40 20 0
6
20
(e)
40 60 80 FRAME NUMBER
(f)
Figure 19.
40
VALIDITY VECTOR
VALIDITY VECTOR
6 4 2 0
20 0
−400
−40
−4 5 10 15 20 FEATURE POINT INDEX
(a)
25
−60 0
0
−200
−20
−2
−6 0
200
VALIDITY VECTOR
8
−600
5 10 15 20 FEATURE POINT INDEX
(b)
25
−800 0
5 10 15 20 FEATURE POINT INDEX
25
(b)
Figure 20.
ijcv_sis.tex; 15/01/2004; 14:55; p.51
100
52
Gang Qian and Rama Chellappa
Figure 1: Overview of the algorithm Figure 2: Motion parameters of a moving camera Figure 3: Epipolar line segment Figure 4: Camera motion estimation results in the case study. (a)-(e) are the posterior distributions of the camera motion. (f) shows the effective sample sizes of during the SIS procedure for camera motion. Figure 5: Camera translation magnitudes and feature point depth estimates in the case study. (a) shows the empirical means and variances of the translation magnitudes at different time instants, the thicker lines indicating the ground-truth. (b) shows the empirical mean of the depth samples from the two SIS procedures with (the diamonds) and without (the squares) scene rigidity constraint. The ground-truth is marked by circles. Figure 6: Posterior depth distributions in the case study. Figure 7: Posterior distributions of the motion parameters in the structure/motion ambiguity case. (f) shows the ESS in this case. Figure 8: Results of processing a mixed-domain sequence. (a)-(e) are the posterior distributions of the camera motion. (f) shows the ESS in this case. Figure 9: Camera translation magnitudes and feature point depth estimates for a mixed-domain sequence. (a) shows the empirical means and variances of the translation magnitudes at different time instants, the thicker lines indicating the ground-truth. (b) shows the empirical mean of the depth samples from the two SIS procedures with (the diamonds) and without (the squares) scene rigidity constraint. The ground-truth is marked by circles. Figure 10: Posterior depth distributions in the mixed-domain sequence case. Figure 11: Posterior motion distributions when mismatched feature points present. (f) shows the ESS in this case. Figure 12: Posterior motion distributions when the camera first only rotates. (f) shows P (pure rotation) of this sequence. Figure 13: The texture map and reconstructed 3D model of the Yosemite sequence.
ijcv_sis.tex; 15/01/2004; 14:55; p.52
Structure From Motion Using Sequential Monte Carlo Methods
53
Figure 14: The texture map and reconstructed 3D model of the outdoor sequence. Figure 15: The intensity texture map and reconstructed 3D model of the face sequence. Figure 16: Feature locations and trajectories using the PUMA2 sequence. Figure 17: Posterior motion distributions using the PUMA2 sequence. (f) shows P (pure rotation) of this sequence. Figure 18: Feature locations and trajectories using the sequence with a walking person. (c) shows the feature points segmentation results. Points belonging to the walking person are marked by circles. Figure 19: Posterior distributions of the motion parameters using the sequence with a walking person. (f) shows the ESS in this case. Figure 20: Empirical means and variances of the sample sets of the validity vector from using the sequence with a walking person. (a-c) shows the results at the initial, medium and later time instants. We can see that the validity vector samples gradually converge to the desired structure with low variations.
ijcv_sis.tex; 15/01/2004; 14:55; p.53
ijcv_sis.tex; 15/01/2004; 14:55; p.54