For this model inputs are assumed to be ACT score, GPA/class-rank, EFC, FAFSA, zip code ... amount and the single output is the student yield, where a one/zero system for ... is inspired by biological neural networks found in human brains. ... are increased to 10. ... The total collected data contains ͶͲͺʹ student records.
Available online at www.sciencedirect.com
ScienceDirect Procedia Computer Science 61 (2015) 341 – 348
Complex Adaptive Systems, Publication 5 Cihan H. Dagli, Editor in Chief Conference Organized by Missouri University of Science and Technology 2015-San Jose, CA
Student Yield Maximization Using Genetic Algorithm on a Predictive Enrollment Neural Network Model Z. Sarafraza, H. Sarafraza, M. Sayeha, and J. Nicklowb b
a Department of Electrical & Computer Engineering Office of the Provost and Vice Chancellor for Academic Affairs and Department of Civil and Environmental Engineering Southern Illinois University Carbondale
Abstract Institutions that allocate scholarship effectively among their prospective students benefit from improved enrollments, improved retention and potential increase in state and federal funding. Accordingly, the primary objective of this research is to develop a scholarship distribution model that enables academic enrollment offices to maximize student yield through efficient scholarship distribution. This paper presents the design of and tests a multi-layer feed-forward neural network (NN) in modeling the student yield factor. For this model inputs are assumed to be ACT score, GPA/class-rank, EFC, FAFSA, zip code and scholarship award amount and the single output is the student yield, where a one/zero system for accepting/declining the offer in attending the university is considered. The network is trained by applying the back error propagation algorithm, and is tested on holdout samples. A reliable testing result of 80% is achieved for the trained student yield neural network model. Having this model in hand, an optimization technique, Genetic Algorithm (GA), is applied to find an optimum scholarship distribution that maximizes total student yield. © 2015 byby Elsevier B.V. This is an open access article under the CC BY-NC-ND license © 2015 The TheAuthors. Authors.Published Published Elsevier B.V. (http://creativecommons.org/licenses/by-nc-nd/4.0/). Peer-review under responsibility of scientific committee of Missouri University of Science and Technology. Peer-review under responsibility of scientific committee of Missouri University of Science and Technology
Keywords: feed-forward neural networks; student yield models; genetic algorithm; scholarship distribution; enrollment management
1. Introduction One of the major challenges facing university enrollment management offices is finding a leveraging strategy for financial aid and scholarships that maximizes enrollments. Doing so has become increasingly complex due to increased competition between collages as a result of prospective student population declines16. Yet, enrollment continues to be an increasingly important parameter as university budgets become more dependent on tuition
1877-0509 © 2015 The Authors. Published by Elsevier B.V. This is an open access article under the CC BY-NC-ND license (http://creativecommons.org/licenses/by-nc-nd/4.0/). Peer-review under responsibility of scientific committee of Missouri University of Science and Technology doi:10.1016/j.procs.2015.09.154
342
Z. Sarafraz et al. / Procedia Computer Science 61 (2015) 341 – 348
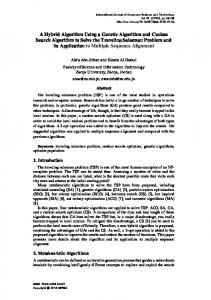
revenue17. Different methods have been developed for the purpose of predicting enrollment and maximizing yield, or matriculation of admitted students. In general, researchers in this field mainly attempt to solve the problem in two steps. The first step is to create a reliable predictive model of enrollment, and the next step is trying to maximize enrollment through some effective parameters (scholarship …) of the model. In literature on matriculation studies many methods have been employed in order to achieve a reliable predictive model. For example, logistic regression, least square regression, discrimination analysis, and neural networks (NN) 12. A common aspect in all these methods is predicting the probability of enrollment by examining different factors that effect a student’s decision making process when he or she considers enrollment. Among these approaches, NN is a relatively new and better performing method that forecasts an applicant’s enrollment decision. For example, Walczak and Sincish have investigated two predictive methods, Logistic regression and the NN, on the same data, claiming that NN outperformed the other technique in terms of prediction accuracy23. Walczak7 presented a comparative study of six different types of supervised learning NN architectures that ultimately predicted the probability of an applicant’s acceptance (or denial) of school admission. This study was of great importance due to university resource constraints and the high volume of applicants; it was especially helpful for enrollment managers in order to efficiently allocate their resources among students with higher yield factor probability. Similar investigations7-11, 15 have been done on a very similar problem, resource allocation, but these studies lack comprehensiveness compared to Walczak’s study. Most of these studies demonstrated that the best prediction results can be achieved by the back propagation architecture of NN in comparison to radial basis function, counter propagation, general regression, fuzzy ARTMAP and other neural network architectures. Enrollment prediction models are known as convoluted problems due to their dependency on a large number of factors influencing the process of student admissions. Thus, in order for neural network models to predict more accurate results, the most relative parameters in the problem need to be taken into account. Among these parameters are the academic abilities of the student, economic factors such as the availability of financial aid. Even student’s geographic origin can be considered. Along this line, many models attempted to define the effectiveness factors of the parameters that would affect student enrollments12-14. The cost of tuition is also another main factor in their decision making process of prospective students. One way to lower the cost of attendance is to offer financial aid packages to prospective students22. For every 1000 dollars of financial aid that a student receives, there is a 1.1% to 2.5% increase in the likelihood that the student will enroll24. Since financial aid has an especially important role in a low to middle-income student’s decision making process when choosing a collage, Spaulding and Olswang 2 designed a model that predicts the enrollment yield by modifying the financial aid award policy. Their model specifically addresses students with the highest financial needs as being a crucial financial aid constraint. Neural Networks are well known as prediction model tools in various fields such as engineering, medicine, science, etc. Neural Network is defined as clusters of neurons which are simple and non-linear function units, and their functionality is inspired by biological neural networks found in human brains. McCulloch and Pitts in 1943 represented the initial formula for artificial neurons, which today is understood to be a neural network model1.To develop the student yield model through efficient scholarship distribution, this paper describes the approach as follow: primarily, two different methods to design a NN structure for the student model is described which those are a pure MATLAB code method and then MATLAB’s built-in NN toolbox which is applied to simulate the predictive model. Secondly, after coming up with a reliable prediction model, an optimization technique, Genetic Algorithm, is applied to attain efficient scholarship distribution that yields to maximum total student enrollments. The model in this research is simulated based on Southern Illinois University Carbondale student data over the six-year period. The total number 4082 student records was used. The input vector of the model consists of seven parameters, ACT score, GPA/class-rank, EFC (expected family contribution), FAFSA (Free Application for Federal Student Aid), associated longitude and latitude of zip code, and scholarship dollar amount. Total data set is normalized to the range [-1, 1]. The output vector is a single value representing student enrollment decision (acceptance/denial). 2. Neural network student model In this section, the structure of predictive yield model using feedforward NN is shown in Fig. 1; given inputs to this model are ACT score, GPA, EFC, and the scholarship dollar-amount �ࡿ (two more inputs of student information will be considered in next section). The effects of all these inputs with their corresponding weights are delivered to the hidden layer neurons. The activation function for all neurons in this model assumes to be a sigmoid
Z. Sarafraz et al. / Procedia Computer Science 61 (2015) 341 – 348
functionΤሺ ࢋି࢝࢞ ሻ. Finally the nth student yield, ࢅ will give the output. Table 1 shows the predictive results obtained by our NN model for small set of data. Clearly, the Actual and predicted outputs show a very good match especially for the testing set. Furthermore, the training process will stop when it reaches a training error of 0.001, which is also evident in Fig. 2. The weights in this model are set to random values between [0, 1] initially and then
Fig. 1. Neural network structure
These values will get updated through the iterative learning process of neural network (training) till the weights reach a stable value. The stopping criteria for the updating weights is also determined with the training error. Although this pure coded method obtained satisfactory results on output predictions, it is not applicable to large sets of data due to its tardiness. This is why the method is applied to a small set of data. To tackle this problem, we have tried another training technique, MATLAB NN toolbox, which showed a much faster training process. The key concept utilized in this technique is the fast training algorithm known as Levenberg-Marquardt backpropagation20, 21. Other research suggests direct training using a combination of evolutionary programming (EP) and backpropagation (BP-EP) to tackle this computational time problem of training27. Table 1. Coded NN model results EFC (×10,000$)
Scholarship (×10,000 $)
Actual Output
Predicted Output
30 23 25 29 28 32 25 27 31 26
4 3.6 3.5 3.8 3.6 3.9 3.4 3.7 4 3.5
3 5 6 1 7 1 6.5 5 1 5
8.5 2 3.8 4.3 3.5 7.5 2.4 2.6 8.6 3.3
0.9 0.1 0.1 0.9 0.1 0.9 0.1 0.1 0.9 0.1
0.8901 0.1142 0.1158 0.8854 0.1121 0.8910 0.1118 0.1172 0.8911 0.1241
Testing
GPA
Training
ACT
Fig.2. Error of neural network
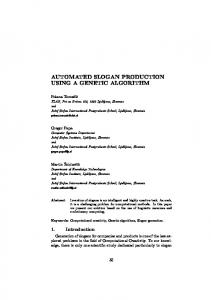
3. Neural network student model using MATLAB toolbox To address the simulation speed challenge of the predictive model on large data sets, another approach using MATLAB’s built-in NN toolbox is considered. In this model, three additional inputs, FAFSA and longitude and latitude of student’s living place ZIP code, are added to the previous model. In addition, the number of hidden neurons are increased to 10. Figure 3 represents the structure of the NN build by MATLAB’s toolbox, a two layers feedforward NN with sigmoid activation function in the hidden layer followed by a linear function (scaling) in output layer. This toolbox is highly customizable both in structure and network calculation algorithms. In our case, beside the structural
343
344
Z. Sarafraz et al. / Procedia Computer Science 61 (2015) 341 – 348
specifications mentioned earlier, Levenberg-Marquardt backpropagation algorithm25 (࢚࢘ࢇ) is used as the model training function. Table 2. Prediction accuracy by the best performing NN Inputs
Trained%
Validation%
Test%
80
82
82
Scholarship, ACT, GPA, EFC,FAFSA Fig. 3. Structure of proposed NN
order, Zip code
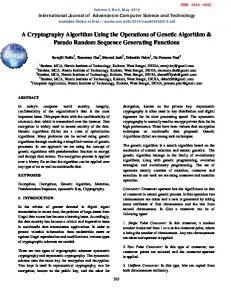
The total collected data contains ͶͲͺʹ student records. Per student 8 features are used, 7 of them are fed as inputs and one, actual yield, as output of the net. Again all inputs are mapped to [-1, 1] range in order to prevent output overflow. In other words, updated weights might cause greater than one values of inputs to grow exponentially in each iteration3. All input data are randomized and then divided into three sets of training, testing and validation with percentages of 70% (2858 samples), 15% (612 samples) and 15% (612 samples) respectively. The capability of NN in predicting student yield is satisfactory in the 612 samples of the testing data. This is discussed in more details in the next part. In order to add more robustness to the proposed network, a percentage of correct predictions is chosen as performance criteria. This percentage is an average of all three sets of data (training, validation and test) for each network and the highest percentage is considered as the best performing net. Since discrete value output of either zero or one is desired, a threshold point of 0.5 is assumed. Thus outputs higher than 0.5 will be one (acceptance status) and less than 0.5 will be zero (denial status). Prediction results of the best performing net (highest accuracy) among 100 trials are shown in Table 2. Each trial is different from another due to the existence of random initialization on choosing the testing, training and validation data set as well as random weight initialization. The best performing net is chosen based on the highest average prediction percentage of all three sets. In addition, to reach a stable result, the number of trials is increased from 10 to 100 in increments of ten where the average prediction accuracy grows from 79% to 81%. Larger number of trials won’t make any significant improvement to the average prediction accuracy. Overall the results indicate an excellent total reliability of over 80% in the student yield prediction (Table 2). In Fig.4 the best predicted yield at the best net as well as the actual yield are plotted, depicting only a sample size of 100 students. Also in Fig.4 is the threshold point of 0.5, which shows a match between the actual and predicted yield in most cases.
Fig. 4. Comparison of Actual output and Predicted output
4. Applying optimization technique Generally, a task of optimization is to improve certain properties of a system under an intentional set of criteria, ultimately exposing the best result. Considering that the reliable NN student model from the previous section is an objective function, one can apply optimization to the model. In this case, the aim optimization process is to maximize
Z. Sarafraz et al. / Procedia Computer Science 61 (2015) 341 – 348
the total student yield, σ ࢅ , with respect to an optimized scholarship distribution ࡿ . In the following section, genetic algorithm as an optimization technique is applied In this method, a linear constraint of a fixed total scholarship, σ Sn , is applied. 5. Genetic algorithm Genetic algorithms (GAs) have been developed as an adaptive heuristic search algorithm, which is inspired from biological evolution26. Primarily, GA was introduced by John Holland in the 1970s. His algorithm was recognized as a remarkable optimization method in finding the global maxima or minima of problems with highly nonlinear, nondifferentiable or stochastic objective functions6, 28. Briefly, the process of GA can be summarized as follows: Initially and at each step, the GA randomly selects chromosomes (sets of genes) from a population which are encoded sets of possible solutions, then utilizes them as new parents and recombines them. After that, the next generation is produced through a chosen GA’s operator such as crossover or mutation. Over successive generations, the population evolves toward an optimal solution by evaluating the chromosomes in their corresponding cost function and ranking them based on best fitness values. Finally, all chromosomes merge to an optimum solution, which in our case is the distribution of scholarships that maximizes the total student yield4, 5. In here, Genetic Algorithm is applied on the proposed NN student model using two methods: MATLAB optimization toolbox and the pure code of GA5. First, GA from the toolbox was applied, and although it was fast, the down side was limitations on altering some detailed algorithm parameters. Therefore, a parallel GA pure code method was employed to give more freedom. The general code structure can be described as follows: An initial random population, a ( ൈ ࡹ) matrix of chromosomes, are generated, where each chromosome (row) represents scholarship distribution ࡿ for ൌ ǡ ǥ ǡ ࡹ; here ࡹ is the total number of students and is the population size. Then, ensuring the linear constraint, σ ࡿ ൌ , is satisfied for each chromosome, the next step will be passing the population matrix to the cost function to calculate total student yield. Here the cost function is our NN model, and the code-wise steps are as follow: For ൌ ǣ (set of Scholarships) in the population For ൌ ǣ ࡹ (scholarship value for each student) ࢅࢋࢊ�= Predicted NN (six other student parameters,�ࡿ) end ሺሻ ࡺ
࢙࢚�ࢌࢉࢎ࢙࢘� ൌ ࢅࢋࢊ ୀ
end ሺሻ
Next, chromosomes of the population are sorted based on their corresponding cost results; i.e. chromosomes with higher total yields are assigned higher probabilities to be selected as parents to produce the next generation. The parent’s selection rule used here is called weighted roulette wheel rank 19. After sorting chromosomes, a percentage of low ranked chromosomes are omitted to open space for newly generated offspring. Here an omission rate of 50% is assumed (ࢄ࢘ࢇ࢚ࢋ ൌ Ǥ ). In the next step, offspring (bottom 50% of the population) are generated from the top ranked parent chromosomes by some mating rules. Two mating or recombination processes applied are crossover and mutation. The crossover method we used is a single point crossover, which means only one random point is chosen somewhere on the chromosome, and the genes to the right and left of that point (gene) are exchanged by corresponding parent genes. Also, to add more diversity in the population, some random values (in the scholarship range) are replace with the existing gene’s values. This method is known as mutation. Now the new population is generated and ready to be employed through the same algorithm process. The generation process will stop when all the population’s individuals reach the same scholarship distribution (termination condition). This point is basically the maximum point in our cost function and consequently implies the maximum student yield. This simulation results, for various data set
345
346
Z. Sarafraz et al. / Procedia Computer Science 61 (2015) 341 – 348
sizes obtained by applying GA pure code method on the predicted yield model, are summarized in Tables 3, 4. These sets are chosen randomly from the student data set Table 3. GA code results for different size of students Number of
Actual
Optimum
Improvement
Student
yield
yield (GA)
in enrollment
200
82
119
17%
500
190
272
17%
1000
385
521
13.5%
2000
951
1130
10%
4082
1640
2106
12%
The number of samples (students) have been changed to see the effect of genetic algorithm in enrollment improvement in smaller sample sizes (Table 3). As it is evident from the table 3 relatively higher yield is achieved for a smaller sample size. This behaviour can be justified by the objective function structure itself. Due to the high number of local maxima in the function, making the size of the data larger increases the probability of being trapped in local maxima. In other words, smaller total student yields (local maxima) are reached when the program runs for different starting points. The same trend was seen when toolbox GA was applied. In addition to that, since scholarships were awarded in limited discrete values (17) and lack continuity in the range of [0 - 87,780], this causes the search process to stop prematurely and in result, points get trapped in local maxima. Consequently, maximum yield is dropped by at least 5% when increasing the sample size to 20 times of the initial sample size. Setting most effective values for the GA’s configuration parameters is crucial, since those could directly affect search process time and the efficiency of the final solution. Also, parameters are somehow tied together and modifying some of them might affect others 18. In the following table, best maximum student’s yield is achieved with their corresponding population size and mutation rate. (Table 4) Table 4. Scholarship difference for two trial within 5% Number
Scholarship difference
Best Population
Best Mutation
of student
within 5% for two run
Size
Rate
206
77%
20
0.005
300
65%
30
0.005
500
77%
100
0.001
1000
61%
200
0.001
2000
54%
2000
0.0005
4082
45%
2000
0.0005
For each sample size the program ran two times, and scholarships within 5% are accepted to be identical. Again, it can be seen it is less likely to reach the same scholarship distribution (point in the function) for larger sample sizes. The final optimum scholarship distribution established by GA optimization method is depicted in Fig. 8. As result, GA has improved the total yield by 12 percent of actual yield.
Z. Sarafraz et al. / Procedia Computer Science 61 (2015) 341 – 348
347
6. Results and discussion The total student yield obtained by the GA approach shows in table 5. As mentioned earlier, higher student enrollment is due to an efficient scholarship distribution. Thus it is important to observe scholarship distributions obtained from this method. For this reason, actual and GA method optimization method scholarship distributions are depicted for all student data in Figures 5, 6 respectively. Figure 5 represents assigned scholarships to students in actual case, which is in the range of ሾͲ�ǡ ͺǡͲͲͲሿ. Based on this graph, majority of students were offered scholarships in range of ሾͲǡ ͶͲǡͲͲͲሿ (95%). Note that these scholarships were offered merit-base, i.e. higher scholarship amounts are given to students with better academic performance. Table 5. GA results Optimized Method
Number of Students
Actual yields
Simulated yields
Enrollments improvements
Genetic Algorithm
4082
1640
2106
12%
In the next step, GA optimization technique suggests even more students receive lower scholarship amounts (Fig. 6). Specifically, this method improves student yield by 12% when more than half of the total student population (almost 58%) receive Scholarships in the range ሾͲ�ǡ ͳͲǡͲͲͲሿ.
Fig. 5. Scholarship Distribution for actual Data 2009-2015
Fig. 6. Optimum Scholarship Distribution from Genetic Algorithm
7. Conclusion Throughout the years, enrollment managements have been seeking a reliable prediction yield model. Since they are restricted by school budget, they require a method to acquire optimal distribution on scholarship in order to achieve higher enrollment yield. The research objective presented in this paper addressed these concerns by designing the predictive NN of student yield and applying the optimization technique, GA, that is capable of finding optimized scholarship distribution given trained NN student yield model as input. As result, GA has improved the total yield by 12 percent of actual yield. Acknowledgment We would like to thank Terri Harfst for proving us with the data used in this study. This work was financially supported in part by Enrollment Management Office of Southern Illinois University Carbondale.
348
Z. Sarafraz et al. / Procedia Computer Science 61 (2015) 341 – 348
References 1. Haykin, Simon, and Richard Lippmann. "Neural Networks, A Comprehensive Foundation." International Journal of Neural Systems 5.4 (1994): 363-364. 2. Spaulding, Randy, and Steven Olswang. "Maximizing enrollment yield through financial aid packaging policies." Journal of Student Financial Aid 35.1 (2005): 3. 3. Gardner, M. W., and S. R. Dorling. "Neural network modelling and prediction of hourly NO x and NO 2 concentrations in urban air in London." Atmospheric Environment 33.5 (1999): 709-719. 4. Haupt, Randy L., and Douglas H. Werner. Genetic algorithms in electromagnetics. John Wiley & Sons, 2007. 5. Haupt, Randy L., and Sue Ellen Haupt. Practical genetic algorithms. John Wiley & Sons, 2004. 6. John, Holland. "Holland, Adaptation in natural and artificial systems." (1992). 7. Walczak, Steven. "Neural network models for a resource allocation problem."Systems, Man, and Cybernetics, Part B: Cybernetics, IEEE Transactions on28.2 (1998): 276-284. 8. Barnard, E., and L. F. A. Wessels. "Extrapolation and interpolation in neural network classifiers." Control Systems, IEEE 12.5 (1992): 50-53. 9. Bounds, David G., Paul J. Lloyd, and Bruce G. Mathew. "A comparison of neural network and other pattern recognition approaches to the diagnosis of low back disorders." Neural Networks 3.5 (1990): 583-591. 10. Fausett, L. V., and W. Elwasif. "Predicting performance from test scores using backpropagation and counterpropagation." Neural Networks, 1994. IEEE World Congress on Computational Intelligence, 1994 IEEE International Conference on. Vol. 5. IEEE, 1994. 11. Sorsa, Timo, Heikki N. Koivo, and Hannu Koivisto. "Neural networks in process fault diagnosis." Systems, Man and Cybernetics, IEEE Transactions on 21.4 (1991): 815-825. 12. Paulsen, Michael B. College Choice: Understanding Student Enrollment Behavior. ASHE-ERIC Higher Education Report No. 6. ASHE-ERIC Higher Education Reports, The George Washington University, One Dupont Circle, Suite 630, Dept. RC, Washington, DC 20036-1183, 1990. 13. Hossler, Don, and Karen S. Gallagher. "Studying Student College Choice: A Three-Phase Model and the Implications for Policymakers." College and university 62.3 (1987): 207-21. 14. Zemsky, Robert, and Penney Oedel. "The Structure of College Choice." (1983). 15. Walczak, Steven. "Categorizing university student applicants with neural networks." Neural Networks, 1994. IEEE World Congress on Computational Intelligence, 1994 IEEE International Conference on. Vol. 6. IEEE, 1994. 16. Ingersoll, R. J. "Successful Enrollment Management." American Association of Colleges of Nursing, Washington DC (1989). 17. Zemsky, Robert, and Penney Oedel. "The Structure of College Choice." (1983). 18. Grefenstette, John J. "Optimization of control parameters for genetic algorithms." Systems, Man and Cybernetics, IEEE Transactions on 16.1 (1986): 122-128. 19. Haupt, Randy L. "Thinned arrays using genetic algorithms." Antennas and Propagation, IEEE Transactions on 42.7 (1994): 993-999. 20. Levenberg K., A method for the solution of certain problems in least squares, Quarterly of Applied Mathematics 5,1944, 164-168 21. Marquardt D., An algorithm for least-squares estimation of nonlinear parameters, SIAM Journal on Applied Mathematics 11, 1963, 431-441 22. Hossler, D., Schmit, J., & Vesper, N. (1999). Going to college: How social, economic, and educational factors influence the decisions students make. JHU Press. 23. Walczak, S., & Sincich, T. (1999). A comparative analysis of regression and neural networks for university admissions. Information Sciences, 119(1), 1-20. 24. Braunstein, A., McGrath, M., & Pescatrice, D. (1999). Measuring the impact of income and financial aid offers on college enrollment decisions. Research in Higher Education, 40(3), 247-259. 25. Yu, H., & Wilamowski, B. M. (2011). Levenberg-marquardt training. Industrial Electronics Handbook, 5, 12-1. 26. Melanie, M. (1999). An introduction to genetic algorithms. Cambridge, Massachusetts London, England, Fifth printing, 3. 27. Muleta, Misgana K., and John W. Nicklow. "Joint application of artificial neural networks and evolutionary algorithms to watershed management." Water resources management 18.5 (2004): 459-482. 28. Mitchell, M. (1998). An introduction to genetic algorithms. MIT press.