while exploring sampling distributions in an âIntegrated Approachâ ... describe the students' articulations of uncertainty when they explore a sampling distribution.
Students’ reasoning about uncertainty while exploring sampling distributions in an “Integrated Approach” Hana Manor Braham, Dani Ben-Zvi and Keren Aridor The University of Haifa, Israel Abstract We analyze students’ articulations of uncertainty during their first steps in exploring sampling distributions in a TinkerPlots2 inquiry-based learning environment. A new pedagogical “integrated approach” was implemented to help students understand the relationship between sample and population. We focus in this case study on two students (age 13, grade 7) who had previously participated in the Connections Project EDA activities. We describe the students’ articulations of uncertainty when they explore a sampling distribution of proportions, negotiate the interval of proportions they agree to accept as “correct results,” and express their confidence level in getting this interval.
1. Introduction The recognition that judgments based on sample data are basically uncertain is a key idea of informal statistical inference (ISI). This implies that developing an understanding of ISI requires fostering probabilistic considerations. Sampling understanding research suggests that students tend to predict a sample outcome based on causal analysis instead of on statistical information obtained from a collection of sample outcomes (e.g., Konold, 1989). We suggest that an “integrated approach” to the relationship between sample and population can support students’ development of reasoning about uncertainty in the context of making ISIs. In this article we analyze students’ reasoning about uncertainty during their first steps in exploring sampling distributions in a TinkerPlots2 (TP2, Konold & Miller, 2011) inquiry-based learning environment. 2. Scientific Background Formal statistical inference The rationale behind collecting data in statistics is learning about real world situations. “Statistical inference moves beyond the data in hand to draw conclusions about some wider universe, taking into account that variation is everywhere and that conclusions are uncertain” (Moore, 2007, p. xxviii). In its simplest form the question of statistical inference deals with the manner of reaching general conclusions about what the true, long run situation is actually like, based on outcomes of a sample that can be conducted only once. Given only the sample evidence, the statistician is always unsure of any assertion he makes about the true state of the situation. The theory of statistical inference provides ways to assess this uncertainty and to calculate the probability of error in a particular decision. Uncertainty and statistical inference The ability to deal intelligently with uncertainty is one of the challenging goals of instruction about statistical inference since “it is the order in uncertainty that is hard to observe in casual settings” (Moore, 1991). Furthermore, our intuitive perception of chance profoundly contradicts the laws of probability that describe actual random behavior (Tversky & 1
Kahneman, 1971, 1974). When making judgments under uncertainty, people tend to take a singular perspective and assess probabilities “by the propensities of the particular case at hand” (Tversky and Kahneman, 1982, p. 517), rather than by a distributional perspective, which views an individual case as “an instance of a class of similar cases, for which relative frequencies of outcomes are known or can be estimated” (p.518). Konold (1989) found that people tend to base predictions of uncertain outcomes on causal explanations instead of on information obtained from repeating an experiment. When learning statistical inference, this orientation might be problematic because students have to consider the relative unusualness of a sampling process outcome. Informal statistical inference In order to give students a sense of the power of drawing reliable inferences from samples, and given that statistical inference is challenging for most students (Garfield & Ben-Zvi, 2008), Informal Statistical Inference (ISI) and Informal Inferential Reasoning (IIR) have recently became a focus of research (Pratt & Ainley, 2008; Makar, Bakker, & Ben-Zvi, 2011). ISI is a data-based generalization, which does not involve formal statistical procedures, that includes an articulated component of uncertainty (Makar & Rubin, 2009). IIR is the reasoning process that leads to the formulation of ISIs. IIR includes “the cognitive activities involved in informally drawing conclusions or making predictions about ‘some wider universe’ from patterns, representations, statistical measures and statistical models of random samples, while attending to the strength and limitations of the sampling and the drawn inferences” (Ben-Zvi, Gil, & Apel, 2007, p. 2). Sampling distribution Understanding the logic behind such ISIs contains several key statistical ideas, such as: relationship between sample and population, random sampling, sampling variability and sample size effect. An important component in IIR is informally quantifying the uncertainty resulting from drawing one random sample, which involves probabilistic thinking (Pfannkuch, Wild, & Parsonage, 2012). That meaning of this is of imagining the repeated collecting of samples with the result of a sampling distribution – the idea “that the values of a statistic are distributed somehow with a range of possibilities” (Thompson, Liu, & Saldanha, 2007, p. 209). Research on reasoning about sampling suggests that students tend to focus on individual samples instead of on a range of outcomes for repeated samples. For example, Shaughnessy (2007) suggested that students in a lolly task experiment experienced an internal struggle between the expected value for one sample and the range of outcomes for repeated samples. He proposed that students “should have a sense of the reasonable expected variability around the expected value, something like an intuitive confidence interval” (Shaughnessy, 2006, p. 87). Modeling A fundamental aspect of statistical inference involves using models for the comparison with empirical data. Several studies (e.g., delMas et al, 1999; Garfield, chance & Snell, 2000; Sedlmeier, 1999) indicated that engagement in carefully designed instructional activities using computer modeling and simulations of drawing many samples could help students to think about sampling as a process when making judgments involving samples. By using a probabilistic simulator, such as the one in TP2, young students have an opportunity to explore relationships between data and chance (Konold & Kazak, 2008). They can both learn about the sample data using data exploration tools and build a hypothetical probabilistic model of 2
the population from which the sample was taken. They can then examine the sample results in relation to this hypothetical model. In this study, we explore a possible path to the learning of these complex statistical ideas by exploiting new pedagogical “integrated approach” and new functionality in TP2 to create statistical models of phenomena. In the context of an investigation about music among teenagers, the students explore sampling distributions to understand the relationship between sample and population and the uncertainties involved in sampling, modeling and making inferences. 3. Method The research question Our paper will focus on the question: How can students express uncertainty while exploring sampling distribution in an “integrated approach”? In order to address this question, we use data of a pair of seventh grade students (aged 13) as they examine a sampling distribution using the sampler in TinkerPlot2. This study is part of the longitudinal design and research Connections Project (2005-2013) aiming to develop and study children’s statistical reasoning in an inquiry-based and technology-enhanced environment for learning statistics in grades 4– 9. A design research (Cobb et al., 2003) is used to study the development of students’ statistical reasoning and the characteristics of the learning environment that supports it. The “integrated approach” We developed an “integrated approach” to guide the design of the experimental student activities (as part of Manor’s PhD study). It is comprised of two theoretical structures that describe the relationship between sample and population: the “upward” and the “downward” perspectives. In the upward perspective, attention is paid to a sample or to a set of samples collected from an unknown population, perhaps through a random sampling process, in order to study a particular phenomenon in the population. In this perspective, we may be aware of the variability between samples, but might not necessarily account for probabilistic considerations, e.g., the chance variability that stems from the random sampling process. In the downward perspective, attention is paid to a probability distribution of a known (hypothetical) population and to a random process, which produces the outcomes of samples from this distribution. In this perspective, due to randomness, the details vary from sample to sample, but the variability is controlled. That is, given a certain distribution of the population, the likelihood of certain results can be estimated. Our hypothesis is that the “integrated approach” can support students’ development of reasoning about uncertainty when making ISIs by experimenting with transitions and building connections between the upward and downward perspectives. Participants This study involved a pair of students (grade 7, aged 13), Shay and Liron, in a private school in northern Israel, selected since they have high communication and thinking skills which provide a window to their statistical reasoning. They had already participated in two Connections experiments. In the fifth grade (age 11, 2010), they collected and investigated data about their peers using TinkerPlots1. Following the growing samples heuristic (Ben-Zvi, Aridor, Makar, & Bakker, 2012), the students were introduced gradually to sample of increasing sizes, in order to support their reasoning about ISI and sampling. In the sixth grade (age 12, 2011), they had engaged in both real world data investigations and model-based
3
investigations using TP2 chance devices in order to support their reasoning about ISI and sampling. The Setting In the current study, the learning trajectory (total of 10 2 3 hours, Table 1) encompassed four activities that first introduced the two perspectives separately. In the upward perspective, the students planned a statistical investigation. They chose a research theme, posed a question, formulated a hypothesis, and decided about the sampling method and sample size (Activity 1). In the downward perspective, they built a hypothetical TP2 model for the distribution of the population based on their research hypothesis (Activity 2). In order to encourage the students to examine the connections between the two perspectives, they were asked “what if” questions about optional real data results while they were exploring the sampling distribution (Activities 2 and 3). Finally (Activity 4), the students explored data and models using the two perspectives simultaneously by examining the real sample results in relation to their hypothetical model of the population. Table 1. The actual learning trajectory. Act. No.
1
2
3
Activity Title
Plan a research about teenagers: From a sample to population
Music among teenagers: From a population to samples
Cellular phones among teenagers: Exploring a hidden model with samples 4 Music among Teenagers: Exploring real sample data Total time (minutes):
Session Title
Session’s Themes
Statistical Ideas and Concepts
Preliminary Interview
What do you remember from the Connections project last year?
Session 1: Plan a research - part 1
Choose a research theme, pose research questions, choose population, sampling method and sample size. Formulate a hypothesis and express confidence level in the results.
A sample size to get significant conclusions about a population, and levels of confidence in results from that sample. Considerations in formulating a research question, choosing sampling method, random sampling, and sample size (absolute size vs. population percentage). Research hypothesis (verbal and visual expressions) and confidence level.
Session 2: Plan a research – part 1 Session 1: TP2 Model in - part 1 (the episode)
Build and run a TP2 model (no relationships between the attributes).
Session 2: Model in TP2 - part 2
Build and run a second TP2 model (with relationships between the attributes).
Session 3: Sampling distribution (The SRTL8 episode)
Build a third TP2 model and explore the sampling distribution.
Draw ISI by exploring samples of a hidden model.
Explore real sample data in relation to a sampling distribution and draw ISI.
Length (min) 40
09
099
A “simulated database of 30 cases model” for examining whether a sample size of half the population is similar to the population, level of certainty in the sample size. Level of certainty in sample size, sampling with and without replacement, sample size in relation to population size, sampling variability, representativeness. Sampling distribution, probability of sample results, range, mode, degree of inaccuracy, accept/reject interval of sample results, and informal hypothesis testing. The range (shows the possible inaccuracy of samples) and variability of the sampling distribution, sample size, and frequency of sample results.
09
As the population is bigger, a certain percentage of the population will be more similar to the population, and informal hypothesis testing.
60
09
90
80
640
4
4. Shay and Liron’s Learning Trajectory We focus on the students’ discussions during one episode of exploring sampling distributions. This episode took place during the third Session of Activity 2 (Table 1). In order to put this episode in context, we will briefly describe the entire learning trajectory. Preliminary interview In order to evaluate the students’ starting point, we interviewed them about what they remembered from their participation in the Connections project last year. During this interview the students discussed sample size needed to get significant conclusions about a population, and levels of confidence in results from that sample. While Shay argued that a big sample (bigger than 100) is required to infer significantly about a population of 600 students, Liron thought that a sample of 100 students (or 1 6 of the population) was sufficient. Shay explained that one can’t rely on small samples since repeated sampling would yield very different results, while the differences between larger samples would be smaller. They estimated accordingly their confidence level in a sample size of 1 6 of the population: Liron – 75% and Shay – 30%. They concluded the interview by disagreeing on the sample size needed for significant conclusions: Shay – at least 1 2 of the population and Liron – 1 3 to 1 2 . Activity 1. Learning about teenagers: from a sample to population In the first activity, we asked the students to plan a research on a subject that interests them and that concerned to teenagers. Session 1: Plan a research (part 1) Choose a research theme and pose research questions. Shay and Liron decided to study music practices and preferences among teenagers. They suggested seven research questions and discussed how to formulate them while raising practical considerations. For example, they discussed two optional formulations: “How much time do you listen to music each day?” or “How often do you listen to music?” Choose population, sampling method and sample size. While Liron was interested in studying the topic amongst seventh grade students in their school, Shay preferred a larger population made of seventh graders that were culturally similar. Liron, a guitar player, explained that knowing the music types favorite amongst his peers would direct him to play them and become more popular amongst his friends. In terms of sampling, Liron suggested taking a random sample of 15 children from every seventh grade class in their school (about half of the population). Shay offered to draw randomly 4–8 seventh grade classes from all the Israeli schools and to consider all the students in those classes. Shay argued, “Consideration of a sample size is not just the percentage you take from the population, but there is also importance to the quantity of the sample.” Ultimately, Shay and Liron decided to study the topic among seventh grade students within their school (about 120 students), take a random sample of equal number of children from each seventh grade class, but didn’t agree about the sample size. Session 2: Plan a research (part 2) Formulate hypothesis about the expected results of the research. Liron and Shay were asked to describe their hypothesis verbally and visually. They created bar graphs for one or two attributes according to their hypothesis. For example, they separately drew bar graphs of the favorite music types among seventh grade students in their school (Figs. 1a and 1b).
5
Figure 1a: Shay’s hypothesis regarding favorite music types among seventh grade students in the school.
Figure 1b: Liron’s hypotheses regarding favorite music types by gender (left) and musical instruments (right) among seventh grade students in the school.
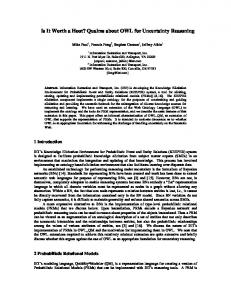
Express confidence level in the results of the research. In the end of this Session, Liron suggested that while they can draw conclusions for a sample size of half of the population, they could not be completely confident of the conclusions. Shay and Liron added that since they can enter data and draw a sample by using TinkerPlots, they can see what sample size they needed. Activity 2. Music among teenagers: From a population to samples Session 1: Model in TP2 (part 1) After a short introduction to modeling and simulation in daily life, we asked the students: “Imagine that you had the power to find out what characterizes the music listening habits of teenagers and had findings about all the seventh graders in your school: (i) How would the distribution of these findings look like? (ii) What would a random sample from this distribution look like?” Using the TP2 sampler, Shay and Liron built a model that included 6
seven attributes according to their hypotheses. They used the “stacks” device and added the “show count” option (Fig. 2).
Options
Fast +100
Rep... 15
gender
like_music
total 30
music_type
music_time
total 30
total 30
total 30
shows_time
Musical_instruments
play_time
total 30
total 30
12 15 15
15
10
13
29
10
12
Draw 7
9
10
8 5
4 3
2 1
1 male fema...
3
3
0 ... r... j... ... ...
like unlike
0 0 ... ... ... 1d ...
Mixer
Stacks
... 1y ... ... ...
Spinner
... ... ... ... ... ...
Bars
Curve
1y 2y 3y >...
Counter
Figure 2: Shay and Liron’s first model in TP2.
At this point, Shay had a clear plan on the method with which to use the TP2 sampler, while Liron was still trying to understand the meaning of the model they built (Fig. 2). Before they drew a random sample from this model, Shay explained that they had created a simulated database of 30 cases in order to examine whether a sample size of half the population would be similar to the population. They ran a sample of size 15 and compared the attributes of the sample to the database one at a time. When Shay found a discrepancy between the sample result and the database, he claimed the sample was not reliable. Liron wondered how the sampler would represent the relationship between two attributes (musical instrument and frequency of listening to music). Shay explained to him that there was no reason to expect a relationship between the attributes because they had not yet constructed a relationship model (Fig. 2) and the sampler had drawn the data randomly. Furthermore, Liron seemed to confuse between real data and simulated data. Having explored several attributes in the simulated sample, he argued that his hypotheses were correct. Shay disagreed: “It’s not true because we haven’t yet done the research. It is obvious that if we take a sample from our hypothesis [model], it will be similar to our hypothesis.” Liron agreed with a bit of embarrassment. Session 2: Model in TP2 (part 2) Shay and Liron started building a second TP2 model with 7 attributes and 30 cases, but this time they added relationships between attributes according to their hypotheses. After they had entered two attributes (gender and favorite music type) to the model (Fig. 3), Shay drew a random sample of size 15 (Fig. 4). They were surprised to observe that the sample (Fig. 4) had 13 girls and 2 boys although they had built the model with equal number of boys and girls (Fig. 3). After drawing another sample and getting again a similar result, they ran the sampler slowly and discovered that the sampler was drawing samples with replacement. Shay insisted on changing the method to sampling with no replacement. They then continued to draw more samples of size half of the population, while increasing the number of cases in the model. Shay assumed that “the bigger population is the relatively smaller is the sample size you have to take in order to learn about the population.”
7
Fig. 3: Shay and Liron’s second model with two interrelated attributes.
Fig. 4: A random sample of size 15 taken from the second model (Fig. 3).
Session 3: Sampling distribution (the SRTL8 episode) Exploring samples from the model. Shay and Liron finally decided to enter 120 cases to the model (identical to the real population size) and to examine whether a sample size of half the population would be similar to the model. In response to the researcher’s question, they said that in reality they intended to collect 40 to 60 cases (Liron) and 60 cases (Shay). They first drew a sample size 120 with no replacement (all the 120 cases of the model) in order to check if their model was compatible with their hypothesis. They then drew several random samples of size 70 from the model and explored the sample plot of favorite music type. In order to assess their level of certainty in samples of size 70, they compared those sample plots to the
8
population plot they had drawn before when trying to decide if they can learn from them about the hypothetical population. Exploring the sampling distribution. At this point, the researcher reminded Shay and Liron that there exists an option of simultaneously collecting data from many samples. They decided to collect 100 random samples and explored the sampling distribution of the statistic the percent of students whose favorite music is rock. They discussed what they had learned from the sampling distribution, how it had affected their confidence level in sample sizes 70 and 100, the interval of proportions they had agreed to accept as “correct results,” the interval of real results under which they would accept their hypothesis, and how confident they could be about this decision. They finally compared two sampling distributions (the percent of students whose favorite music is rock and rap) and continued to disagree on sample sizes they could trust. Activities 3 and 4 In the third activity, the students were asked to draw conclusions about research questions using a hidden model on the use of cellular phones among teenagers that had been created by another pair of students. They started by drawing samples size of 1000 (½ of the population) and gradually decreased the size of the samples in order to find the minimal sample size they trusted. They explored the sampling distribution of the percent of Smartphone users in several sample sizes and commented about small samples that “the sampling distribution graph was too distributed” (Shay), and “there was too much data in places far away from the center of the graph” (Liron). Shay added that “the range of the [sampling] distribution showed the possible inaccuracy. The more data is in a shorter range, the more chance that the sample is large enough.” In the last activity Shay and Liron explored the real sample data of size 60 (collected by them) with respect to the similarity to their hypothesis. The level of their confidence in the sample data changed between high (because the data were real) and law (it was only a sample), for example, Liron said “on the one hand it is real data, but on the other hand it is a sample.” At the end of this activity, in response to the researchers’ suggestion to using the sampling distribution, Liron has determined an interval of proportions he agreed to accept as “correct results.” Based on both the real sample results and this interval, he decided to accept his hypothesis. As for the results which fell outside the interval, he said that “If it’s a little far out of range, then that’s fine but it’s not really a conclusion” (Liron). Shay said that from the simulations he had learned that a sample size does not depend on a percentage of the population. “The bigger the population is the more similar to the population will be a certain percentage of the population.” (Shay). 5. Data collection and analysis All Activities were entirely videotaped and computer screens were captured simultaneously using Camtasia. A microgenetic method – interpretive micro-analysis (e.g., Meira 1998) – was used to analyze the data. It is a qualitative detailed analysis of the transcripts, which takes into account verbal, gestural, and symbolic actions within the situations in which they occurred. The goal of such an analysis was to infer students’ expressions of uncertainty as they explored the sampling distribution.
9
6. Brief summary of findings Shay and Liron’s expressions of uncertainty when exploring sampling distributions were molded by their deep interest in examining whether a sample size of half the population would be similar to the whole population. Shay’s expressions of uncertainty concerned the representativeness of a single sample and likelihood of sample results. In an attempt to control uncertainty, Shay quantified it and linked it to the probability to get a particular sample result. He eventually decided on the degree of inaccuracy he would accept, determined an interval of sample results he agreed to accept as the correct results and expressed the probability of getting this interval. Liron, who had concentrated on the mode of the sampling distribution, expressed a high level of certainty about the representativeness of a sample size ½ of the population. A researcher’s scaffolding helped him to describe levels of confidence in the different intervals of the sampling distribution. Eventually, he was able to articulate what was the interval of real results in which he would decide to accept his hypothesis and how confident he would be about this decision. 7. Expected contributions to SRTL8 Our selected video segments for SRTL8 are expected to provide fertile grounds for discussing students’ expressions of uncertainty: 1. How do students’ articulations of uncertainty emerge while they explore the sampling distribution? 2. What was the role of the “integrated approach” design in the emergence of students’ reasoning about uncertainty, and how it can be improved? 3. What was the role of TP2 in the shaping of students’ reasoning about uncertainty in relation to ISI? 4. What interventions can better help us trace students’ articulations of uncertainty? 8. References Ben-Zvi, D., Aridor, K., Makar, K., & Bakker, A. (2012). Students’ emergent articulations of uncertainty while making informal statistical inferences. ZDM – The International Journal on Mathematics Education, 44(7), 913-925. Ben-Zvi, D., Gil, E., & Apel, N. (2007, August). What is hidden beyond the data? Helping young students to reason and argue about some wider universe. Paper presented at SRTL-5, University of Warwick, UK. Cobb, P., Confrey, J., diSessa, A., Lehrer, R., & Schauble, L. (2003). Design experiments in educational research. Educational Researcher, 32(1), 9–13. delMas, R.C., Garfield, J., & Chance, B.L. (1999). Exploring the role of computer simulations in developing understanding of sampling distributions. Paper presented at the American Educational Research Association, Montreal. Garfield, J., & Ben-Zvi, D. (2008). Developing students’ statistical reasoning: connecting research and teaching practice. Emeryville, CA: Springer.
10
Garfield, J., Chance, B., & Snell, J.L. (2000). Technology in college statistics courses. In D. Holton et al. (Eds.), The teaching and learning of mathematics at university level: An ICMI study (pp. 357-370). Dordrecht, The Netherlands: Kluwer Academic Publishers. Kahneman, D., & Tversky, A. (1982). Variants of uncertainty. In D. Kahneman, P. Slovic and A. Tversky (eds.), Judgment under Uncertainty: Heuristics and biases (pp. 509–521). New York: Cambridge University Press. Konold, C. (1989). Informal conceptions of probability. Cognition and Instruction, 6(1), 5998. Konold, C., & Kazak, S. (2008). Reconnecting data and chance. Technology Innovations in Statistics Education, 2(1), Article 1. Konold, C., & Miller, C. (2011). TinkerPlots (Version 2.0) [Computer software]. Key Curriculum Press. Online: http://www.keypress.com/tinkerplots. Makar, K., & Rubin, A. (2009). A framework for thinking about informal statistical inference. Statistics Education Research Journal, 8(1), 82-105. Makar, K., Bakker, A., & Ben-Zvi, D. (2011). The reasoning behind informal statistical inference. Mathematical Thinking and Learning, 13(1&2), 152-173. Meira, L. (1998). Making sense of instructional devices: The emergence of transparency in mathematical activity. Journal for Research in Mathematics Education, 29(2), 121142. Moore, D. (2007). The basic practice of statistics (fourth ed.). New York: W. H. Freeman and Company. Moore, D. S. (1990). Uncertainty. In L.A. Steen (Eds.), On the shoulders of giants: New Approaches to numeracy (pp. 95-137). Washington, DC: National Academy Press. Pfannkuch, M., Wild, C., & Parsonage, R. (2012). A conceptual pathway to confidence intervals. ZDM – The International Journal on Mathematics Education, 44(7), 899911. Pratt, D., & Ainley, J. (2008). Introducing the special issue on informal inferential reasoning. Statistics Education Research Journal, 7(2), 3-4. Sedlmeier, P. (1999). Improving statistical reasoning: Theoretical models and practical implications. Mahwah, NJ: Lawrence Erlbaum. Shaughnessy, M. (2006). Research on students’ understanding of some big concepts in statistics. In G. Burrill (Ed.), Thinking and reasoning with data and chance: 68th NCTM Yearbook (pp.77-98). Reston, VA: NCTM. Shaughnessy, M. (2007). Research on statistics learning and reasoning. In F. Lester (Ed.), Second handbook of research on the teaching and learning of mathematics, (Vol. 2, pp. 957-1009). Charlotte, NC: Information Age Publishers. Thompson, P., Liu, Y., & Saldanha, L. (2007). Intricacies of statistical inference and teachers’ understandings of them. In M. Lovett and P. Shaw (Eds.), Thinking with data, (pp. 207-231). Mahwah, NJ: Lawrence Erlbaum. Tversky, A., & Kahneman, D. (1971). Belief in the law of small numbers. Psychological Bulletin, 76, 105-110. Tversky, A., & Kahneman, D. (1974). Judgment under uncertainty: Heuristics and biases. Science, 185, 1124-1131.
11