THPE029
Proceedings of IPAC’10, Kyoto, Japan
STUDIES OF INSERTION DEVICE MODELING ON TPS PROJECT H. C. Chao*, H. P. Chang, H. J. Tsai, and C. C. Kuo NSRRC, Hsinchu 30076, Taiwan, R. O. C. Abstract In this paper, the simulation techniques of insertion device (ID) are discussed. Piecewise hard-edge model is used to estimate the tune shift and changes of emittance and energy spread, while kick map model was used for particle tracking. Optical functions and tune shifts can also be derived by this model. Frequency maps as well as the beta-beating and its correction are demonstrated.
INTRODUCTION The Taiwan Photon Source (TPS) project is a 3-GeV third generation synchrotron light source located next to Taiwan Light Source (TLS) in NSRRC [1]. The civil construction was started at the beginning of 2010. It is expected to be in operation by the end of 2013. The TPS storage ring with 518.4-m circumference is formed by 24 periods DBA lattice. It has 24 straights including 6 12-m long straights and 18 7-m short straights. The basic parameters are listed in Table 1. The optical functions of one superperiod are shown in Fig. 1.
PIECEWISE HARD-EDGE MODEL Magnetic fields induced by IDs may alter many beam dynamics parameters such as betatron tunes, optical functions, emittance, betatron coupling, etc. For the estimation of tune shift and changes of emittance and energy spread, some analytic formulas have been discussed [2]. In practice, we can simulate the ID by a piecewise hard-edge model so that it can be implemented by some available programs such as MAD 8. In this model the property of edge focusing of dipole magnets is utilized. Each pole of the ID is equally divided into 5 smaller pieces of dipole magnets as shown in Fig. 2. The equivalent vertical focusing effect of ID can be simulated by elaborate arrangement of these smaller dipole magnets. The betatron tunes, emittance and energy spread with the presence of IDs can be derived directly from the results of the program. One should note the limitation that only the vertical field is applied in this model.
Table 1: TPS storage ring parameters 518.4 m 3.0 GeV 578.3 kHz 1729.2 ns 499.654 MHz 864 1.6 nm-rad 8.86E-04 2.4E-04 853 KeV 0.9977/1.00/2.0023 12.20/12.17/6.08 msec 26.18/13.28 -75/-26
B2
B2
Magnetic Field
Circumference Nominal energy Revolution frequency Revolution period RF frequency Harmonic number Natural emittance Energy Spread Momentum compaction Energy loss per turn Damping partition Damping time Betatron tune Natural chromaticity
B3
Bw
B1
B1
l=Lw/10
Lw/2
Figure 2: Hard-edge model of insertion device pole. Let Bw be the peak field and Lw be the period of the ID, the strengths of these dipoles have to fulfill the following conditions. Lw 2πs B L 2 2( B1l ) + 2( B2l ) + B3l = ∫ Bw sin( )ds = w w , 0 π Lw
2( B l ) + 2( B l ) + B l = ∫ 2 1
2 2
2 3
Lw 2
0
2
⎛ 2πs ⎞ B2 L ⎜⎜ Bw sin( ) ⎟⎟ ds = w w , 4 Lw ⎠ ⎝ 3
Figure 1: Optical functions of one superperiod.
___________________________________________
*
[email protected]
Lw 2πs ⎞ 2B3 L 2 ⎛ 2( B13l ) + 2( B23l ) + B33l = ∫ ⎜⎜ Bw sin( ) ⎟⎟ ds = w w 0 3π Lw ⎠ ⎝ The first equation shows that the deflection angle should be the same between this model and the real field. Similarly the second equation keeps the equality of the effect of edge focusing and radiation damping. The last equation ensures the equality of the amount of quantum excitation, which is useful for the estimation of the beam equilibrium emittance. An approximating solution for this hard-edge model is: B1 = 0.278Bw, B2 = 0.816Bw, and B3 =
05 Beam Dynamics and Electromagnetic Fields 4578
D01 Beam Optics - Lattices, Correction Schemes, Transport
Proceedings of IPAC’10, Kyoto, Japan
THPE029
13.4
−2
−3
0.01
−4
210
13.35
2ν = 7ν x+ y
x
6ν = 157
0.015
−5
0.005
T2m2
ν
y
3ν
x
0
+4 ν
y
−6 =
13
2
−7
−0.005
13.3 2ν x
+2
−0.01
−8
ν =
y
79
−0.015 6
−9
5
4
3
2
1
0
−1
−2
−3
−4
−5
y(mm)
70 80 50 60 30 40 10 20
0 −20−10 −40−30 −60−50 −80−70
−6
13.25 26.15
26.2
26.25
νx
26.3
−10
(a) Frequency map with SW60
x(mm)
(a) Horizontal kick map
13.4
−2
−3
0.02
−4
210
13.35
2ν = 7ν x+ y
x
6ν = 157
0.03
−5
y
3ν
ν
T2m2
0.01 x
0
+4 ν
y
−0.01
−6
=
13 2 −7
−0.02
13.3
+2 2ν x
−8
= νy
−0.03 6
79
5 4 3 2 1 0 −1 −2 −3 −4 −5
y(mm)
−6
0 −10 −20 −30 −40 −50 −60 −70 −80
10
20
30
40
50
60
70
−9
80
13.25 26.15
Figure 3: Kick maps for SW60.
Table 2: Tune shifts and emittance changes due to IDs Num of poles
0.38 1.14/0.5 1.0/0.77 4.2 0.76/0.49 0.84 1.4 1.14 3.5
280 100 70 48 46 22 15 18 60
31 88 64 30 97 92 67 250 8
Vertical tunes (υy) 13.279 13.283 13.310 13.284 13.296 13.282 13.281 13.281 13.285 13.283
26.3
−10
1 ∂Ψ ( x, y ) , 2 ∂x 1 ∂Ψ ( x, y ) My =− , 2 ∂y where the potential function Ψ can be derived from the integration of the magnetic fields Mx = −
Bw. One fourths of the peak field should be applied at first end poles and three fourths at the second end poles. Some results of the tune shifts and emittance changes caused by the proposed IDs are listed in the Table 2. In this table longer IDs such as U280 and EPU100 are at long straight center where βx = 10.2 m and βx = 6.1 m, while other IDs are put at the center of the first short straight center where βx = 5.5 m and βy = 1.65 m. In the case of EPU only vertical fields are considered.
Period (mm)
26.25
(b) Frequency map w/o SW60 Figure 4: Frequency maps.
x(mm)
Peak Field (By/Bx) (T)
ν
x
(b) Vertical kick map
ID name No ID U280 EPU100 EPU70 SW48 EPU46 IU22 SU15 CU18 SW60
26.2
ε0,nat (nm-rad) 1.592 1.584 1.600 1.590 2.276 1.585 1.599 1.599 1.598 1.709
KICK MAP MODEL In insertion devices, particles are tracked according to the kick map generated by P. Elleaume’s method [3]. Kick maps can be calculated by the program Radia developed by ESRF. The kick map is defined as
∞
2 ⎛ s Ψ ( x, y ) = ∫ ⎜⎜ ⎛⎜ ∫ B x ( x, y, s1 )ds1 ⎞⎟ ⎝ −∞ ⎠ − ∞⎝ 2 s ⎞ + ⎛⎜ ∫ B y ( x, y, s1 )ds1 ⎞⎟ ⎟⎟ds. ⎝ −∞ ⎠ ⎠
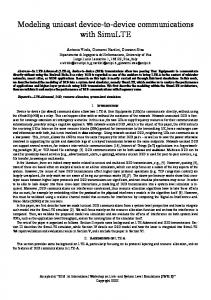
Typically one can save the computing time by taking the integral over only one period and then multiplying it by the period number. The real kick angles equal to Mx or My scaled by the inverse of square of the beam rigidity. As an example, the horizontal and vertical kick maps for SW60 are shown in Fig. 3. SW60, with strong field 3.5 Tesla, is a superconductor wiggler existing in TLS now. Fig. 4(a) shows the frequency map of TPS lattice with SW60. The diffusion rate is defined as
D = log10 ( Δν x2 + Δν y2 ) , where Δν is the tune difference between the first 1024 turns and the second 1024 turns. For comparison, the frequency map without ID, but with the same chamber limitation (±40 mm in horizontal and ±5.5 mm in vertical) is also shown in Fig. 4(b). One can observe that SW60 enhance the fourthorder resonance 2ν x + 2ν y = 79 . The tune shift effect estimated by kick map is consistent with the result calculated by the hard-edge
05 Beam Dynamics and Electromagnetic Fields D01 Beam Optics - Lattices, Correction Schemes, Transport
4579
Proceedings of IPAC’10, Kyoto, Japan
model. The tunes (Qx, Qy) obtained by the kick map method are (26.17993, 13.28255), while those by hardedge model are (26.17996, 13.28260).
BETA-BEATING CURE TPS is going to have some IDs in straight sections. Here we take 4 IU22s and 1 EPU46 as test IDs. In addition, 3.5 Tesla superconductor wigglers SW60 may be moved from TLS. IU22 is an in-vacuum undulator. The gap is 7 mm and total length is about 2 m. In general the beta-beating created by the IDs can be compensated by changing quadrupole settings, as well as the global tunes. All IDs are placed in short straights. The following figures show the beta-beating before and after correction. All quadrupoles are used for optics adjustment. The tuning strengths are determined by the response matrix analysis and SVD method. After optics correction, the variation of β functions can be controlled well within 2% except at the position of strong wigglers. The corresponding dynamic aperture is shown in Fig. 6. The horizontal dynamic aperture comes from the multipole fields of the ring, while the vertical one is from the limitation of the gap of IU22. 0.1
before correction after correction
polarized mode, there exists non-trivial horizontal focusing or defocusing effect which may cause horizontal tune shift. So it’s more accuracy to estimate the tune shift effect by the kick map method. The following figure shows the tune shifts caused by EPU46 with different phases. The phase varies from 0 to 23 mm with the gap fixed at 15 mm. When the phase is at 13 mm, the radiation is circularly polarized. We can observe that the increase of vertical tune always keeps at the same level, close to +0.0025. But the change of horizontal tune varies with different EPU phases. With the increase of EPU phase, the horizontal tune increases first and then decreases if the phase is greater then 13 mm. In horizontal-like mode it tends to increase, while in vertical-like mode it tends to decrease. In circular mode the horizontal tune shift is close to zero. 0.004
0.002 Tune shift ΔQ
THPE029
0
-0.002
-0.004
horizontal vertical
Δβx/βx
0.05 0
0 -0.05
100
200
300
400
10 15 EPU phase (mm)
20
25
Figure 7: Tune shifts caused by EPU46 with different phases.
-0.1 0
5
500
S (m) 0.1 IU22 IU22 IU22
Δβy/βy
0.05
IU22
2*SW60
CONCLUSTION
0
In summary, the basic simulation techniques for ID effects were established. Effects like tune shifts, emittance and energy spread changes can be predicted. Methods of particle tracking with ID and frequency map analysis are studied. Impact of test IDs is quite small and a preliminary linear optics correction can be achieved. More effects like coupling effect, higher order field effects and their compensation have simulated in the Touschek lifetime calculation [5].
-0.05 before correction after correction
-0.1 0
EPU46
100
200
300
400
500
S (m)
Figure 5: Beta-beating before and after correction. 10
−2
9
−3
8 −4 7
Y (mm)
REFERENCES
−5
6
5
−6
4
−7
3 −8 2 −9
1
0
0
5
10
15
20
25
−10
X (mm)
Figure 6: Dynamic aperture with test IDs.
EPU EFFECT All our proposed EPUs are APPLE-II type [4], which can change the polarization of radiation by shifting the magnet arrays. For EPU not operated in horizontally
[1] C. C. Kuo, et al, “Progress Report of TPS Lattice Design”, PAC 2009, WE5RFP006. [2] H. C. Chao, et al, “Beam Dynamics Effects with Insertion Devices for the Proposed 3 GeV Ring in Taiwan”,APAC 2007, TUPMA058. [3] P. Elleaume, “A New Approach to the Electron Beam Dynamics in Undulators and Wigglers”, EPAC 1992, p661. [4] S. Sasaki, “Analyses for a planar variably-polarizing undulator”, NIM A 347(1993), p83-86 [5] H.J. Tsai, et al, “Energy Acceptance and Touschek Lifetime Calculations for TPS Storage Ring”, this proceedings.
05 Beam Dynamics and Electromagnetic Fields 4580
D01 Beam Optics - Lattices, Correction Schemes, Transport