Available online at www.sciencedirect.com Available online at www.sciencedirect.com
Energy Procedia
Energy Procedia 00 (2011) 000–000
Energy Procedia 14 (2012) 689 – 694
www.elsevier.com/locate/procedia
Study of early dynamic evaluation methods in complex small fault-block reservoirs Wu Yahong1 Weng Xingfang2 Xu Mengya1 Guo Shengtao1 (1、Key Laboratory of Petroleum Engineering Education Ministry; China University of Petroleum (Beijing); Beijing City; 102249; China; 2、Sinopec International Exploration and Production Corporation;Beijing City;100083;China)
Abstract
Based on oil test and production test data of Sagizski complex small fault-block reservoir in Kazakhstan, this paper proposes systematic evaluation of reservoir dynamic characteristics and stable-development productivity equations, in view of reservoir early dynamic evaluation systems with oil test and production test materials. In association with dynamic production analysis, these paper studies convenient and feasible methods on the correction of calculation of bottom-hole pressure and test oil yield and determination of drive types of formation energy. In addition, this paper utilizes dynamic pressure data to more accurately estimate reserves, with the aim of providing a valid method for similar reservoirs early dynamic evaluation, which can effectively direct the setting of development programs and deployments. Key words: small fault-block;reservoir early evaluation;oil test;bottom-hole pressure;reserve estimate Introduction With increased exploration risks and costs, drilling workload can be substantially reduced and exploration benefits can greatly enhanced, if reservoir early oil test and production test data can be used to accurately assess reservoir statistics and determine productivity. Sagizski reservoir lies in the west of Kazakhstan, next to Caspian Sea. This area belongs to Mezhdurechenski tectonic zone in shore of Caspian Sea basin, and is a tectonic lithologic reservoir concerned with stratigraphic overlap and pinchout. The oil and gas reservoir with mesopore and medium pereability in salt canpoy anticline 、bottom and edge water of fault block. On the research work area of Sagizski complex small fault-block reservoir in Kazakhstan, this paper utilizes oil test and production test data to establish a set of method systems for early dynamic evaluation of complex small fault-block reservoirs, which provides accurate information and deployment basis for exploration in the next step. 1. Determination of reservoir early dynamic evaluation system Corresponding author: Wu Yahong. Tel.: +86-010-89731719. E-mail address:
[email protected].
1876-6102 © 2011 Published by Elsevier Ltd. Selection and/or peer-review under responsibility of the organizing committee of 2nd International Conference on Advances in Energy Engineering (ICAEE). Open access under CC BY-NC-ND license. doi:10.1016/j.egypro.2011.12.887
2690
Yahong et al.\ Procedia / Energy Procedia (2012) 689 – 694 WuWu Yahong/ Energy 00 (2011)14 000–000
1.1. Productivity well test analysis (1)Calculation of bottom-hole pressure from tubing pressure and casing pressure In the multi-phase vertical pipe flow, each fluid parameter and mixed density and flow velocity varies with pressure and temperature change, so pressure gradient along the pipe isn’t a constant, which is normally calculated with iteration methods, i.e., depth iteration and pressure iteration.With respect to single flow, single-phase flow exists in the pipeline when wellhead pressure is greater than bubble-point pressure, BHP equation [1] in vertical pipeline flow is used.
pwf = pH + p fr + pwh
(1)
Therefore, pH formula in single flow is: pH = ρl H = [ f w × ρ w + (1 − f w ) × ρ o ] × H (2) The last parameter Pf isn’t easy to determine, which can be obtained by calculating friction pressure from actual measurement of flowing pressure, and then calculating flowing pressure at other time with friction pressure. (2)Productivity estimate of stable development Well productivity is associated with k, h, μo, Δp and so on. Oil test production is a little different from stable production, difference varying with oil zone. The development practice also demonstrates that, even if they are in the same geological conditions, oil test production far larger than stable production, which indicates that stable production [2] can only be obtained by adjusting oil test production during practical procedures. According to equation (3), the right-hand formula can be considered to be a constant in some oil test method and oil condition, i.e., equation (4): r q = 2π (ln e − 0.75 + s)−1 Δp ⋅ kh / μ rw
(3)
⎡ ⎤ q ⎢ Δp ⋅ kh / μ ⎥ ⎣ ⎦d
(4)
⎡ ⎤ q /⎢ ⎥ =m ⎣ Δp ⋅ kh / μ ⎦ t
where, subscript d denotes production phase, t denotes test phase. If depth change and other aspects are considered in a development block, the following can be acquired: ⎡ q ⎤ ⎡ q ⎤ ⎢ Δp ⋅ h ⎥ = m1 ⎢ Δp ⋅ h ⎥ + m2 ⎣ ⎦d ⎣ ⎦t
(5)
1.2 .Reserve estimate (1)Material balance equation MBE can be established according to drive types, to estimate reservoir dynamic characteristics equation is as follows: Ns =
N P ρo _
[3]
. The (6)
( pi − p)Ct
(2)Modified volumetric approach This approach applies to all kinds of reservoirs, but the required reservoir static parameters have relatively large error, and drainage area can’t be accurately calculated in particular. The volumetric approach can be modified with the following method with dynamic pressure data.
3691
WuWu Yahong et al.\ / Energy Procedia 14 (2012) 689 – 694 Yahong/ Energy Procedia 00 (2011) 000–000
Single-well controlled reserve can be obtained in (7): (7) N = Ao × h × ρo × φ × Soi / Boi Considering different boundary shapes and oil well locations, when well is produced at the constant rate and becomes pseudo-steady-state flow, pressure performance can be used as follows [4]: 21.2qo μo Bo A (8) + 0.3513 + 0.868S P= Pwf + ln kh ρo C A rw 2 When oil well reaches PSS at the constant rate, if the well is shut in, the bottom-hole pressure changes with shut-in time as follows: 21.2q0 μ0 B0 k Δts (9) Pws = Pwf ( Δt =0) + lg + 0.868S kh ρo 123.5φμ0 So Ct rw2 When oil well is shut in, and bottom-hole pressure reaches formation pressure in the boundary range, (9) can get: 21.2q0 μ0 B0 k Δts (10) P= Pwf ( Δt =0) + + 0.868S lg 123.5φμ0 So Ct rw 2 kh ρo The subtraction of (8) and (10) can get: log
k Δts A + 0.3513 = log CA rw2 123.5φμo Ct So rw2
(11)
3.6 × 10 −3 C A k Δt s φμo Ct So
(12)
3.6 ×10⁻³ CA khΔts ρo μo Ct Bo
(13)
The solution is: Ao =
Substitute (12) in (7), OOIP equation is: N=
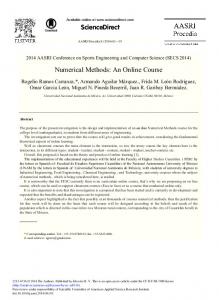
2 .Sagizski reservoir early evaluation This paper takes Sagizski reservoir A-1 well for instance, and presents a reservoir early evaluation. This well lies in some salt eaves structure in Kazakhstan, with developed main faults in the west. This two flanks are controlled by boundary faults. The oil-bearing series belongs to Triassic reservoir. In the early oil test phase, the well flows naturally for 14 days, with cumulative oil production of 546.9 m3 and cumulative water production of 17.89 m3, which shows a high-capacity reservoir, and exhibits very good exploration prospects. 2.1 Analysis of pressure build-up test From the pressure build-up well test of oil test layer at 1112~1120 m, and analysis of actual pressure loglog-derivative c2urves, we can find obviously that: well-bore storage effect is shown in the early-time region; radial flow occurs after 3 hours, and derivative curve goes up in the late-time region. In Fig. 1, pressure curve and derivative curve in LTR are not parallel, which indicates natural fractures are not developed. The interpretation demonstrates that, formation permeability is low, at 8.87 mD; with skin of 2.52, wellbore completion degree is low with some contamination; target reservoir is at normal pressure system, with the matched extrapolation pressure of 11.426 MPa; there’s plane difference in reservoir physical properties, with decreasing permeability, mobility ratio 1.66, and identical matched composite radius 16.6 m. Combining boundary effect which is shown from pressure derivative LTR, and structure
692
Wu Yahong et al.\ /Energy EnergyProcedia Procedia00 14(2011) (2012)000–000 689 – 694 Wu Yahong/
4
map, we can select 120。intersection faults to match, which shows that, the two faults are east-side fault f4 and south-side fault F1 respectively, with the least fault distance 50 m, in accordance with geological exploration result. The well’s west-side fault f5 parallels with f4, north-side geology pinchout forming trap, so the reservoir with the single well has diamond closed boundary. 10 3
Daily oil production(m )
0
1
20
40
60
80
100
120 140
160
Production pressure drop(MPa)
0 1
0.1
2
1E-3
0.01
0.1
1
10
3
100
4
Log-Log plot: dp and dp' [atm] vs dt [hr]
5
Fig. 1 log-log pressure-derivative match curves
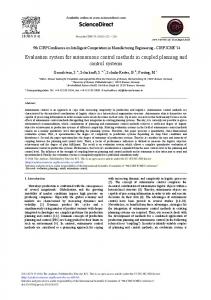
Fig. 2 IPR curve
2.2.Analysis of productivity test From A-1 well natural flow production, analyses of flowing pressure and flowing temperature gradient test results, we observe that, no degassing phenomenon occurs at 1, 1.6, 2 and 3 mm choke working routine, and it’s single-phase oil flow in the formation. As exhibited in Table 1, as working routine increases (choke size increases), BHP decreases, daily production augments, and IPR curve is mainly a straight line (Fig. 2), further confirming single-phase Darcy oil flow of producing fluid during system well test period. Table 1 Productivity data
1 2 3 4
Oil production / m3/d
Water cut /%
Mid-interval flowing pressure / MPa
Production pressure difference / MPa
PI / m3/dMPa
0.78 1.4596 3.2924 4.7236
29.31 38.36 26.08 31.50
1 22.86 1.2 10.388 1.6 55.99 1.4 9.7084 2 85.85 0.18 7.8756 3 148.8 0.12 6.4444 Regression of productivity equation is: = Q 31.15 × ( ΔP − 0.0504 )
(14)
10 9 8 7
Pfr / MPa
No.
Choke size /mm
6 5 4 3 2 1 0 0
1
2
3
4
Pw h / MPa
Fig. 3 IPR curve
Fig. 4 Friction pressure match curve
5
Wu Yahong Wu et al.\ / Energy Procedia 14 (2012) 689 –000–000 694 Yahong/ Energy Procedia 00 (2011)
693
With the plotted IPR curve (Fig. 3), the extrapolation reservoir pressure is 11.44 MPa. When BHP is less than 6.45 MPa, the straight line starts to bend, showing multi-phase flow will occur in this situation, which will influence single-well productivity. Consequently, the suggestion is to control BHP above 6.45 MPa while maintaining reservoir pressure during production. 2.3 Calculation of reduced flowing pressure with ground data With insufficient wellbore gas parameters, since the well is produced at pwf>6.45MPa (single-phase Darcy’s flow), we take the wellhead tubing pressure as the instance for study. The difficulty of this calculation rests with friction pressure Pf, so measured flowing pressure is used in turn to derive friction pressure, so as to match friction pressure equation (15): p fr = 6.5975 × ln( pwh ) − 0.1315 (15) Substitute measured flowing pressure in (15), we can get bottom-hole pressure pwf equation of A-1 well: pwf = pwh + [ f w × ρ w + (1 − f w ) × ρo ] × H + 6.5975 × ln( pwh ) − 0.1315 (16) It’s more accurate to use (16) to compute A-1 well single-phase BHP, with the relative error at ±1%, as in Table 2: Table 2 Data comparison Measured data
Calculated data Relative Mid-interval Mid-interval Friction Choke Flowing Water error/ % flowing flowing PH / MPa pressure/ MPa size/ mm pressure/MPa cut/ % pressure/ MPa pressure/ MPa 1 2.8 1.2 10.388 0.9440 6.6614 10.4054 0.17 1.6 2.6 1.4 9.7084 0.9443 6.1725 9.7168 0.09 2 2.1 0.18 7.8756 0.9422 4.7634 7.8057 0.89 3 1.8 0.12 6.4444 0.9421 3.7464 6.4885 0.68 Wellhead tubing pressures are 1.76 MPa and 1.8 MPa respectively, when two extreme water-cut values, 0 and 100% are respectively used to calculate BHP at 6.5 MPa, so wellhead pressure should be above 1.8 MPa during A-1 well production. 2.4. Stable development productivity estimate From the corrections of specific productivity index m=0.272 and stable-development productivity equation in formation tests, we can get: Q = 8.47 × (Δp − 0.0581) (17) The selected measured tubing pressure 2.3 MPa and flowing pressure 8.6055 MPa, and calculated oil production 21.21 m3/d, and measured production 19.969 m3/d, relative error 6.23%, can relatively accurately reflect productivity of A-1 well. 2.5 eserve estimate From above analyses, the reservoir with A-1 well is closed elastic-drive reservoir, with original static pressure 11.477 MPa at the oil interval of 1112-1120m, and cumulative oil production 546.9 m3 during formation test. After 50-hour shut in, the reservoir recovers to stable average reservoir pressure of 10.598 MPa from pressure build-up test static pressure measurement. The well has already produced at the constant rate for 320 hours before shut-in. Due to diamond supply outer boundary for the well, shape
5
694 6
WuYahong/ Yahong Energy et al.\ / Energy Procedia 14 000–000 (2012) 689 – 694 Wu Procedia 00 (2011)
factor of diamond boundary is CA=27.1. So with modified volumetric approach and material balance equation respectively, at the oil interval of 1112-1120 m, the formation test control reserve is: Table 3 Single-well control reserve results Applied approaches
Material balance equation
Modified volumetric approach
4
Reserve / 10 t 3.291 1.072 Through comparison, the reserve with modified volumetric approach is less than that of material balance equation, but both estimate approaches have solid theory basis, and are close to actual reserve, so the calculation results are fairly persuasive, which can act as significant basis for further rolling development. 3.Conclusions and Recommendations (1) The establishment of early dynamic evaluation approach of complex small-fault reservoir, with full reasonable oil test and production test data, can provide valid basis for reservoir development and deployment. (2) Development practice also demonstrates, formation test production is far larger than stable production, under the same geology condition. Target well stable productivity can be relatively accurately be computed through the correction of formation production; moreover, productivity estimate can also be obtained through the regression of multi-well data in different blocks. (3) Reduced bottom-hole pressure can be accurately calculated, with conveniently-measured in-situ wellhead tubing pressure, casing pressure and other ground data, convenient for oilfiled practical operations. (4) Estimate of single-well control reserve is a crucial issue. Required reservoir static parameters for volumetric approach calculation have much error, directly influencing the accuracy of reserve estimate. The reserve calculation by modified volumetric approach using dynamic pressure is less than that of material balance equation, but both approaches have solid theory basis, and are close to actual reserve, so their results are fairly persuasive, which can act as reference basis for development scheme adjustment. Nomenclature _
pi : static reservoir pressure, MPa; p : average reservoir pressure, MPa; pwf : bottom-hole following pressure, MPa; p fr : friction pressure, MPa; pwh : wellhead tubing pressure, MPa; pc :wellhead casing pressure, MPa; ρl : single-phase liquid density in tubing, kg/m3; ρo : average surface oil density, g/cm3; f w : water cut, %; H : well depth, m; N s : single-well control reserve, 104t; N : original oil in place, 104t; N p : cumulative oil production, m3 ; Ct : total compressibility, MPa-1 ; C A : shape factor; Δts : shut-in time, hr; Ao : drainage area, km2; h : average effective depth, m; φ : average effective porosity, %; S oi :average oil saturaiton, %; Boi :oil formation volume factor.
References [1] Zhang Qi. Production Engineering Principles and Design [M]. Dongying: China University of Petroleum Press, 2000. 24~33. [2] Fu Chunquan. Study of Proved Reserves Reservoir Engineering Evaluation Methods [D]. Daqing Petroleum College, 2003. [3] Guo Fenzhuan, Tang Hai and Lu Dongliang, et.al. The Relationship of Stable Reservoir Pressure with Water Cut [J]. Petroleum Drilling and Production Techniques, 2010,32 (2): 51~53. [4] Dong Xianzhang, and Chen Yuanqian. General Formula and Application Conditions in the Determination of Oil Well Control Reserve with Pressure Build-Up Curves [J]. ACTA PETROLEI SINICA, 1981, 2(1): 52~55.