comparing pairs of feature vector pattern so as to derive ... Index Termsâ LPC (Linear Predictive Coefficient), HMM ... In speaking, vowels are produced by exciting an essentially ..... Measuring the difference between two speech patterns in.
Study of Feature Extraction and Pattern Comparison Techniques for Speech Recognition Rohini B Shinde, Vrushsen P Pawar, Member IEEE
/8 Abstract—Presented paper deals with the fundamental problems of defining speech feature vector patterns and comparing pairs of feature vector pattern so as to derive measure of similarity between patterns. To solve the feature extraction problem different methods are used like MELCEPTRUM, LPC, HMM, DTW etc. To solve the pattern-comparison problem generally three algorithms are used like a speech-detection method, a spectral vector comparison method, and a global pattern comparison method. Index Terms— LPC (Linear Predictive Coefficient), HMM (Hidden Markov Model), DTW (Dynamic Time Wrapping),
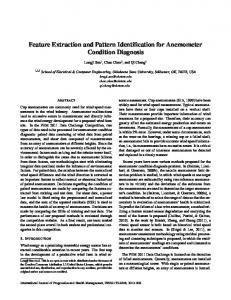
1. INTRODUCTION Recognition of speech by machine has been a goal of research for more than four decades. However for designing an intelligent machine that can recognize the spoken word & comprehend its meaning & the enormous research effort spent in trying to create such a machine. 2. SPEECH PRODUCTION PROCESS The speech production process begins when the talker formulates a messages a message he wants to transmit to the listener via speech. The next step is conversion of message into language code. Now the talker executes a series of neuromuscular commands to cause the vocal cords to vibrate when appropriate and to shape the vocal tract such that the proper sequence of speech sounds is created by producing an acoustic signal as the final output or speech.fig:1 illustrates the speech production process
Message Formulation
Text
Language Code
Phonemes
Articulatory Motion
Neuromuscular commands
Vocal tract System
Acoustic Wave form/ speech
Fig 1:The speech production process
representation of written text is very low, most practical speech recognition systems rely heavily on vowel recognition to achieve high performance. In speaking, vowels are produced by exciting an essentially fixed vocal tract shape with quasi-periodic pulses of air caused by the vibration of the vocal cord. The vowel sound produced is determined primarily by the position of the tongue, but the position of the jaw, lips, and to a small extant, the velum also influence the resulting sound. Fig.3. shows the schematic view of the human vocal mechanism.
3. ACOUSTIC PHONETIC FEATURES OF SOUND The number of linguistically distinct speech sounds in a language is often a matter of judgment and is not invariant to different linguists. In English language there are 48 sounds, including 18 vowels & diphthongs, 4 vowel-like consonants, 21 standard consonants, 4 syllabic sounds and a phoneme referred to as a glottal stop. Fig :2 illustrates the classification of the standard phonemes of English into broad sound classes. 3.1. Vowel features The vowels are perhaps the most interesting class of sounds in English. Their importance to the classification and
Rohini. B. Shinde is with the College of Computer Science & Information Technology Latur Maharashtra India (e-mail: rvmali007@ gmail.com). Dr. Vrushsen V. Pawar, is currently as a Associate Professor in CS Dept of with SRTM University, Nanded, Maharashtra India. He has recognized Ph. D Guide from University of Pune, S. R. T. M. University & Singhaniya University (India). He is senior IEEE member and other reputed society member.
Fig 3 :- Schematic View Of The Human Vocal Mechanism
The vowels are generally long in duration as compared to consonant sound and are spectrally well defined. These sounds are significantly contributed into speech recognition system. Following spectrogram illustrates the differences between the vowels.
phonemes
vowels
consonents
semivowels
diphthon gs ay -AY
front
nasals
[i-IY,I-IH,eEH,ᴂ-AE]
m(M)
ᴐy -OY stops
frictives
n(N)
whisper
affricaties
h-H
liquids
aw-AW
w-W
ey-EY
ᶴ-L
ᶯ(NG) mid
voiced
[a-AA
b-B
ᵌᵊ-ER
d-D
ᴧ-AH
g-G
AX,
voiced
glides r-R y-Y
unvoiced
ᴐ-AO]
unvoiced
back
p-P
[u-UW, U-UH, OOW]
t-T -K
Fig 2:- classification of the standard phonemes in English into broad classes
The unvoiced fricatives /f/, /θ/, /s/ and /sh/ are produced by exciting the vocal tract by a steady air flow, which become turbulent in the region of a constriction in the vocal tract. The spectral differences among the fricatives are readily seen by comparing the spectrogram. Fig. 6 indicate the wave format, spectrogram, formants & pitch point of a consonants.
Fig. 4: difference in Spectrogram of the /a/, /e/, /i/
3.2. Diphthongs features Although there is some ambiguity and disagreement as to what is not a diphthong, a reasonable definition is that a diphthongs is a gliding monosyllabic speech sound that starts at or near the articulatory position for one vowel and moves to or toward the position for another. According to this definition there are six diphthongs in English namely /ay/,/aw/,/ey/,/ᴐy/,/o/,/ju/. The diphthongs are produced by varying the vocal tract smoothly between vowel configurations appropriate to the diphthongs. 3.3. Semivowels Features The group of sounds consisting of /w/, /l/, /r/, and /y/ is quite difficult to characterize. These sounds are called semivowels because of their vowel like nature. They are generally characterized by a gliding transition in vocal tract area function between adjacent phonemes. 3.4. Nasal Consonants Features The nasal consonants /m/, /n/, and /ᶯ/ are produced with glottal excitation and the vocal tract totally constricted at some point along the oral passageway. The waveform of /m/ and /n/ look very similar. The spectrogram shows a concentration of low-frequency energy with a midrange of frequencies that contain no prominent peak point. 3.5. Unvoiced Fricatives Feature
Fig. 5: wave file & Spectrogram of the consonants
4. DIFFERENT FEATURE EXTRACTION METHODS. Feature extraction involves analysis of speech signal. Broadly the feature extraction techniques are classified as temporal analysis and spectral analysis technique. In temporal analysis the speech waveform itself is used for analysis. In spectral analysis spectral representation of speech signal is used for analysis. 4.1 Spectral Analysis techniques 4.1.1 Critical Band Filter Bank Analysis It is one of the most fundamental concepts in speech processing. It can be regarded as crude model of the initial stages of transduction in human auditory system. Critical bank filter bank is simply bank of linear phase FIR bandpass filters that are arranged linearly along the Bark (or mel) scale. The bandwidths are chosen to be equal to a critical bandwidth for corresponding center frequency. Bark i.e. critical band rate scale and mel scale are perceptual frequency scale defined as Bark = 13atan(0.76f /1000) + 3.5atan( f 2/(7500)2) (1)
mel frequency = 2595log10(1 + f /700)
(2)
An expression for critical bandwidth is BWcritical = 25 + 75[1 + 1.4(f /1000)2 ]0.69
(3)
linear time-varying system representing vocal tract. A very important LPC parameter set which is derived directly from LPC coefficients is LPC Cepstral coefficients cm. The recursion used for this is m 1
4.1.2 Cepstral Analysis Cepstrum is computed by taking inverse discrete Fourier transform (IDFT) of logarithm of magnitude of discrete Fourier transform finite length input signal as shown in fig.5
Fig. 5. System for obtaining cepstrum
N 1
S n (1/ N ) s k exp j 2 / N nk
(4)
k 0
(n) is defined as cepstrum. In speech recognition cepstral analysis is used for formant tracking and pitch (f0 ) detection. The samples of (n) in its first 3ms describe v(n) and can be separated from the excitation. The later is viewed as voiced if (n) exhibits sharp periodic pulses. Then the interval between these pulses is considered as pitch period. If no such structure is visible in (n), the speech is considered unvoiced.
cm k / m ckam k
m>p
(7)
k 1
This method is efficient, as it does not require explicit Cepstral computation. Hence combines decorrelating property of cepstrum with computational efficiency of LPC analysis. 4.2Temporal Analysis It involves processing of the waveform of speech signal directly. It involves less computation compared to spectral analysis but limited to simple speech parameters, e.g. power and periodicity. 4.2.1 Power Estimation The use of some sort of power measures in speech recognition is fairly standard today. Power is rather simple to compute. It is computed on frame by frame basis as Ns 1
4.1.3 Mel Cepstrum Analysis
P n (1/ Ns ) ( w m s(n Ns / 2 m )) I(8)
This analysis technique uses cepstrum with a nonlinear frequency axis following mel scale. For obtaining mel cepstrum the speech waveform s(n) is first windowed with analysis window w(n) and then its DFT S(k) is computed. The magnitude of S(k) is then weighted by a series of mel filter frequency responses whose center frequencies and bandwidth roughly match those of auditory critical band filters. The next step in determining the mel cepstrum is shown below
Where Ns is the number of samples used to compute the power, s(n) denotes the signal, w(m) denotes the window function, and the ,and n denotes the sample index of center of the window. In most speech recognition system Hamming window is almost exclusively used. Rather than using power directly in speech recognition systems use the logarithm of power multiplied by 10, defined as the power in decibels, in an effort to emulate logarithmic response of human auditory system. It is calculated as
m 0
U1
Emel n, l (1/ Al )
|Vl k S k | 2
(5)
Power in dB = 10 log10(P(n)) (45)
(9)
k L1
Where Ul and Ll are upper and lower frequency indices over which each filter is nonzero and Al is the energy of filter which normalizes the filter according to their varying bandwidths so as to give equal energy for flat spectrum. The real cepstrum associated with Emel(n,l) is referred as the mel-cepstrum and is computed for the speech frame at time n as N 1 (6) Cmel n, m (1 / N ) log{Emel n, l }cos [2 l 1 / 2 / N ]
The major significance of P(n) is that it provides basis for distinguishing voiced speech segments from unvoiced speech segments. The values of P(n) for the unvoiced segments are significantly smaller than that for voiced segments. The power can be used to locate approximately the time at which voiced speech becomes unvoiced and vice versa. 4.2.2 Fundamental Frequency Estimation
l 0
Such mel cepstral coefficients Cmel provide alternative representation for speech spectra which exploits auditory principles as well as decorrelating property of cepstrum. 4.1.4 Linear Predictive Coding (LPC) Analysis The basic idea behind the linear predictive coding (LPC) analysis is that a speech sample can be approximated as linear combination of past speech samples. By minimizing the sum of the squared differences (over a finite interval) between the actual speech samples and the linearly predicted ones, a unique set of predictor coefficients is determined. Speech is modeled as the output of linear, time-varying system excited by either quasi-periodic pulses (during voiced speech), or random noise (during unvoiced speech). The linear prediction method provides a robust, reliable, and accurate method for estimating the parameters that characterize the
Fundamental Frequency (f0) or pitch is defined as the frequency at which the vocal cords vibrate during a voiced sound. Fundamental frequency has long been difficult parameter to reliably estimate from the speech signal. Previously it was neglected for number of reasons, including large computational burden required for accurate estimation, the concern that unreliable estimation would be a barrier to achieving high performance, and difficulty in characterizing complex interactions between f0 and super segmental phenomenon. It is useful in speech recognition of tonal languages (e.g. Chinese) and languages that have some tonal components (e.g. Japanese). Fundamental frequency is often processed on logarithmic scale, rather than a linear scale to match the resolution of human auditory system. There are various algorithms to estimate f0 we will consider two widely used algorithms: Gold and Rabiner algorithm, cepstrum based pitch determination algorithm.
Here in this case we can get the feature vector depending on the pitch like at the specific time interval with the hamming window as follows. Table 1 shows the pitch values obtained from the speech. These are used as a feature vector for further analysis in speech recognition system
A horizontal line Fig 6. Wave form of a speech & a horizontal line indicate the pitch point from that speech
Time_s
F0_Hz
0.036587
424.3366
0.046587
423.2797
0.056587
383.0666
0.066587
364.5644
interest in speech recognition system. We define a test pattern T as the concatenation of spectral frames over the duration of speech. Such that T={t1,t2,t3,…….tl} (10) Where ti is the spectral vector of the input speech at time i & l is the total number of frames of speech. In a similar manner we define a set of reference patterns, {R1,R2,R3,…..Rv} where each reference pattern, Rj,1≤ j ≤ v in order to identify the reference pattern that has the minimum dissimilarity, and to associate the spoken input with this pattern. There are various techniques exist for pattern comparison in speech recognition system. 5.1 Distortion Measures 5.1.1 Mathematical considerations A key component of most pattern-comparison algorithm is a prescribed measurement of dissimilarity between two feature vectors. This measurement of dissimilarity can be handled with mathematical rigor if the pattern are visualized in a vector space. Assume we have two feature vectors x,y defined on a vector space χ. We define a metric or distance function d on the vector space χ as a real-valued function on the Cartesian product χ x χ such that 0≤d(x,y)