TELKOMNIKA, Vol. 11, No. 6, June 2013, pp. 2942 ~ 2947 e-ISSN: 2087-278X
2942
Study on BSS Algorithm used on Fault Diagnosis of Gearbox 1,2
Yu Chen*1, Jintao Meng2 Zhengzhou Institute of Aeronautical Industry Management, Zhengzhou, China, 450015 *Corresponding author, e-mail:
[email protected]
Abstract The gearbox is a complicated rotating machinery equipment, in order to realize the gearbox fault early detection and prevention, it is the key to carry out the online diagnosis. This paper used the adaptive variable step-length natural gradient blind source separation algorithm to realize the helicopter gearbox meshing vibration signal and fault vibration signal effective separation. Through the algorithm simulation, the accuracy of the algorithm gained the verification and the separation error trended to zero, which has higher separation precision. This algorithm can realize the complicated mechanical vibration signal blind source separation and fault diagnosis, which has a broad application prospect. Keywords: gearbox vibration signal, fault diagnosis, variable step length, natural gradient Copyright © 2013 Universitas Ahmad Dahlan. All rights reserved.
1. Introduction The gearbox acts as the main mechanical transmission equipment, which is widely used in the modern metallurgy, chemical industry, power and other industrial fields. For the gearbox fault diagnosis is concerned, the most fundamental mission is to identify the state of the gearbox through the gearbox observation signal analysis and processing [1]. To a certain extent, the gearbox fault diagnosis method is to monitor the gearbox state identification. In terms of generalization, the gearbox diagnosis is to early diagnosis, to carry out the fault analysis, and to take the corresponding measures. Before the gearbox producing fault, we should possibly predict the fault of the parts and components, and find out the cause of the fault and ensure the gearbox in safe and stable operation of the conditions. During the fault occurs, we can quickly analysis the fault causes, judge the fault location, timely on maintenance. This paper taken the gearbox fault as an example, used a kind of adaptive variable step-length natural gradient algorithm to the gearbox vibration signal separation, and adopted the spectrum analysis to complete the fault diagnosis [2]. This method is superior to the traditional signal processing method such as FFT [3], and can realize the signal processing under the circumstance out of prior knowledge.
2. The Gearbox Fault Mechanism and Diagnosis The gearbox fault forms have many types, in general they can be divided into two categories. 2.1. Initial Manufacturing and Install Mistakes Fault One kind is due to the initial manufacturing process or install mistakes, this kind of fault often present as a tooth cylindrical and bore different heart and gear mesh of the tooth profile error and axis asymmetry, etc. The gearbox assembly undeserved can cause serious mechanical loss [4]. When the gearbox error is bigger, which can lead to the gearbox transmission in the high-low speed in the rotation and the meshing impact can cause the larger vibration and noise. 2.2. Long-time Running Fault The second fault is caused during the gearbox in the long running process. Due to the gearbox surface under the high load, at the same time, the force of relative sliding and rolling
Received January 23, 2013; Revised March 30, 2013; Accepted April 7, 2013
TELK KOMNIKA
e-ISSN: 2087-2 278X
2943
exist among the pitch p tooth, and a the relative sliding fric ction effect on o both sidess of the pole in the opposite direction n, thus, the ripple phen nomenon willl produce. In I a long tim me of mechanical opera ation, it will directly lead d to the tootth surface wear, w gluing,, root crack or break in tooth phenomenon. In the gea arbox of mecchanical com mponents, the e shaft is alsso very easy to cause the e fault. When n there is a big load im mpact upon the shaft, itt will make the shaft ca ause the be ending deforrmation, whicch directly le ead to the gearbox g faultt. In the gea arbox fault diagnosis res search proce ess, we foun nd that the different bend ding degree can bring different fault influence de egree, also with w differentt fault characcteristics. So o, the shaft bending can posit p seriouss bending and mild bending. The sha aft with the serious s imballance will lea ad to fault [3 3]. The gearb box fault diag gnosis techn nology is devvelopment with w the scien nce and tech hnology prog gress, and th he integration with the latest scienttific technolo ogical achievvements is the gearbo ox fault diag gnosis techn nology chara acteristics, an nd the future e developmen nt direction. 2.3. Fault F Diagno osis Method d The signa al analysis and a processing method used in the gearbox condition monitoring and fault f diagnossis has gaine ed a great de evelopment. The tradition nal analysis methods, su uch as the time domain waveform an nalysis, etc has h greatly improve i and d development in the pre ecision and speed s in rece ent years. Some more new n signal prrocessing me ethod also g got great prog gress, such as the wave elet analysiss, etc. The diagnostic me ethods has increasingly diversified. So S far the fa ault diagnossis technolog gy developm ment with the e vibration diagnosis d me ethod increa asingly mature, the new method is widely w used in the gearb box fault diagnosis, the scope of the e fault diagn nosis method ds had been more and more spread [5]. This pap per used the e blind sourrce separation method, which realized the ge earbox vibrattion signal blind b source separation, s a through the signal spectrum and s ana alysis, find out o the fault cause. c
3. Na atural Gradie ent Blind Se eparation Allgorithm In the tra aditional natu ural gradientt blind sourc ce separation n algorithm, we first cho oice m numb bers of signa al source and d sensors, th he relationsh hip between the measuring signal an nd the sourcce signal is shown s as follo owing formula (1).
X AS N
(1)
A Among the fo ormula (1), The T observattion signal X is the instan ntaneous line ear mixed sta ack by n num mbers of un nknown sourcce signals S, S the mixed d stack matriix A is m n unknown mixed matrixx. N is m d additive a obse ervation noise e. The principle diagram is shown as Figure 1 [6].
Fig gure 1. Princciple Frame Diagram D of IC CA.
Throu ugh some kin nd of study algorithm, a we e can get sep paration matrrix W and ob btain formula (2).
Y WX
(3)
Studyy on BSS Alg gorithm used d on Fault Dia agnosis of G Gearbox (Yu Chen)
2944
e-ISSN: 2087-278X
Among formula (2), Y is n×1 d estimation signal vector, if global matrix G=WA=I (I is n× n d unit matrix), then Y S , so as to achieve the goal of source signal recovery. The natural gradient algorithm is earliest proposed by Amari, Cichoki, etc, which is based on the blind source separation [7], he is based on the Mutual Information (MI) method, and the cost function is as formula (3).
J (t )
n 1 log | det(W T W ) | log p i ( y i ( t )) 2 i 1
(3)
Among the formula (3), pi ( yi (t )) is the probability density function of yi ( t ) . According to the formula (4), we renew the separation matrix W [8].
W (t 1) W (t ) (t 1)( I f ( y (t )) y T (t ))W (t )
(4)
From the formula (4) we can see, the role of step length u is to control the separation matrix elements amplitude of the iteration updating, therefore, appropriately choosing the step length is very important to the algorithm performance. Any treatment objective of the timevarying step length is increasing the step length to a big and stable value, which can reach the fastest convergence. When entering the neighborhood of the best convergence point, the step length should be corresponding decreased so as to reduce the static error. It can be concluded that, the so-called convergence actually means the separation matrix W has convergence in a steady-state neighborhood, and not a fixed value [9]. For the steps of a fixed value, it certainly limit the algorithm convergence speed and the emergence of steady-state imbalance, which produce convergence speed and the contradiction between the steady state performance: the step length is small, the algorithm of the steady-state performance is good, but the algorithm convergence speed is slow; conversely, the convergence speed is fast, the steady state performance is poor. So that the tracking performance of algorithm will lose effectiveness in non-stable environment . In the choice of step length, we use the following formula (6) to update step length [10].
u ( t 1) u ( t )
J ( t 1)) u (t )
(5)
>0, which is a little constant. We introduce the definition of matrix inner product, D, E trace( DE T ) trace( DT E ) , , expresses the inner product of matrix, trace() is the trace of matrix, D and E respectively is m n d matrix, because the Among the formula (6),
complexity of the infinitesimal calculus, we can use the definition of inner product. We can get the formula (6).
J ( t 1) J ( t 1) y ( t 1) , u (t ) y ( t 1) u (t ) J ( t 1) y ( t 1) T trace [ [ ] ] y ( t 1) u ( t )
(6)
And from the formula (3) and (6), we can get the formula (7).
J ( t 1) f ( y ( t 1)) y ( t 1)
(7)
And from the formula (2) and (4), we can get the formula (8) [11]. y ( t 1) W ( t 1) x ( t 1)
{W ( t ) ( t 1)( I f ( y ( t )) y T ( t ))W ( t )} x ( t 1)
TELKOMNIKA Vol. 11, No. 6, June 2013 : 2942 – 2947
(8)
TELK KOMNIKA
2945
e-ISSN: 2087-2 278X
J ( t 1)) [ I f ( y ( t )) y T ( t )]W ( t ) x ( t 1) u (t )
(9)
And we w can get th he formula (1 10) from the formula (7) and a (9). J ( t 1)) tr a c e { f ( y ( t 1)) x T ( t 1)W u (t )
T
( t )[ I y ( t ) f
T
( y ( t ))]
(10)
The step s length algorithm a is shown s as form mula (11) [12 2].
u (t 1) u (t ) traace{ f ( y (t 1)) x T (t 1)W T (t )[ I y (t ) f T ( y (t ))]}
(11)
4. Th he Gearbox Vibration V Signal Blind Separation S Simulation S We used the simulattion tool of MATLAB M to carry c out the e the gearbo ox vibration signal separration. The vibration v sign nal frequenccy of the mes shing gear iss 800Hz, the e gearbox ro otating speed d is 1000r/m min, and the e rotating co omponent fau ult frequencyy is 200Hz. The wavefo orm is show wn as Figure 2.
Figure 2. 2 The Sourc ce Signal
After the blind mixing the gear me eshing vibratiion signal an nd fault vibrattion signal, th he al is shown as a the Figure 3. obserrvation signa
Figure 3. The T Observa ation Signal
The tradittional vibratio on signal pro ocessing metthod is to dire ectly extract and diagnos sis the fault information of the obserrvation signa al. Because the characte eristics of the e vibration source s
Studyy on BSS Alg gorithm used d on Fault Dia agnosis of G Gearbox (Yu Chen)
2946
e--ISSN: 2087-278X
signa al in the sen nsor acquisittion during the t mutual mixed m or various nonline ear distortion, the noise e is big, and the t transmisssion channe el is complex, often can not n obtain the e very good effect. e Frequ uency diagra am is shown as Figure 4.
Bear fau ult frequency Noise e and other mixing frequency, etc e
Gearr fault frequency y and times freq quency Bear fault frequ uency Noise an nd other mixing noise frequency, etc
T Power Spectrum S of the t Observation Signal Figure 4. The
By using the e adaptive variable v step length natu ural gradient separation a algorithm, we w can get each source mixing m signal, which is sh hown as the Figure 5.
T Waveform Diagram of o the Separa ation Signal Figure 5. The
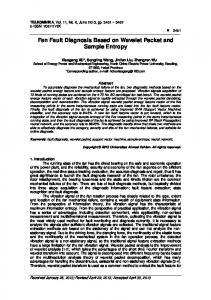
T power sp The pectrum [10] diagram is shown s as the e Figure 6.
Bear faultt frequency
Gear meshing frequ uency
T Two times of gear meshing freq quency Three tim mes of gear messhing frequency y
Figure 6. The Power Spectrum off the Separattion Signal KOMNIKA Vol. V 11, No. 6, 6 June 2013 3 : 2942 – 29 947 TELK
TELKOMNIKA
e-ISSN: 2087-278X
2947
From the Figure 6 we can see, the separate signal power spectrum is approximate to the source signal power spectrum. The bearing fault frequency 200Hz, the gear meshing frequency 800Hz, and the 2 times, 3 times harmonic frequency can be separated, which is well reflected as the signal spectrum chart. And if we used the Fast ICA blind source separation, the separation result is basic same as the natural gradient variable step-length algorithm this paper used, but because the Fast ICA algorithm is a kind of batch algorithm, and it can not realize signal online separation. This algorithm can realize online blind source separation, and it can help to realize the mechanical equipment fault early finding and fault debugging.
5. Conclusion This paper studied a kind of adaptive variable step length natural gradient algorithm. Through the experimental analysis, this method can better separate the gearbox dynamic signal, by researching the separation signal spectrum, the gear box fault diagnosis is realized. In the further, the more effective method will be presented to complete mechanical fault type diagnosis.
Acknowledgments This paper is supported by Youth Scientific Research Fund Project of Zhengzhou Institute of Aeronautical Industry Management (No.2012133001) and Henan Province Sciences and Technology Development Plan Project (No.132102210477).
References [1]
Ni An, Xu Jianmin. Fault diagnosis and analysis of vibration of gearbox. Journal Wuhan Inst. Tech. 2011; 33(12): 70-72. [2] Jiaxin Yang, Yunguang Qi , Zhaozhong Cai. Gearbox fault diagnosis technology present situation and the development tendency. Mechanical and Electrical Information. 2011; (36): 133-134. [3] Ping-an Shi, Jia-wei Ye. Measured Data Processing Method for Relative Motions between Two Sideby-side Ships. TELKOMNIKA Indonesian Journal of Electrical Engineering. 2013; 11(1): 73-82. [4] Xuexia Liu. Study on Knowledge based Intelligent Fault Diagnosis of Hydraulic System. TELKOMNIKA Indonesian Journal of Electrical Engineering. 2012; 10(8): 2041-2046. [5] Xuegui Xu, Wenqin Xu. Vibration Mechanism and Fault Signature of Gear Case. Machine Building & Automation. 2012; 41(4): 74-77. [6] Kang Ding, Xiaoyong Zhu. Gear and Gearbox Fault Diagnosis Practice Technology. Beijing: Mechanical Industry Press. 2006:1-40. [7] Ying Gao, Yue Li, Baojun Yang. Overview on variable step size techniques for on-line blind source separation. Computer Engineering and Applications. 2007; 43(19): 75- 79. [8] Amar IS, Cichocki A. Adaptive Blind Signal Processing Neural Network Approaches. Pr oceedings of the IEEE. 1998; 86(10): 2026-2048. [9] Almeida LB. The fractional Fourier transforms and time frequency representations. IEEE Trans. on SP. 1994; 42(11): 3084-3091. [10] Guangbiiao Li, Jianyun Zhang. Adaptive step-size EASI algorithm based on separating matrix. Ship Science and Technology. 2006; 28(5): 69-72. [11] Zhucheng Li, Liyi Zhang. A New Adaptive Step size Algorithm for Blind Source Separation. Modern Electronic Technology. 2005; 28(24): 96-98. [12] Xiaohu Li, Minping Jia, Feiyun Xu. The application of Spectrum analysis to the gearbox fault diagnosis. Journal of Vibration, Measurement & Diagnosis. 2003; 23(3): 168-170.
Study on BSS Algorithm used on Fault Diagnosis of Gearbox (Yu Chen)