Apr 20, 2015 - In the case of net metering, the grid is artificially used as storage for the ...... DG connection is sized at planning stage to withstand worst case ...... variable RES and consumption, and dual pricing for conventional generation.
Insights. Delivered.
Study on the effective integration of Distributed Energy Resources for providing flexibility to the electricity system Final report to The European Commission 20 April 2015 Proj no: 54697590000
Study on the effective integration of Distributed Energy Resources for providing flexibility to the electricity system
Disclaimer This document has been prepared for the European Commission however it reflects the views only of the authors, and the Commission cannot be held responsible for any use which may be made of the information contained therein.
20 April 2015
2 A report to The European Commission
Study on the effective integration of Distributed Energy Resources for providing flexibility to the electricity system
Acknowledgement The work is a result of the contribution of several organizations, and more importantly the people behind those organisations. The work has been followed by a steering committee consisting of representatives of the European Commission and CEER. During the study interviews with several industry association and market participants including CEDEC, ENTSO-E, EFET, EDF, Eurelectric, Eurogas, GDF SUEZ, GEODE, Ngenic and SEAM. SEAM was one of several aggregators suggested to by SEDC for interviews. We are very grateful for all the valuable comments and suggestions received from the steering committee and the consulted organisations. Any remaining errors or omissions are the sole responsibility of the analysis team.
20 April 2015
3 A report to The European Commission
Study on the effective integration of Distributed Energy Resources for providing flexibility to the electricity system
(left blank)
20 April 2015
4 A report to The European Commission
Study on the effective integration of Distributed Energy Resources for providing flexibility to the electricity system
Table of Contents Foreword
9
List of acronyms
10
Executive Summary
11
1
17
Introduction
1.1
Background
17
1.2
Flexibility
18
1.3
Distributed Energy Resources
18
1.4
A policy framework
19
1.5
Scope and outline of the report
22
Demand for flexibility from new sources
23
2 2.1
Global flexibility gap
23
2.2
Local flexibility gap
31
3 3.1
2.2.1
Voltage problems
32
2.2.2
Reverse power flows
32
2.2.3
Congestions
33
2.2.4
Grid losses
33
2.2.5
Case studies
34
Flexibility value streams Regulated beneficiaries 3.1.1
3.2
4
39 40
System level
43
Unregulated beneficiaries
48
3.2.1
Local level
48
3.2.2
Global level
49
Market value of flexibility
51
4.1
Price volatility in the day-ahead market
51
4.2
Price on the day-ahead and intraday market varies
57
4.3
Intraday market prices revealing the value of flexibility
58
5 5.1
DER provision of flexibility
64
Demand Response and electrification of heat sector
64
5.1.1
Demand management in industrial installations
65
5.1.2
Demand management in the commercial and residential sector
65
5.1.3
Prosumers
67
5.1.4
Power to Heat
67
20 April 2015
5 A report to The European Commission
Study on the effective integration of Distributed Energy Resources for providing flexibility to the electricity system
5.2
5.3
Distributed Generation
68
5.2.1
Flexibility in biogas power plants
68
5.2.2
Flexibility in combined heat and power (CHP)
68
5.2.3
Flexibility from variable renewable energy sources
69
Distributed storage
70
5.3.1
Pumped hydro storage
71
5.3.2
Compressed Air Energy Storage
71
5.3.3
Flywheels
72
5.3.4
Batteries
72
5.3.5
Power to Gas
72
5.4
Batteries of electric vehicles (EV)
73
5.5
Role of enabling ICT and communication infrastructure
74
5.6
Sources of value for DER flexibility
74
5.7
Cost effectiveness of DER
78
6 6.1
6.2
5.7.1
Cost structure of DER
78
5.7.2
Key drivers affecting DER cost-effectiveness
79
5.7.3
Drivers impacts on cost effectiveness of DER
82
5.7.4
Cost effectiveness of DER flexibility – Main messages
87
Linking supply and demand of flexibility – the value chains
89
Different trading arrangements related to flexibility
89
6.1.1
Time horizons
89
6.1.2
Arrangements for acquiring resources
91
Existing market places – a brief overview
93
6.2.1
Difference between capacity and energy remuneration mechanisms 94
6.2.2
Capacity remuneration
94
6.2.3
Future and forwards markets
95
6.2.1
Day-ahead market
95
6.2.2
Intraday market
96
6.2.3
Balancing markets
96
6.3
Regulated markets
6.4
Unregulated markets
104
6.5
Imbalance responsibility and imbalance settlement
110
7 7.1
96
6.5.1
Imbalance responsibility for RES
110
6.5.2
Imbalance settlement
111
Roles and relations in the market
114
The current model 7.1.1
114
Transmission system operator, TSO
20 April 2015
115 6
A report to The European Commission
Study on the effective integration of Distributed Energy Resources for providing flexibility to the electricity system
7.2
7.1.2
Distribution system operator, DSO
116
7.1.3
Central generator
116
7.1.4
Supplier
116
7.1.5
Balance responsible party
116
7.1.6
Consumers
117
Changes in roles and responsibilities in a future model
117
7.2.1
Roles and responsibilities
117
7.2.2
Aggregators
118
7.2.3
Prosumers
122
7.2.4
Balance responsible party
123
7.2.5
Distribution system operator
124
7.2.6
Transmission System Operator
124
7.2.7
Traditional generators
124
7.3
Reactive or Active demand side participation in the day-ahead market 125
7.4
Capturing the value streams today – some good examples
8
126
7.4.1
Demand response and PJM
126
7.4.2
Aggregator in Austria – frequency control from electrical heaters
128
7.4.3
Aggregator in Finland – frequency control from demand response 130
7.4.4
Aggregator of heat pump control in Sweden
131
7.4.5
Future business cases – using storage as a service
133
Current barriers
135
8.1
Lack of markets
135
8.2
Lack of market access
138
8.3
8.4
8.5 9 9.1
8.2.1
Market access for aggregators
138
8.2.2
Market rules and product definition
140
Lack of price pass-through
142
8.3.1
Regulated end-user prices
142
8.3.2
Feed-in tariffs
145
8.3.3
Net metering
145
8.3.4
Fixed prices are dominating
145
Economic regulation of DSOs
148
8.4.1
Classification of storage and unbundling of distribution
149
8.4.2
Network tariffs
150
8.4.3
Taxation and surcharges
151
Technical barriers
151
Key findings
153
The power system changes
20 April 2015
153 7
A report to The European Commission
Study on the effective integration of Distributed Energy Resources for providing flexibility to the electricity system
9.2
Distributed Energy Resources can provide flexibility
154
9.3
There are still barriers for Distributed Energy Resources
155
10
Recommendations
157
10.1
Flexibility needs adequate markets and remunerations
157
10.2
Regulators have to establish a level playing field for all actors
159
10.3
The future is consumer centric
160
11
References
162
APPENDIX
165
Technological fact sheets
166
20 April 2015
8 A report to The European Commission
Study on the effective integration of Distributed Energy Resources for providing flexibility to the electricity system
Foreword This report has been prepared for the European Commission under the Framework Service Contract No SRD MOVE/ENER/SRD.1/2012-409-lot2 by a consortium led by PwC. For this study the work has been led by Sweco in cooperation with Ecofys, Tractebel Engineering and PwC. The work was divided into three tasks: ■
■
■
Task 1: Description of different flexibility resources, their level of maturity in providing services to the market and identification of the need for flexibility from DER and the potential for these resources in the EU. Task 2: Analyse existing situation for DER participation in the energy market with a focus on market conditions and identification of barriers for decentralised flexibility to participate in energy markets and provide services to different actors. Task 3: Conclusions and recommendation for the further development and integration of decentralised flexibility resources on EU level.
The analysis team has been led by Niclas Damsgaard (Sweco). Task leaders for task 1 have been Georgios Papaefthymiou and Katharina Grave (Ecofys) and task leader for task 2 has been Jakob Helbrink (Sweco). In addition the core team has consisted of Vincenzo Giordano (Tractebel Engineering) and Paolo Gentili (PwC). In addition to the core team valuable contributions have been made by several of our colleagues from the participating companies. In addition to the interviews a stakeholder consultation workshop was held in Brussels on 24 September, 2014 during which a draft version of the report was presented and discussed. The participants had been provided with the draft report in advance of the workshop, but stakeholders were also invited to provide written comments after the workshop.
20 April 2015
9 A report to The European Commission
Study on the effective integration of Distributed Energy Resources for providing flexibility to the electricity system
List of acronyms AA-CAES BRP BaU Capital Expenditure CHP CAES Prosumers DAM DR DER DG DSO EV ENOP FIT FCR FRR G2V HHI ISP IoT ID LCOE O&M OPEX PV PHS RES RR STOR TOTEX TSO VRES V2G VPP WAP
Advanced Adiabatic Compressed-Air Energy Storage Balance Responsible Party Business As Usual CAPEX Combined Heat and Power Compressed-air energy storage Consumers with local generation Day-ahead market Demand Response Distributed Energy Resources Distributed Generation Distribution System Operator Electrical Vehicle Energy Options Market Feed-in Tariffs Frequency Containment Reserve Frequency Restoration Reserve Grid to vehicle, power from grid to vechicles Herfindahl-Hirschmann Index Imbalance Settlement Period Internet of Things Intraday market Levelised cost of electricity Operation and maintenance costs Operational Expenditure Photo voltaic electricity generation Pumped hydro storage Renewable Energy Sources Restoration Reserve Short Term Operating Reserve Total Expenditure Transmission System Operator Variable Renewable Energy Sources Vehicle to Grid injection Virtual Power Plant Weighted Average Price
20 April 2015
10 A report to The European Commission
Study on the effective integration of Distributed Energy Resources for providing flexibility to the electricity system
Executive Summary This study focuses on the efficient market integration of Distributed Energy Resources (DER) in order to provide flexibility to the power system. The undergoing changes in the power system with increasing shares of Variable Renewable Energy Sources (VRES) will increase demand for flexibility and at the same time decrease supply of flexibility from traditional sources. Because VRES are mainly connected to the distribution grids, their expansion puts a focus on local integration challenges. Flexible DER can provide services to fill flexibility gaps on the local and on the transmission level. The technologies needed are available, the challenge is to adjust to the institutional set-up and the technical environment to make them market ready. During the implementations of these changes it is important to remember that the introduction of DER flexibility provision should always be built around providing economic efficiency, and that DER flexibility provision is not a target by itself. DER can provide flexibility Growing shares of VRES in the generation portfolio increase the demand for flexibility. Daily patterns in demand for power generation lose their predictability. Changes in load from one hour to the next hour (ramps) grow. VRES are mainly connected to distribution grids. In addition to other distributed generation (DG), they therefore increase the complexity of distribution grid management. At the same time, VRES and DG replace supply from traditional sources of electricity generation. Existing central power plants have lower operational times and cannot balance the changes in residual demand. They cannot cover the flexibility gap on distribution grid level. There are plenty of options to provide flexibility on the distribution grid level. Their potentialis not fully used. The study gives an overview on the characteristics of available flexibility options from DER. Technological evolutions are reducing the cost of DER flexibility, and the cost-effectiveness of DER flexibility is on the rise. Increasing price volatility improves the business case for flexibility. There are several concrete examples of DER providing flexibility to the system already today. Flexible generation from DG and storage options are already locally used to balance demand and supply in electricity systems. Also, demand side participation is by no means a new concept, but can be traced back to the 1960s via Time-of-Use tariffs. Worth noting is that the traditional Time-of-Use tariffs are better suited for a system where both demand and supply is predictable and known on forehand, which is expected to be reduced in a future with significant shares of VRES. The energy customers need to be in focus The customers will be central in the transition to a low carbon electricity system with high shares of renewable energy. When large shares of generation capacity is not controllable and depends on weather phenomena, the demand side has to react to system needs. In addition consumers who also have their own production (“prosumers”) are likely to become 20 April 2015
11 A report to The European Commission
Study on the effective integration of Distributed Energy Resources for providing flexibility to the electricity system
more common, making the customers even more central. Increasing the customers’ responsiveness, will benefit both the total power system and contribute to empowering the customers. In the end, the entire purpose of the energy system is to serve the needs of the consumers. Aggregators are crucial for DER integration and coordination is needed There are plenty of distributed generation and storage facilities as well as flexible consumers and prosumers that can provide flexibility. Each one of these are small. Aggregators are needed to capture the flexibility from many small size sources. This crucial role can be filled by many different types of entities, e.g. suppliers, retailers, telecommunication companies or specialised new companies. Competition between these entities can stimulate innovation and development of new services and solutions. Clarifying the roles and responsibilities of an aggregator is therefore essential to facilitate active participation of DER in electricity systems. While the aggregator role is important for the integration of DER, it may also give rise to conflict of interests. The actions of an aggregator can have negative impacts on other market participants. For instance, it may give rise to imbalances for Balance Responsible Parties (BRP). There is a need for coordination between aggregators and BRPs when an aggregator is operating on the deregulated market segments such as Day-Ahead (DAM) and Intraday (ID) markets. In particular, if an aggregator is an active market participant on these markets it is necessary that the aggregator has its own balance responsibility, or an agreement with a BRP. It is important to emphasize that no market participant, being an aggregator or a customer, is allowed to “sell back” energy which it has not bought in the first place. Demand reduction is thus not a product that can be sold on the market, unless the energy previously has been purchased. Provision of ancillary services in real time, such as balancing or congestion management, is in many ways simpler. The key issue here is that adjustments have to be made in the settlement process ex-post in order not to financially penalize (or unduly remunerate) third party market participants, e.g. other BRPs. As long as the appropriate adjustments in the settlement are done, there is limited need for coordination between the aggregator and affected BRPs. In addition to coordination between aggregators and BRPs, there will also be a need for coordination between DSOs and TSOs. DSO grid operation is expected to become more complex and go from the traditionally passive operation to a more active operation similar to the operation of the transmission grid. DSO actions may then interfere with the TSO’s operation. This indicates a need for coordination between the TSO and DSO, potentially with some type of platform for bid exchange and activation of resources. There might also arise conflicts between DSO and TSO. When the conflicts relates to physical requirements, it is important to remember that the conflicts that need to be resolved are subject to the physical constraints. Effectively, physical constraints may in some cases limit the availability of DER for market participation. As local problems can only be solved at the local level, the physical
20 April 2015
12 A report to The European Commission
Study on the effective integration of Distributed Energy Resources for providing flexibility to the electricity system
needs of the DSO will take precedence. However, if it is more an economic competition for the same resource the willingness-to-pay will determine who gets access to the resource. Barriers for aggregators and DER remain Generally speaking there are several barriers for both aggregators and DER. Market rules and product definitions are historically designed to fit with the needs of central generators. While there is a process of adjusting these to facilitate for new resource providers, there is more to be done. For example, minimum bid size and bid increments have been lowered substantially in day-ahead markets (DAM). Currently the threshold in DAM is typically at 0.1 MW, which implies good possibilities for aggregators and DER participation. While such a decrease has taken place also in some balancing markets, minimum bid size and bid increments remain high in many balancing markets and in some cases are as high as 50 MW. This constitutes an important barrier for DER market participation. Furthermore, activation rules could have significant impact on the possibilities for demand side participation, and this impact need to be considered when defining such rules. Long activation periods (duration) or high frequency of activation may for example exclude many types of demand side participation. In the demand response participation on the PJM market (US) there are several different demand response “products” that can be supplied where the duration and frequency varies. Communication infrastructure is essential In order to make use of DER to provide flexibility especially on the system level, communication infrastructure is essential. Depending on installed functionalities, smart meters can enable the adoption of dynamic tariffs and the introduction of demand response based on price signals. This requires that Smart Meter data (including prices in high resolution) can be made available to the user. This is not always the case for deployed smart meters but solutions exist to add this functionality. As already commonplace in the US, smart meters could also allow the introduction of automatic demand response programs to mitigate peak events without relying on price signals. In this case grid operators or utilities need direct access to smart devices to adjust their consumption to flexibility needs. In addition to the metering and communication infrastructure specific for the power market, the connectivity is increasing fast with other types of metering and communication (“Internet of Things”). There are already examples of business cases for flexibility that is not using the official metering equipment and communication infrastructure. In the study one example from Austria illustrates how an aggregator provides frequency reserves to the TSO from domestic electrical water heaters using the SMS and cellular technology for communication and control. The true value of flexibility is not always revealed in market prices First of all it is important to recognize that the value of flexibility varies significantly both on a geographical level and across time. In many cases the underlying market value is still likely to be a limiting factor for DER participation. This could for instance be due to abundant 20 April 2015
13 A report to The European Commission
Study on the effective integration of Distributed Energy Resources for providing flexibility to the electricity system
alternative resources, such as reservoir hydro power plants in parts of Europe. However, the true value of flexibility is not always revealed in the market prices. Increasing the revealed value of flexibility by reducing the length of Imbalance Settlement Periods (ISP) One example analysed in the study is the impact of different Imbalance Settlement Periods (ISP). The German intraday market offers contracts both on an hourly and 15-minute basis. By studying the price differences between the contracts systematic differences could be detected. The hourly prices hide some of the value of flexibility, and shortening the ISPs could contribute to revealing more of the true value. There are also other considerations that need to be balanced against when determining the appropriate ISP and the value of shortening ISP will also differ across markets. It is therefore not necessarily the case that the same ISP is optimal for all markets. Worth noting is that the current trend is towards shorter ISP throughout Europe, and in the latest draft of the Network Codes it is enforced that the ISP should not be longer than 30 minutes. Revealing the local value of flexibility by a more granular spatial market representation The value of flexibility is also different in different areas. On a market level this is shown by differences in price volatility between different parts of Europe (based on DAM prices), and model simulations also indicate that while an increase in volatility can be expected it is likely that there will be geographical differences across Europe also in the future. However, the true local value of flexibility is not completely revealed in these prices as the use of fairly large bidding areas in most of Europe hide local differences and limit the incentives for flexibility in areas where it is most needed. Italy is one country divided into several prices zones, as well as separate prices for some congested nodes. The price volatility is significantly higher in some of the congested nodes, showing a clearly higher value of flexibility in these areas. It is however only the generators that meet the local price, while customers meet a weighted average price across the areas, implying that the customers do not meet the full local value of flexibility through these market prices. Again, there will be several circumstances that need to be considered when defining bidding areas, but a sufficiently granular spatial market resolution is needed to reflect the characteristics of the network in a reasonable way and reveal the local value of flexibility. However, going further down into the distribution level there will be even more local conditions leading to different values of flexibility. This is not likely to ever be revealed in e.g. the DAM or ID market price, as it would require an extreme granularity. Ensuring pass-through of market value of flexibility Even if the market prices on DAM and ID reveal the value of flexibility, the information is not always passed-through to end-customers or other providers of flexibility. There are several regulatory and institutional arrangements that prevent this from happening. Regulated enduser prices are common in many European countries, and are likely to limit, or completely remove, any short term price pass-through. The value of flexibility will then not be revealed 20 April 2015
14 A report to The European Commission
Study on the effective integration of Distributed Energy Resources for providing flexibility to the electricity system
to the end-customers. Furthermore, the feed-in tariffs effectively insulates the producer from the market prices and also removes incentives for flexibility. Thirdly, lack of hourly metering and/or net metering of prosumers leads to customers do not face the real-time value of the electricity. In the case of net metering, the grid is artificially used as storage for the prosumer and the value of electricity will be the same independently if it is consumed or produced. Network tariffs should also reflect the value of flexibility. However, the value of flexibility could also be revealed through bilateral contracts, or tendering, which is likely to be the case for products that have very local characteristics. Organised market places not the only solution For very local markets it is likely that the market concentration will be high, with possibly only one or a few suppliers of flexibility. DER can add competition to concentrated markets, but it is likely that some markets will remain very concentrated. For instance, there will be cases where there is only one or a few potential providers of local services in a part of a distribution grid. At the same time it is important to remember that it is often difficult to foresee the possibilities of opening up markets. The supply may be larger than expected. In markets that nevertheless remain highly concentrated and illiquid, the impact of one market participant on market prices could be significant. One additional supplier of flexibility could then significantly reduce the (shadow) value of flexibility and undermine the business case. In these cases other arrangements such as tendering and capacity payments could then be more suitable. Taxes and network tariffs affect the business case for storage Charging of distributed storage is in many cases regarded as consumption and subject to paying consumption taxes and surcharges. In contrast, large scale pumped hydro storage are often exempted from paying consumption taxes. For the distributed storage this creates a wedge between the price paid for charging the storage and the price received when discharging. The price differences that are needed to finance a storage will then have to increase before the storage becomes profitable. Similar effects may arise due to the design of network tariffs, where storage could be subject both to consumption and production subscriptions. This may also be the case for pumped hydro connected to the transmission grid. Storage should pay for the costs it causes the network owner, but this type of tariff structure make the business case for storage more difficult. DSO regulation and tariff setting important Increased use of DER for the operation of the DSO network would typically imply a decrease in CAPEX (reduced investments in grid) and an increase in OPEX (remuneration of flexibility provision). Throughout Europe the electricity networks are subject to monopoly regulation,
20 April 2015
15 A report to The European Commission
Study on the effective integration of Distributed Energy Resources for providing flexibility to the electricity system
although the details of the regulations differ. This study has not included a mapping of the national DSO regulations, but points at some general issues. First of all, a common regulatory model is to build up the regulated revenues from CAPEX and OPEX. The CAPEX remuneration is determined by the regulatory asset base, and reduced investments leading to a reduced asset base, will then decrease the CAPEX remuneration. OPEX remuneration is done in several different ways, but typically an OPEX increase is not allowed to be passed on directly into the regulated revenue. This could lead to incentives not to optimize the CAPEX/OPEX mix. The problems are even more severe if the increase in OPEX comes before a decrease in CAPEX, which would be the case if future investments are avoided or postponed. This is of key importance as the vast majority of the local flexibility needs have historically been resolved by grid reinforcement (CAPEX). In general, focusing on total costs (TOTEX) rather than CAPEX and OPEX separately should provide better incentives for the DSO to optimize. In practice the regulatory arrangements will be complex, and are not outlined in detail in this study. In addition to the regulation of the overall revenues, the tariff structures are sometimes subject to regulation. Typically there is a non-discriminatory condition, but the regulation may also go further prescribing the tariff structure. For the purpose of integrating DER it is important that the network tariffs are designed in a way that provides the proper incentives based on the local conditions. As the local conditions will differ, the DSOs should be allowed flexibility in designing tariffs tailored to the solutions that best meet the local needs, without unduly restrictive regulation. Concluding remarks As the power system is changing the demand for flexibility is likely to increase. At the same time the supply of flexibility from traditional sources is likely to decrease. DERs could be important contributors of flexibility to bridge this gap. As the study shows that flexibility options from DER are available, and the cost-effectiveness of DER flexibility is on the rise, it is important that the institutional arrangements are adapted to accommodate for DER flexibility. While the EU policy and regulatory setup allows for DER, there are remaining barriers. This ranges from regulatory set-up, market arrangements as well as a general need to develop business models and approaches. Flexibility from regulators, TSOs and DSOs and a readiness to adapt rules and regulations that can support developing business cases are important. New roles will also develop in the market. Customers will play a central role in the future system. The customers will provide demand response, but with prosumers becoming more common they will also have access to generation. Aggregators will however be important to realize the potential of many small resource providers, being customers, distributed generation or storage. The current market design is for historical reasons often based on the needs of central generators. This has already started to change, and should continue in order to integrate flexibility from DER. 20 April 2015
16 A report to The European Commission
Study on the effective integration of Distributed Energy Resources for providing flexibility to the electricity system
1
Introduction
Power systems in Europe are undergoing a significant change. Decarbonisation and technological development are increasing reliance on renewable technologies, primarily variable weather-dependent resources such as wind and solar. Accommodating the relatively less controllable and predictable output of the new technologies is driving changes in the composition and operation of the entire power grid. Balancing of generation and consumption at all times requires flexibility in the system. Traditionally, flexibility was provided in power systems almost entirely by monitoring the supply side and controlling the generation. Increasing reliance on variable renewable energy sources (VRES) for large fractions of the electricity production in power systems introduces new challenges to power system planning and operation. In this respect, increasing controllability and flexibility of the (variable) supply and of the demand is a key pathway towards a more robust system.
1.1
Background
Power systems comprise power sources (supply) and sinks (demand) which are geographically spread and are connected through the power network. Their operation is defined based on a set of system rules aiming to ensure a spatial and temporal balancing of generation and consumption at all times (see Figure 1). Figure 1: Schematic representation of the power system operational principle.
Source: Ecofys Traditionally, differences in demand and supply in power systems have been balanced almost entirely by monitoring the supply side and controlling the generation. The generation fleet had to follow all variations in the demand (variability) and to ensure that the system 20 April 2015
17 A report to The European Commission
Study on the effective integration of Distributed Energy Resources for providing flexibility to the electricity system
stays in balance in the case of the sudden loss or any other change of a generating unit (uncertainty). Thus, variability has historically been an issue primarily related to demand, while uncertainty was an issue primarily related to supply. The main duty of power networks is to transport/distribute energy and interconnect areas. Finally, the system operational rules define how resources are utilised on day-to-day operation.
1.2
Flexibility
With the introduction of variable supply sources, power system planners and operators are recognizing that power systems need new ways of balancing supply and demand. The concept of “flexibility” in power systems gained importance: "On an individual level, flexibility is the modification of generation injection and/or consumption patterns in reaction to an external signal (price signal or activation) in order to provide a service within the energy system. The parameters used to characterise flexibility in electricity include: the amount of power modulation, the duration, the rate of change, the response time, the location etc." (Eurelectric, 2014) Flexibility services include “up regulation” that means providing additional power as needed to maintain system balance, and “down regulation” that means reducing the power availability in the system. “Ramping capability”1 is an expression of how fast flexible resources can change demand or supply of power.
1.3
Distributed Energy Resources
Distributed energy resources (DER) consist of small- to medium- scale resources that are connected mainly to the lower voltage levels (distribution grids) of the system or near the end users. Key categories are: ■
■ ■
Distributed generation (DG): power generating technologies in distribution grids. The category comprises dispatchable resources like cogeneration units or biogas plants and variable renewable energy sources (VRES) that depend on fluctuating energy sources like wind and solar irradiation. Energy storage: batteries, flywheels and other technologies that demand electricity and supply electricity at a later point in time Demand response (DR): Changes of electric usage by end-users from their normal consumption patterns in response to market signals such as time-variable prices or incentive payments
In particular in the longer run when such technologies are likely to replace larger shares of traditional generation technologies this could incur challenges to the power system. A basic challenge introduced by variable renewable generation is that it increases the complexity of system balancing (in spatial and temporal terms) due to the unpredictability and spatial
1
Ramping is defined as the power change (could be both generation and load) between two consecutive time periods. 20 April 2015
18 A report to The European Commission
Study on the effective integration of Distributed Energy Resources for providing flexibility to the electricity system
dispersion of power production. Another important challenge is that to a significant extent variable renewable generators are also likely to be connected to low and medium voltage distribution systems. The introduction of such distributed energy resources (DER) creates a paradigm shift in power systems. In ‘traditional’ power systems, power generation is mainly connected to the high voltage transmission grid in the form of centrally controlled large scale power plants. Distribution grids were traditionally designed as ‘passive’ networks, containing mainly loads. In such power systems, power flows are uni-directional, from the high voltage transmission grid to the loads in the lower voltage levels of the system. Increased penetration levels of DER transform distribution grids to ‘active’ systems which, together with loads, contain high shares of generators and energy storage devices. This new system structure implies bi-directional power flows between distribution and transmission systems, since distribution grids will export power at times when local generation exceeds consumption. This evolution brings higher complexity in the management of distribution systems, but also new possibilities to optimise the overall system by allowing distribution systems to participate actively in the system operation and by allowing DER to participate actively in the distribution system management. The idea of power system flexibility has been introduced to describe the modification of generation injection and/or consumption patterns in reaction to an external signal (price signal or activation) in order to provide a service within the energy system. This generally encompasses the extent and speed with which generation or consumption levels can be changed. Historically, DER only marginally contributed to power system flexibility. But the provision of flexibility from DER can also contribute to both global/market wide and local flexibility challenges. There are however several challenges for efficient market participation of flexible DER, and new designs or business models are likely to be needed to facilitate flexible DER. Addressing these issues can improve the prospects for DER, facilitate higher levels of variable renewable resources on the grid, and allow the customers to take over an active role for distribtion systems on the optimal operation of the power system.
1.4
A policy framework
Energy policy is formed in the interaction between several, possibly conflicting, targets. Security of supply will always be a key target in any energy policy, although the emphasis on security of supply will differ over time and geographies depending on a number of factors. Energy production and transmission of energy will always have some negative environmental impact and environmental sustainability has for a long time also been a key target in energy policies. The type of environmental problems addressed has shifted over time. As problems around local pollution have decreased, the main emphasis moved to climate change. The third target relates to economic efficiency, i.e. how can we ensure the energy supply in the most cost efficient manner. Sometimes the focus is a bit narrower, with a strong emphasis on e.g. low prices and industrial competitiveness which is not necessarily the same thing as an economic efficient supply. While these three elements always play a role in virtually any energy policy the emphasis shifts over time. There seems to be a tendency that if the focus is biased towards one of these elements, which balance will over time shift back and more emphasis will be put on the other two. 20 April 2015
19 A report to The European Commission
Study on the effective integration of Distributed Energy Resources for providing flexibility to the electricity system
Figure 2. The energy policy triangle
This study focuses on the efficient integration of DER and there is a clear link from the energy policy targets to the focus of the study, which is illustrated by the policy cascade Figure 2. This cascade starts with the overarching energy policy targets (security of supply, environment and economic efficiency). With the introduction of large shares of VRES, new sources of flexibility are needed, and DER can provide at least part of that flexibility in order to maintain a secure energy system. It is well established that efficient markets will also lead to efficient outcomes. A cornerstone of European energy policy is therefore the establishment of the internal energy market, with all its different elements. Through market integration the resources are expected to be used more efficiently which will both reduce costs and decrease environmental impact since less efficient power plants are not needed to the same extent. Market integration is also expected to improve the security of supply as disturbances in the system not only need to be met by domestic resources, but trade can to a larger extent help to alleviate problems. Thirdly there is a general expectation, which is also supported by this report, that the transformation of the electricity system towards more VRES, will both increase the demand (need) for flexibility in the power system, and over time reduce the supply of flexibility from conventional generation sources. The VRES will both come in the form of centralised large parks and smaller distributed resources. The VRES in general creates a flexibility gap on a system level, but distributed VRES can also create new needs for flexibility at the local level. DERs can at the same time contribute to filling this gap. Given the central role of markets in developing an efficient system, market integration of flexible DERs becomes crucial. This is the main focus of this report. A final step in this cascade is the customer centric approach and the empowerment of customers. DER includes generation, storage and demand side measures. All of these are important. However, while distributed generation and storage may be supplied independently 20 April 2015
20 A report to The European Commission
Study on the effective integration of Distributed Energy Resources for providing flexibility to the electricity system
of customers we expect that the customers will play a key role in the future. The emerging trend towards consumers who are also producers, so called prosumers, illustrates this. The involvement of the customers, independently of whether they are prosumers or pure consumers, is likely to be vital for the successful integration of DER. This drives towards a customer centric approach, which also has an additional value that it can empower energy customers. Figure 3. An energy policy cascade
Energy policy targets
•Security of supply •Environment •Economic efficiency
Development and use of markets
•Reduced production costs •Increased competition •Reduced environmental impact •Increased security of supply
Market integration of flexible DERs
•Use markets to facilitate efficient integration of flexible DER
Customer centric
• Empowerment of customers
Source: Sweco, team analysis A customer centric approach does not mean that we expect that all customers will be active in supplying flexibility or participating in the different markets. First of all, we expect that most customers are not particularly interested in spending a significant amount of time or resources on this, i.e. very few customers will be active themselves on a day-to-day basis. Rather there will be solution providers of different kinds that will support the customers and enable their market participation. We expect that so called aggregators will play a key role not only for demand side participation but also for other DERs (e.g. small scale generators). Secondly, the possibilities for customers to actually supply flexibility will differ. Some customers will have a significant amount of flexible load, at least at some points in time. Looking at the household sector it ranges from large houses with electric heating or significant cooling demand, to small apartments with limited electricity consumption. Such differences also exist in other sectors. The key will be to enable participation of the customers that have the underlying potential for flexibility. If this is successful it will also benefit non-active customers since it reduces the overall cost of the system. The organised energy market places typically have strong and active supply sides (generators), but rather weak and inactive demand side (customers). This leads to less 20 April 2015 21 A report to The European Commission
Study on the effective integration of Distributed Energy Resources for providing flexibility to the electricity system
efficient outcomes, difficulties for the markets to function well at all time and potentially also problems with market power. In addition to increasing the efficiency of the system, the empowerment of customers will also strengthen the role of the customers in the energy markets.
1.5
Scope and outline of the report
The study follows value chains of flexibility in distribution grids and identifies barriers for these value chains to be fully materialized. We start with defining and discussing flexibility gaps, and from that identify the value streams from flexibility, i.e. different uses for flexibility. We then outline how different types of DER can contribute to providing flexibility and how the supply and demand can be linked. This also includes outlining roles and responsibilities in a future markets that can facilitate efficient integration of DER, but also identify key barriers. Based on this analysis we provide our key findings and recommendation. The outline of the report is as follows ■ ■ ■ ■
■ ■
■
■ ■ ■
Chapter 2 investigates how a flexibility gap is expected to appear in EU power systems in the future, identifying the need for flexibility. Chapter 3 looks at the flexibility value streams, with a focus on the users of flexibility in regulated and deregulated parts of the sector. Chapter 4 presents an overview of the market value of flexibility based on available and comparable market data. Chapter 5 presents a mapping of the different DER resources and technologies concerning their key characteristics for flexibility provision. This includes investment costs, technical constraints, barriers and first comments on their potential role in future systems. The chapter also assesses the cost effectiveness of DER. Chapter 6 looks at the value chains linking supply and demand of flexibility. Chapter 7 provides an overview of current roles and responsibilities in the market. The chapter also includes a presentation of some selected business cases for DER participation. Chapter 8 studies how the roles and responsibilities would change in a future with more DER participation. In particular we look at aggregators and prosumers, but also how roles of other market participants change. Chapter 9 investigates the current barriers for integration of DER. Chapter 10 concludes with findings and recommendations. In appendix we provide fact sheets for a the DER resources and technologies presented in chapter 5.
20 April 2015
22 A report to The European Commission
Study on the effective integration of Distributed Energy Resources for providing flexibility to the electricity system
2
Demand for flexibility from new sources
As described above the energy system is undergoing substantial changes that create a need for flexibility from new type of sources. These changes can be traced back to two key developments: the introduction of generation capacity in distribution grids and the incorporation of higher shares of VRES (such as wind and solar energy) to the system 2. These developments add to the need for power system flexibility and to the emergence of a “flexibility gap” in the following ways: a) VRES increases supply side variability and uncertainty, increasing the need for flexibility; b) VRES and DG can temporarily displace conventional thermal generation capacity, especially peaking units, tending to reduce the availability of conventional flexible resources on the system; c) In the longer run, VRES and DG displace conventional power plants and therefore reduce the programmable generation capacity; d) Generation capacity that is connected to lower voltage levels (distribution networks) induce a radical transformation local distribution systems, from passive networks (which include only loads) to active systems which include loads and generation and can manage power production and consumption locally. Although implications depend highly on the specifics of each system, the overarching effects can be traced into two key aspects: changes in the residual demand, which reveal the challenges on a system operation level (global flexibility gap) and changes in the system architecture by the incorporation of DG in distribution systems which induce the challenges on the distribution systems level (local flexibility gap). In systems with increasing shares of VRES, a “flexibility gap” may emerge that will need to be covered by new flexibility options. To illustrate how this gap may emerge, we split our analysis into analysis of global system aspects (impacts at system operation level) and local aspects (impacts to local networks and systems).
2.1
Global flexibility gap
In this section we investigate flexibility implications on the power system operation when integrating higher VRES shares. Generation from VRES (mainly wind and solar) replaces conventional generation to the extent the fluctuating sources are available. The different supply structure changes the operational regime of power required from conventional power plants. In systems with VRES, the operation of the conventional fleet needs to follow the 2
The terms DG and VRES are used to differentiate between aspects related to unit size (DG) and controllability (VRES). Of course units can belong in both categories, such as small-sized wind farms or PV installations. However, VRES include also large-scale installations, which add to the impact to the system operation. 20 April 2015
23 A report to The European Commission
Study on the effective integration of Distributed Energy Resources for providing flexibility to the electricity system
fluctuations of the residual electricity demand in the system, this is demand minus VRES. The analysis of the variability of residual demand reveals key impacts of VRES on system level: the load changes more often and the differences increase. To illustrate the increase in flexibility requirements for higher VRES penetration scenarios we analyse the impacts of VRES on a) b) c) d) e)
daily patterns, yearly dynamic ranges, yearly ramping ranges, day-ahead markets and on other (smaller than hourly) timeframes.
The impact of VRES depends on the characteristics of electricity demand and on the chosen VRES scenario. Therefore we analyse three examples for EU countries with different demand patterns and varying VRES (wind and PV) penetration levels in terms of share of VRES generation on the yearly demand: 1. Germany as a central European state, where VRES generation could currently cover approximately 14,5% of the yearly demand (Eurostat, 2014). Specifically, the current share of wind energy is close to 9,5% and that of PV approximately 5%. Our analysis examined penetration levels starting from low (0-20%) to high (60-80%) consisting of balanced growth of both wind and PV based on the current situation. 2. Sweden, representing a Northern European state, with a current share of VRES of approximately 8%, while the share of hydro power is about 50%. In case of Sweden the current share of wind energy is approximately 7,7% and that of PV 0,3% (Eurostat, 2014).. The analysis is therefore performed for VRES shares of up to 40%, consisting mainly of wind, assuming that the share of hydro production remains stable. 3. Spain, as a Southern European state, with a current share of VRES of approximately 23%. Wind energy shows high shares around 19% while the current share of PV is 4% (Eurostat, 2014).. Similar penetration levels as in the German case were examined, consisting again of balanced growth of both wind and PV based on the current situation. Regional patterns for wind and solar radiation are used and the analysis is performed on hourly resolution due to data availability. Note that this analysis assumes no additional flexibility in the system. This means, there is no curtailment of VRES, no changes in crossborder electricity transport patterns, no storage options, and no demand response. Instead, actively operating VRES is treated as a separate source of flexibility in section 5.1 (“Active Power Control of Renewable Energy”).
20 April 2015
24 A report to The European Commission
Study on the effective integration of Distributed Energy Resources for providing flexibility to the electricity system
a)
Impact on daily patterns
VRES increase the variability of the residual demand every day. Figure 4 illustrates the changes in residual demand for a week in spring for Germany. At VRES penetration levels of approximately 60%, negative residual demand values appear. The original demand patterns show nearly repeating demand on weekdays and lower demand on the weekend (right side of the graph). These patterns are completely changed by increasing levels of wind generation. Figure 4: Daily patterns of electricity demand (No RES) and residual electricity demand (different penetration levels).
Source: Ecofys The original demand patterns in Spain (left graph in Figure 5) show a stronger peak demand at noon. The integration of 20% VRES does not radically change the residual demand patterns, and mainly increases the afternoon valley. However, the variability of residual demand is increasing when exceeding 40% penetrations. At shares of 60% VRES negative values for residual demand are likely. Similar effects are observed on the Swedish residual demand (spring period) as the share of VRES increases, as can be seen in the right graph of Figure 3. The integration of wind would imply residual demand close to zero already at shares of 40% in the generation mix. Concluding, the analysis of daily patterns shows that the introduction of VRES brings a radical change of the residual demand patterns, by increasing its daily variability and by totally altering the otherwise repeating patterns of weekday/weekend demand. This implies a similarly radical change on the generation system planning: power plants cannot plan operation in a repeating daily pattern but should adjust operation daily.
20 April 2015
25 A report to The European Commission
Study on the effective integration of Distributed Energy Resources for providing flexibility to the electricity system
Figure 5: Daily patterns of electricity demand (No RES) and residual electricity demand (different penetration levels)
Source: Ecofys analysis for Spain (left) and Sweden (right) b)
Impact on yearly dynamic ranges
Figure 6 illustrates the corresponding change in yearly demand duration curves for Germany. All 8760 hourly demand values of the example year are sorted largest to smallest. This is a common approach in the engineering and analysis departments and shows the load duration curve. The figure shows the increasing variability in residual demand with growing VRES penetration levels. While the absolute peak decreases little, low values become more often. With very high VRES shares, significant oversupply events occur: VRES generation in single hours are below original demand of the same hour, the residual demand is negative. The same trend also applies for the cases of Spain and Sweden. Concluding, higher VRES shares increase the yearly variability of residual demand, and push the overall load curve downwards, without however reducing significantly system peak.
20 April 2015
26 A report to The European Commission
Study on the effective integration of Distributed Energy Resources for providing flexibility to the electricity system
Figure 6: Dynamic range of electricity demand (No RES) and residual electricity demand (different penetration levels).
Source: Ecofys analysis for Germany A key consequence is that the capacity factor3 of existing conventional generating units is radically reduced, as indicated by the horizontal dashed lines. Although the peak demand is not reduced significantly, the residual demand duration curves are steeper in peaking hours, showing a radical decrease in the operational hours of peaking units. Traditionally, peaking units are the most flexible units in the system and are responsible for providing the largest share of the system’s flexibility. VRES have a direct impact on the profitability of such units due to the reduction of their capacity factor, seen by the reduction of the duration of peak demand in Figure 6. c)
Impact on yearly ramping ranges and ramp rates
The range of hourly ramps of residual electricity demand for Germany is presented in Figure 7. In this graph, differences in consecutive hourly residual demand values are again sorted from largest to smallest. The graph shows how the hourly demand variation is radically increased with higher VRES shares. In the base case without renewable energies, the highest change in demand changes from one hour to a following hour is about 9 GW. The calculations for a case with more than 80% variable renewables, hourly ramps in residual demand would increase to more than 25 GW. Therefore, with higher VRES penetration levels, the system is exposed to much higher power fluctuations, which imply an increase in the system balancing needs and in the ramping requirements of the conventional generation fleet. This analysis is based on historical patterns of demand, solar irradiation and wind
3
Capacity factor of a power plant is the ratio of its actual output over a period of time, to its potential output if it was operating at full nameplate capacity throughout the period.
20 April 2015
27 A report to The European Commission
Study on the effective integration of Distributed Energy Resources for providing flexibility to the electricity system
speeds in Germany. The 80% case is a theoretical outcome, if no export and import capacity and no flexibility option is available. Figure 7: Hourly ramping range of electricity demand (No RES) and residual electricity demand (different penetration levels).
Source: Ecofys analysis for Germany Figure 8: Normalised hourly ramp rates for Germany, Spain, Sweden.
Source: Ecofys analysis
20 April 2015
28 A report to The European Commission
Study on the effective integration of Distributed Energy Resources for providing flexibility to the electricity system
The range of hourly ramp rates for Spain, Sweden and Germany are compared in Figure 8. Nominal hourly ramps are divided by the total value of the preceding hour to show the relative changes of residual demand. In the case of no RES in the electric power system the net demand in Spain has the highest maximum ramp rates with 30%, Sweden has much lower rates of maximum 17%. The German example shows highest ramp rates of 21%. Increasing the share of VRES to 40% the ramp rates in all countries increase (in absolute and relative values), indicating the higher variability and ramping requirements of the systems. Spanish ramp rates increase by 10%, Swedish rates by 57%. In Germany, demand changes and changes in infeed from renewables have more often opposite directions, so the maximum ramp rate increases by only 1%. Concluding, in all cases we see that higher VRES shares lead to radical increases in ramps of residual demand, having a direct impact on the system balancing requirements. d)
Impact on day ahead markets
The limits of the power system flexibility are already visible in some European member states. An example is presented in Figure 9, based on the operation of the German system for one week in February 2011 (ex-post data). A typical ‘flexibility event’ can be observed in the case of high wind generation in the demand valley between Friday night and Saturday morning. In this event the conventional power park reached its flexibility limits (peaking plants were shut down and base load units (nuclear and lignite) were operated at minimum generation levels), while exports were at maximum levels. The increased need for flexibility was translated to near zero and negative spot market prices for the specific time window.
20 April 2015
29 A report to The European Commission
Study on the effective integration of Distributed Energy Resources for providing flexibility to the electricity system
Figure 9: VRES impact on the reduction of system flexibility resources
Source: Ecofys analysis based on EEX, ENTSO-E for Germany VRES increase the variability of residual demand and subsequently the need for flexibility in the system, while they simultaneously displace traditional flexibility resources. This dual impact calls for adjustments in the power plant fleet and its operation, to ensure that sufficient number of flexible power plants are online. e)
Impact on other timeframes
The impact of VRES is not limited to the hourly changes in residual demand. In particular, the key conclusions from the hourly timeframe analysis are valid also for other timeframes: VRES increase the variability of the residual demand which brings new operational challenges for the system.
20 April 2015
30 A report to The European Commission
Study on the effective integration of Distributed Energy Resources for providing flexibility to the electricity system
Figure 10: Examples and timeframes of fluctuations in the system Strong and
Low PV
Day and night
Wind fronts
weak wind years
generation in winter
differences in PV generation
and movement of sun
Yearly fluctuations
Seasonal fluctuations
Clouds, storms
Daily
Hourly
Intrahourly
fluctuations
fluctuations
fluctuations
Source: Ecofys Figure 10 shows different operational timeframes and typical examples of how fluctuations in VRES affect the power system flexibility. Locally, PV generation can drop because of clouds, and storms can increase the wind speeds in minutes, increasing intra-hourly fluctuations. At the same time, there can be several hours or even days without any VRES generation at all, which increases the daily and hourly fluctuations and affects the daily planning of the system. Finally, the changes in VRES yearly energy content (e.g. strong and weak wind years) introduce long-term energy fluctuations that affect the long-term system planning.
2.2
Local flexibility gap
The global flexibility gap analysis in the previous section presents the flexibility implications on system level when integrating higher shares of VRES. As VRES are usually connected to distribution grid level, further challenges arise on a local level. In this section we map how the integration of higher penetrations of fluctuating DG impose new challenges for the operation and design of distribution systems. In general, the incorporation of VRES in distribution grids brings similar effects to the residual demand of the local grids as the ones presented above on system level. The fluctuations and variability of local residual demand increase. Due to the design characteristics of these systems (radial structure, vicinity to customers, lower voltage levels) this creates several problems with the distribution system operation and design (Coster, 2010), (Ackerman & Knyazkin, 2009), (Eurelectric, 2013). One main issue is the control of active and reactive power in the system. In times of local oversupply, reverse power flows can occur, electricity is fed to upper grid levels. This oversupply causes problems with keeping voltage and current variations within operational limits. VRES can cause congestions in the distribution networks and impact grid losses. Additionally, power quality can be affected. Fluctuating electricity generation can cause local problems with the protection and the fault level4 of the grid.
4
The fault level at a given point of the electric power supply network is the maximum current that would flow in case of a fault.
20 April 2015
31 A report to The European Commission
Study on the effective integration of Distributed Energy Resources for providing flexibility to the electricity system
Traditionally, fluctuations in distribution grids were caused by changes in local demand. DSOs solved such issues by network expansion measures, e.g. increasing line capacities or installing voltage support devices. Such network development strategies are best suited to deal with demand increase situations, which were the key driver for the development of traditional distribution systems. Such strategies could be less cost-effective or not able to fully solve the problems related to residual demand variability increase. Therefore alternative strategies provided by flexibility actions are needed. In order to understand the nature of these problems, we present these issues in more detail in the section below.
2.2.1
Voltage problems
One of the important tasks of DSOs is maintaining voltage within certain limits in order to supply customers with acceptable and conform power quality. In power systems without distributed generation the customers who are remotely located from the main substation are supplied with voltages of lower magnitude than the customers who are located close to the main substation. The traditional way to cope with this problem is the installation of specific equipment which controls and regulates the voltage along the power lines. Examples are voltage regulators, transformer tap changer, capacitors, switched capacitors, boost transformers, compound transformers or phase shifters. Integration of DER into the medium and low voltage networks changes the voltage profiles along the distribution grids. The injection of active power increases voltage at the connection point and the local area around the injection point. If there is not enough demand in the distribution network to consume the generated electricity, then the voltage may locally increase and lead to violations of overvoltage operational limits. These voltage problems put at risk customer facilities and network components and violate obligatory standards on power quality. Such voltage problems can become worse when DER inject reactive power into the grid without performing a voltage control function. The critical voltage deviation depends on the relative location of the DER in the distribution network. The closer DER is to the main substation (connection to the higher voltage level), the lower its critical impact is on the voltage profile of this area. Generally parts of the distribution grid remotely located from the main substation are considered weak as the transfer capability of the power lines in these areas is limited. In such parts of the distribution networks the impact of DER on the voltage profile is more critical.
2.2.2
Reverse power flows
When the local production of DG exceeds the local load, reverse power flows appear and the local grid exports towards the higher voltage grid. Most of the existing distribution networks are designed assuming a unidirectional power flow from centralized generating stations situated at the high voltage transmission system towards the customers situated at the lower voltage system levels. The phenomenon of reverse power flows fundamentally changes the design and management of distribution networks as networks need to be designed for peak generation in addition to peak load. For example the protection settings, composition of protection devices or concepts for automatic load-shedding must be adjusted. Furthermore,
20 April 2015
32 A report to The European Commission
Study on the effective integration of Distributed Energy Resources for providing flexibility to the electricity system
the reverse and fluctuating power flow requires extensive system operations by the distribution network operators to control the limits of their assets and regulate the power flow.
2.2.3
Congestions
Power system congestion occurs when planned or actual flows across a system component exceed its safe design capacity. Current distribution system operators’ (DSO) experience shows that generation located on distribution systems can be difficult to plan for, and resulting flows can cause unanticipated congestion, especially in rural areas. Similar problems may occur in cases of massive connection of new loads in the system due to sector electrification, e.g. in the case of electric vehicles in urban areas. Typically congestion at the transmission system level is handled by re-dispatching (i.e., adjust the scheduled generation of power plants) centralised power plants. At the distribution system level, congestion has historically been dealt with by planned upgrades of distribution system components. Such upgrades however cannot follow the pace of the rapid generation developments of VRES in the distribution networks leading to temporary congestions. In addition, it is currently discussed if a network design which integrates very seldom peaks of generation by VRES is a cost-optimal solution. Instead of grid extension, additional flexibility options may be more cost-effective to avoid congestions.
2.2.4
Grid losses
The effect of DG on grid losses relate to their impact to the total power flows in the system and depend on two factors: the amount of injected power and the location of DG in the grid. When DG is close to demand, the injected power is consumed. In this case the power losses are reduced compared to the case without DG. However, grid losses may increase for remotely connected DG. Losses can also increase during the night when there is low demand and simultaneously high wind energy production. In active distribution networks 5, DG units are often also responsible for voltage control. Where there is high penetration of variable distributed generation, this voltage support action can be translated into additional reactive power and thus to an increase in reactive power losses in the network. (ECOFYS, 2013) 6 Figure 9 shows that with low share of DG the grid losses drop in comparison to distribution grids without DG, but once there are large injections of distributed generation into the DSO network grid losses tend to increase.
5
Active distribution networks are distribution systems comprising of loads and DG where power flows are bidirectional, in contrast to the traditional structure of ‘passive’ distribution networks which contain only loads, where power flows are uni-directional (see analysis in section 1.1) 6 Besides reactive energy injection systems, smart transformers along with associated automation systems, coordinated through Advanced Distribution Management Systems, can be used to fine tune voltage. This fine-tuned voltage control infrastructure designed for DER can also be used to minimise technical losses.
20 April 2015
33 A report to The European Commission
Study on the effective integration of Distributed Energy Resources for providing flexibility to the electricity system
Figure 11: Grid losses related to the penetration of DG
Source: (Gerwent, 2006)
2.2.5
Case studies
In this section, two case studies highlight reactive and active power issues in the distribution networks of Germany and Sweden caused by the high share of VRES, DG and other DER in distribution systems. Case study 1: VRES/DG Curtailment in distributions networks (ECOFYS, 2012) Local flexibility gap issues: congestions problems, reverse power flow The following case study highlights the impact of wind power on the development of a local flexibility gap in the distribution system. Schleswig-Holstein (S-H) is a German federal state in the north of Germany next to the border of Denmark. The special characteristics of this region are: ■
According to estimations, 100% of the yearly regional demand could be covered by regional VRES energy production in 2014 ■ 98% of RE capacity is connected to the distribution grid (0,4kV, 10-20kV, 110kV), and the largest share (67%) on medium voltage level (10-20kV) Figure 10 shows the distribution of the installed wind capacity in Schleswig – Holstein (S-H) as well as the total RE installed capacity per type and voltage level. The deeper blue colours on the map (left part of the figure) indicate higher levels of wind capacity.
20 April 2015
34 A report to The European Commission
Study on the effective integration of Distributed Energy Resources for providing flexibility to the electricity system
Figure 12: Distribution of installed wind capacity in Schleswig-Holstein (left) and installed capacity per technology and voltage level (right) in Schleswig-Holstein
Source: Ecofys based on the plant register of the German transmission system operators DSOs in this region face many challenges due to the high integration of VRES and especially wind energy (67% of the whole RE capacity). Due to system inflexibility, DSOs resort to curtailment for ensuring secure grid operation. Between 60 and 80% of all curtailment actions in Germany appear in this region. In total, 5% of wind energy production is curtailed and the highest share of this curtailment (more than 80%) occurs in the medium voltage level. Key reasons for this are: ■
■
VRES installations in lower voltage levels increase constantly, however the grid is not developed with the same pace to allow the alleviation of congestion problems. In addition, the construction of the planned reinforcements/extensions of the overlaying high voltage transmission system is delayed and it is deemed very expensive. The local imbalances between demand and supply lead to reverse power flows. In particular, low voltage (0.4kV) and medium voltage (10-20kV) grids feed energy back into the high voltage grid (110kV) and to the transmission system (>110kV).
20 April 2015
35 A report to The European Commission
Study on the effective integration of Distributed Energy Resources for providing flexibility to the electricity system
■
So far, the DSO capability for implementing different options to solve congestion problems is limited. The most common option is that of controlling the active power of the power units (curtailment)7.
In Figure 13, the wind capacity allocation is compared to the intensity of DER curtailment in different areas of Schleswig–Holstein (S-H). The deeper red colours on the map (left) indicate higher intensity of generation curtailment. Dark red indicates regions with more than 200 hours of curtailment per year. The deeper blue colours on the map (right) indicate higher levels of installed wind energy capacity. The areas with the higher installed capacities of wind power plants presented the highest share of DER curtailment incidents. This is explained by the fact that curtailment (mainly of large wind farms, reported 95% of the cases) has been the only flexibility action taken by the DSO to resolve these temporary congestions. Figure 13. Wind capacity energy allocation in northern Germany and DER curtailment
Intensity of DER curtailment (hours per year)
Wind capacity allocation in the region of Schleswig – Holstein (2013)
Source: Ecofys Grid extension is the traditional way to solve this problem and should be performed in advance in the grid planning phase. However it is often the case that grid cannot be extended as fast in order to facilitate all DG. For this reason in the region of SchleswigHolstein (S-H) temporary congestions appear due to construction delays of the planned grid extensions. However it is under discussion whether grid extension is the most cost-effective solution, since congestion events occur only a few times per year (Wieben et al, 2014). The regulation obliges the network operators to make the necessary investments to reinforce and extend the grid in order to absorb all the energy produced by DG (worst-case scenario design). Case Study 2: Increased DER in a distribution grid in Sweden (Damsgaard, et al., 2014)
7
Curtailment has to be justified by grid congestion problems and is just allowed, if all possible market mechanisms are exhausted. Regarding the current regulation, first conventional power plants need to be reduced to a technical minimum, before RE can be curtailed. Producers get a refund for their curtailed energy of at least 99 % of the market value at the time of curtailment.
20 April 2015
36 A report to The European Commission
Study on the effective integration of Distributed Energy Resources for providing flexibility to the electricity system
Local flexibility gap issues: voltage control (load peaks and voltage fluctuations), reverse power flow In the local distribution grids changes in local generation and load are in many cases likely to be substantial over the coming decades. For this study case, the impact of such changes is analysed using actual metered data for individual distribution grid customers. The effect of high shares of VRES was analysed for a Swedish suburban distribution grid. The study compared the current operation of a substation (year 2012) with its future operation under an increased DER scenario (PV and electric vehicles (EVs) (Damsgaard, et al., 2014). The scenario is based on existing scenarios developed within the research programme “North European Power Perspectives (NEPP)”. The future scenario estimates that in 2037 in this specific substation of the suburban distribution grid the amount of the grid connected solar systems and electric vehicles will substantially increase. Figure 14 shows the hourly power flow (kWh/h) in a suburban distribution substation (50kV/10kV) in Sweden, comparing the current situation (actual data) with the potential future scenario (simulated data). Gaps are due to missing values. The future scenario implies a change in residual demand peaks. They are increased due to the charging of EVs that do not react to price or grid signals. However, the biggest difference is that the grid becomes a net exporter at the substation level (the red line goes below zero), feeding energy back to the grid and not just to the residential consumers. Figure 14: Impact of increased local generation in a distribution grid (power flow in a Substation (50kV/10kV)
Source: Sweco Energy Markets Figure 15 shows the energy consumption and the maximum-minimum of electric power on a monthly basis in 2012 and in 2037 for the same substation. In addition to reverse power 20 April 2015
37 A report to The European Commission
Study on the effective integration of Distributed Energy Resources for providing flexibility to the electricity system
flows and increased peak load, the interval (gap) between maximum and minimum power per month increases in the 2037 scenario. The increase of this interval implies bigger challenges for DSOs in terms of voltage control as power changes relate to voltage changes. The new operating conditions have an impact on grid equipment as well as on customer’s devices. The effects of increased penetration of solar PV and EVs were examined in a residential area for a substation (10kV/0,4kV) on the same grid. The effects on voltage were similar at the low voltage level as they were at medium voltages. A striking result is that difference between minimum and maximum power levels increased by 500% in July. Figure 15: Monthly energy consumption (blue) and maximum-minimum of power (black) per month in years 2012, 2037 in a substation.
Substation (50kV/10kV) in a suburban grid in 2012
Substation (50kV/10kV) in a suburban grid in 2037
Source: Sweco Energy Markets Summarizing the findings of the case study, the increase of PV and EVs leads to new operational conditions that should be handled by DSOs: ■ ■ ■
Higher peaks of consumption due to the electric vehicle charging Periods of reverse power flow Higher power fluctuations which implies higher voltage fluctuations
20 April 2015
38 A report to The European Commission
Study on the effective integration of Distributed Energy Resources for providing flexibility to the electricity system
3
Flexibility value streams
The value of flexibility ultimately stems from the different needs of the power systems and the actors in that system. The system need of flexibility is described in chapter 2. This chapter concentrates on the actors in European electricity markets that seek to contract flexibility options for several reasons. One main group of actors are transmission system operators (TSOs) being system responsible for the overall transmission network. They balance out ramps in demand and supply on the transmission system level and guarantee a stable frequency in a defined region. In their territory as well as on the borders to neighbouring territories, they have to manage congestions. Distribution system operators (DSOs) are responsible for the system stability on distribution grid level. Both types of system operators act as natural monopolists – there is no competitor that operates grids in their defined territory. That is why they are monitored by regulation authorities. All other actors compete on liberalised markets They are organised in balance responsible parties (BRPs). If actors trade on different markets for electricity they try to buy at cheapest prices and supply at highest prices. They make use of price differences between markets (arbitrage). By competing on different markets, they reduce price differences. Figure 16. Need and provision of flexibility services
Source: Ecofys
20 April 2015
39 A report to The European Commission
Study on the effective integration of Distributed Energy Resources for providing flexibility to the electricity system
Figure 16 connects the flexibility needs to the actors. DER can provide flexibility on a global, but at the same time at a local level in its distribution grid system. Their services can be used by TSOs, DSOs and BRPs. DER flexibility can address flexibility needs both at system level (transmission system, related to the global flexibility gap) and local level (distribution systems, related to the local flexibility gap). As stated above the beneficiaries of the flexibility may either be in the regulated part of the electricity sector (TSO, DSO) or in the unregulated part. Figure 17. Categorisation of flexibility needs
Local
Regulated
grid management
TSO:
BRP:
Balancing Congestion management System adequacy
Source: Team analysis
BRP: Optimization for single customers Liberalised
DSO:
Portfolio optimization and arbitrage
Global
The local need for flexibility will be superior the system need for flexibility due to the law of physics: local physical constraints cannot be handled globally. However, if one considers the need and use of flexibility in the long-term, the local need for flexibility can be resolved via grid reinforcement. This may or may not be cost optimal, depending on the circumstances. An alternative to grid reinforcement could be to utilise local flexibility, which then could lead to a conflict between the global and local need for flexibility, if the provision of flexibility is scarce. In a scarcity situation the local conditions will prevail, once again due to the law of physics.
3.1
Regulated beneficiaries
At local level, the value of flexibility is dependent on its physical location in the grid. DSOs can procure flexibility to optimally manage the distribution grid as an alternative to traditional (and possibly more costly) grid expansion investments, addressing grid issues related to the 20 April 2015
40 A report to The European Commission
Study on the effective integration of Distributed Energy Resources for providing flexibility to the electricity system
local flexibility gap, such as voltage control, congestion management, reverse power flows, increase of distribution losses. Flexibility options at distribution grid level can provide support to DSO grid management and increase DG hosting capacity via active power control and reactive/voltage control.8). Connection of distributed generation has historically often been managed according to a “fit and forget” approach. DG connection is sized at planning stage to withstand worst case scenarios, without considering any flexibility of DGs to adapt to grid conditions during operations. This leads to more conservative and onerous DG connection requirements. Electricity demand capacity is managed in the same way. So far, demand is not expected to react to network or market signals. Flexibility in demand can reduce peaks in demand on the DSO and on the TSO level by shifting demand from times of peak demand to times with lower demand or by shedding the load, i.e. cutting demand without possibility to catch up later (demand response). In general, possible options to enable DSOs’ use of flexibility for distribution grid management encompass the inclusion of DER flexibility in the regulatory asset base (e.g. storage), bilateral contracts between DSO and flexibility providers (e.g. aggregators), set-up of local markets to allow DSO procurement of flexibility based on grid operating conditions. Currently, several European pilots (NiceGrid , Grid4EU, Venteea 9, E-Energy E-telligence pilot project10) are testing technical platforms that allow DSOs to monitor and dispatch distributed energy resources to ensure optimal grid management. The activation of flexibility on the distribution grid level includes two or three actors; the provider, possibly an aggregator (intermediary), and the DSO (end-user). Depending on the number of providers, or the capacity of the average provider, the need for an aggregator is varying. The level of sophistication in the communication and automation level of activation will also play an important difference in the usefulness of aggregators. The providers of flexibility are likely to be remunerated by a capacity payment due to the long planning horizon, and the risk for local markets (DSO). The alternative (reinforcing the grid) has a (very) long planning-horizon, and the consequences of failing to meet the requirements (e.g. unserved demand/generation) are to be considered as severe, which further pushes towards capacity remuneration. These capacity remunerations could potentially be combined with an activation fee. Challenges and barriers for a successful implementation are mainly related to firmness of supply, implementation of a suitable communication infrastructure, DSO regulation and the inclusion of the flexibility remuneration in the revenue cap (increased OPEX, see also section 8.4). Also, conflicts might arise between the BRP and the activation of the flexibility, if successfully deployed in a large scale and there is no communication in advance, as this will yield an imbalance from the scheduled portfolio demand.
8
A number of on-going pilot projects are studying new DSO planning and operational tools that explicitly include DER flexibility among grid management options of the DSO (e.g. GREDOR https://gredor.be/) 9 www.nicegrid.fr/; ; http://www.grid4eu.eu; www.nicegrid.fr/ 10 www.e-energy.de/en/89.ph;; 20 April 2015
41 A report to The European Commission
Study on the effective integration of Distributed Energy Resources for providing flexibility to the electricity system
As described below, DER flexibility is already being trialled out to support DSO grid management, with an on-going shift from the pilot to the commercial phase. ■
■
■
Demand Flexibility DSOs are starting to use demand flexibility as an alternative to grid reinforcements, especially in those cases where capacity limits are reached only for a few hours per year. For example in the UK, UK Power Networks has set-up a bilateral contract with the aggregator Enernoc for the provision of demand response service to limit power congestions in selected grid areas and avoid reinforcements. Under this scheme, the DSO can activate DR flexibility during peaks occurring MondayFriday from October to March11. Flexibility providers receive payments for contracted capacity and an energy payment when the flexibility is actually activated. UK Power Network’s business plan forecasts savings of around £40 million [€52M]12 from DR schemes from 2015 until 2023, on the ground of successful trials carried out so far.13 Similarly, in the US, utilities can procure demand flexibility via bilateral contracts with aggregators for grid management purposes. For example, in 2013, over 900 MW of Demand Response were contracted by utilities for grid emergency management14. Distributed generation Curtailment of distributed generation is another form of DER flexibility that DSOs are already using to address grid management issues. In Germany, following the on-going high penetration of DGs, remote dispatchability by DSO is now mandatory for medium/large CHP (> 100kW) and PV facilities (> 30kW). DSOs have the possibility to curtail DG generation to meet grid congestions, with compensation of 95 % of lost income. However the situation varies widely in Europe and a number of European Countries (e.g. Austria) do not allow this practice or allow it only in case of system security events at both transmission or distribution level (e.g. UK, Spain). (Eurelectric, 2013) Distributed storage The use of distributed storage for grid management purposes is also being trialled out, mainly at pilot level. For example, in Italy, the leading Italian DSO, Enel Distribuzione, is currently testing distributed Li-Ion battery storage (2MW/1MWh) in 3 primary distribution systems to reduce the variability of the power flows in sections of the distribution grid with high penetration of RES (e.g. alleviating power
11
Intelligent Distribution Networks - DR for Network Support & Renewable Integration, Enernoc, 2011. http://www.dena.de/fileadmin/user_upload/Veranstaltungen/2011/Vortraege_Verteilnetze/En erNOC.pdf 12 Considering 1£=1.3€ (currency change at January 2015) 13 UK Power Networks Business Plan 2015-2023, ANNEX9 – Smart Grid Strategy, March 2014 14 Demand Response as a Power System Resource: Program Designs, Performance, and Lessons Learned in the United States; RAP report, May 2013
20 April 2015
42 A report to The European Commission
Study on the effective integration of Distributed Energy Resources for providing flexibility to the electricity system
■
3.1.1
flow variations in case of wind gusts or passage of clouds). The goal is to increase the predictability of the exchanges between the distribution and the transmission grid at the primary substations If this pilot proves to be successful, Enel Distribuzione intends to seek regulatory permission to install additional 46 storage systems (1-2MVA; 1-2MWh) in HV-MV substations for a total of 60-80 MW. 15. In the UK, UK Power networks is installing (commissioning by 2014) in a distribution primary substation one of the largest battery systems (6MW/10MWh) in Europe, in order to balance the influx of intermittent renewables and to help support capacity constraints (project is expected to defer £6M [~7.8M€] 16 of grid reinforcements)17. Electric vehicles EV Smart charging flexibility can be also used to support distribution grid management. A number of pilot projects are currently considering how EV smart charging flexibility can be integrated in DSO planning and operational tools, in order to optimize grid investments. (e.g. PlangridEV; GreenEmotion18;). No evidence of commercial implementation to date has been found.
System level
At system level, the following flexibility is needed in balancing supply and demand, in congestion management and to assure system adequacy. a)
Balancing
Balancing services are necessary to ensure the continuous equilibrium of demand and supply in the system. Balancing energy is needed in two ways. Upward regulation requires an increase of generation or a reduction of demand. Downward regulation reduces generation or increases demand. Balancing services for the TSO are divided into energy and non-energy products. The nonenergy products include the primary regulating power (Frequency Control Reserve (FCR)) which is, on average, not resulting in any net energy over the activation as it will vary naturally around the set point (set generation or consumption level). Therefore, the providers of FCR are usually not remunerated by energy units, but rather capacity (EUR/MW/Hz). The “energy-products” (Frequency Restoration Reserve (FRR), Restoration Reserve (RR)) includes the slower products, and can result in energy volume during activation. From a traditional perspective the different products have been procured and remunerated via both a capacity and an activation component in many market regimes, which is foreseen to be a feasible case for the future provision. The value of the flexibility will originate from several streams:
15
ENEL plans for storage introduction in Italian distribution network, presentation by Christian Noce, ENEL, November 2012. 16 16 Considering 1£=1.3€ (currency change at January 2015) 17 http://www.younicos.com/en/media_library/press_releases/014_2013_07_30_UKPN.html 18 www.plangridev.eu/; www.greenemotion-project.eu;www.lowcarbonlondonevproject.co.uk 20 April 2015
43 A report to The European Commission
Study on the effective integration of Distributed Energy Resources for providing flexibility to the electricity system
a. more (central) generator capacity available for the wholesale market as less generator capacity will be reserved for ancillary services b. ramping of (central) generators will be more expensive compared to the (competitive) demand resources c.
Increasing liquidity and competition on the supply side of the regulating markets, lowering costs for the system
The TSO procures resources (“capacity”) with different time horizons in the various member states, ranging from months to days before delivery. The energy products could in theory interfere with the BRP if activated volumes are not accounted for in the settlement calculation ex-post. However this should be a relatively small challenge as the TSO should have the necessary overview in order to include activation in the imbalance settlement calculations ex-post. In terms of time response requirements, balancing services are typically classified as follows: ■
■
■
Primary reserve typically requires response time of up to a few seconds. Primary reserve is automatically activated by the user’s system control according to predefined frequency band. Secondary reserve requires response time slower than the Primary reserve (indicatively 30 seconds and 15 minutes). Grid users that provide secondary reserve must have the appropriate facilities for communicating in real time with the TSOs control centres, and their facilities must comply with certain technical requirements. The tertiary reserve enables the TSO to cope with a significant or systematic imbalance in the control area and/or resolve major congestion problems. Unlike the primary and secondary reserves, the tertiary reserve is typically activated manually at TSO's request. Grid users need to comply with certain technical requirements in order to sign a contract with the TSO to take part in the tertiary reserve.
Central generators, which are able to change their output (ramp) rapidly, start and stop with short notice, have historically been used to provide balancing services. However, distributed energy resources are expected to increasingly offer balancing services. The value chain for generation adjustments for short-term congestion management used by the TSO/DSO is anticipated to have 2 or 3 participants; the distributed generation facilities, an aggregator (intermediary) and then the final user of flexibility (TSO/DSO). The possibility to use DER flexibility to provide balancing services depends on the technical requirements of reserves and on the specific characteristics of DERs. For example, distributed storage (batteries and flywheels) has the necessary fast-ramping capability to provide frequency control. In the US, in 2011 a ruling from the Federal Energy 20 April 2015
44 A report to The European Commission
Study on the effective integration of Distributed Energy Resources for providing flexibility to the electricity system
Regulatory Commission (FERC Order 75519) increased the remuneration for “fast” responding frequency regulation sources, such as batteries and flywheels, to incentivize their adoption. Tens of MW of grid-scale storage devices are currently being implemented to provide fast balancing services in the US. Following the historic California storage mandate of 1.3GW by 2020 issued in 2013, as of mid-2014 more than 2,000 megawatts of energy storage projects had applied to interconnect with the state’s grid, according to recent data from the Independent System Operator in California.20 Aggregation of EVs to provide grid balancing services (via demand response/smart charging or via injection of power in the grid (V2G application)) is also envisioned but it is currently explored mainly at pilot level. For what concerns distributed renewable sources, as their generation adjustment is often asymmetric, i.e. only curtailment of generation, in the case of wind and solar power the flexibility transaction might be dependent on the usage and support of such asymmetric products. Assuming a scenario where the flexibility needs to be offered symmetrically, the output of generation facilities will be limited below the maximal available output in order to offer the extra generation which will effectively mean at a close to zero or negative value, assuming remuneration based on dispatched energy. This demand for symmetry drives for an opportunity cost for non-programmable generators, where the marginal cost is low or close to zero. The opportunity costs are likely too high, however should easily be included in the bids for short-term congestion management. If the bids are competitive (i.e. cheaper than other offers), they should be accepted. In general, DER flexibility is increasingly being used in Europe to provide balancing services, with requirements and opportunities varying among countries. For example, in the UK, National Grid21 has set-up a number of programmes to integrate DER flexibility for the provision of balancing reserves. Examples include: ■
■
Frontline – Under this programme, National Grid contracts flexible demand and storage (batteries, cooling/heating systems) that can be activated quickly (less than 1 second) to provide frequency control. Capacity payments are foreseen for capacity contracted by National Grid in this scheme. Short Term Operating Reserve (STOR): demand competes with generation to provide fast balancing reserve to National Grid. Typically demand flexibility is composed of commercial and industrial interruptible loads equipped with back-up generation. The scheme foresees capacity payment (currently around 22 ~30£/kW/y) and an activation fee for (around 50-60 hours a year of utilization).
19
www.ferc.gov/whats-new/comm-meet/2011/102011/E-28.pdf http://www.greentechmedia.com/articles/read/californias-massive-on-paper-grid-energystorage-market 21 http://www.flexitricity.com/core-services/footroom 22 22 ~39€/KW/y:Considering 1£=1.3€ (currency change at January 2015) 20
20 April 2015
45 A report to The European Commission
Study on the effective integration of Distributed Energy Resources for providing flexibility to the electricity system
■
The minimum aggregation bid is 3MW, and the flexible capacity need to be activated within 20 minutes for at least two hours. Footroom – Under this programme, National Grid contracts downward regulation to prevent wind curtailment at times of high wind generation when electricity prices become negative. Flexibility is provided by flexible loads (demand, storage etc.) which can increase demand and controllable distributed generation (e.g. CHP) that can reduce electricity generation. Capacity payments are in the order of £15 £35k per MW23. Flexible loads also benefit from consumption at periods of negative prices.
In France, around 400MW of flexible demand is presently contracted by the Transmission System Operator (RTE) for tertiary reserve (“marché ajustement”) 24. The response time of flexible loads has to be less than 2 hours and the minimum aggregation bid is of 10 MW. RTE also has bilateral contracts with industrial customers to procure additional reserve via interruptible loads (for a maximum of 400MW), that can be activated up to 10 days per year. In Germany, starting from June 2013, monthly auctions are organized to procure up to 3000 MW of balancing reserves from fast responding flexible distribution loads (less than 15 minutes activation time or less than 1 second for frequency control). The scheme foresees a maximum aggregation size of 50 MW, with loads that need to be attached to the perimeter of the same DSO. In 2013 it was foreseen a fixed remuneration of 2500 €/MW/month (30€/kW/year) and an activation fee between 100 and 400€/MWh (Bundesministeriums der Justiz und für Verbraucherschutz und Juris GmbH, 2012). b)
Congestion management
Typically congestion management actions include preventive actions (allocation of the available cross-border capacities) and remedial actions (redispatch measures after capacity allocation). Transmission system operators are increasinglly usingDER flexibility as remedial actions for congestion management. (In the future, epecially in grid areas where structural infrastructure bottlenecks are present, DER flexibility could also be included in the process of calculating the available cross-boreder capacity) In France, in winters 2012/2013 and 2013/2014, the French Transmission System Operator RTE has contracted 70MW of demand response (with a minimum bidding size of 1MW) in Bretagne, to assure supply at peak times in a region which depends on limited interconnections with other French regions. The return of experience has been positive. For
23
~€20- €45k per MW:Considering 1£=1.3€ (currency change at January 2015) Services système et mécanisme d’ajustement, CRE, 2013. http://www.cre.fr/reseaux/reseaux-publics-d-electricite/services-systeme-et-mecanisme-dajustement 24
20 April 2015
46 A report to The European Commission
Study on the effective integration of Distributed Energy Resources for providing flexibility to the electricity system
example in 2012/2013, RTE has successfully activated 16MW on the 12th of December 2012 and 41 MW on the 17th of January 2013 to solve congestions at peak times. 25 Italian southern regions have recently witnessed massive on-going penetration of variable renewable generation (PV and wind) whose generation is constrained by transmission grid bottlenecks. The Italian System Operator, Terna, has invested in three large energyintensive battery storage systems in southern Italy, each with an average capacity of approximately 10 MW and 80 MWh. The scope is to ensure greater flexibility in the management of renewable power plants, and to increment the transmission grid’s capacity to absorb renewable power without creating congestions. 26 c)
System adequacy (meeting peak demand)
System adequacy refers to the capability of the power system to reliably serve peak demand. The peak-shifting for generation capacity adequacy (Security of supply-long term) value chain is foreseen to include two, or three, participants; the provider (industrial or domestic consumers (provider), possibly an aggregator (intermediary), and the TSO/DSO (end-user)). The remuneration is via capacity or direct tariff incentives, and the trading horizon is foreseen to be relatively long-term (yearly). Another alternative is ToU tariff schemes, which have proven to be useful in long-term peak-shifting27. One of the challenges might be reduced predictability when the need for flexibility (“shifting”) is needed in a system with significant generation from VRES, making the “programming” of appliances to consume during “off-peak” harder. A conflict could arise between the grid needs, and the balancing needs, e.g. a BRP could be imbalanced while the grid is under significant load (opposite “directions” demanded), why the signal from these two actors could be conflicting. The “optimal” hierarchy should again be according to laws of physics, e.g. the grid should be superior to market incentives if conflicting.28 The needed equipment for communicating signals/activation could be the same as for several other value chains, for example for shortterm demand adjustments. DER flexibility can typically contribute to system adequacy via a reduction of peak demand (via load shedding/demand response; auto-consumption) or via increasing the availability of DG generation (via DG combined to storage; use of heat storage to allow electricity-driven operation of CHPs etc.).
25
http://www.enerzine.com/15/15976+effacer-la-consommation---rte-reitere-sonexperimentation-en-bretagne+.html 26 Storage Applications in the Italian Transmission Grid, InnoGrid2020+ Seminar - Integration of storage in network management – why, when, where, how?, Brussels, 20 February 2013 27 According to interview with one stakeholder ToU tariffs have been used in France since 1960’s. Approximately 80 % of the hot water tanks in France are programmed to start during off peak, which is estimated to shift 9 TWh of energy annually, corresponding to approximately 3 GW of installed peak load capacity. Synergy effects are reduced investment needs in the grid of more than 100 MEUR/annum. 28 The market should provide correct incentives for “system needs”, e.g. in the case of a conflict this indicates market signal failure due to market design flaws, rather than two competing buyers of flexibility. 20 April 2015
47 A report to The European Commission
Study on the effective integration of Distributed Energy Resources for providing flexibility to the electricity system
In particular, the use of flexible loads for peak shaving is increasingly being considered as a necessary and economic rational means to ensure system adequacy, particularly to off-set generation capacity that is used only a few hours per year. For example, according to the load curve of the Belgian high-voltage network operator Elia in 2012, the last 400MW of generation capacity in Belgium were only used for 13 hours 29. Traditional investments to ensure system adequacy include dispatchable generators (typically centralized and fossil-based) and grid interconnectors. In the PJM market area (US), capacity auctions are organized to procure necessary capacity to meet forecasted peak demand three years in advance. Generators, demand response and energy efficiency resources are able to compete on an equal basis. Currently, the capacity market is by far the main source of valorisation for demand response in the PJM area (around 10GW of demand response capacity was contracted in the latest auction for 2017/201830). For example, Enernoc, the largest US aggregators, reports capacity payments of around 185 M$ [160M€]31 for a total of 4GW of contracted demand response capacity32. A number of European countries are about to implement capacity markets (e.g. UK, France) to ensure system adequacy. DER flexibility, and particularly demand response, is expected to be able to participate. In Sweden/Finland, demand side resources are already included in the national strategic reserves, with aggregators currently making bids for aggregated demand resources.
3.2
Unregulated beneficiaries
3.2.1
Local level
a)
Optimization of single customers’ portfolio of generation and consumption
DER flexibility can be used by prosumers to optimize their generation and consumption profiles thus reducing their energy bills. For example, a consumer who is equipped with PV could use demand flexibility or a distributed storage system to minimize the costs of procuring grid-supplied electricity. Storage combined to solar systems are already commercially deployed in Europe and US. For example, in 2013, Germany set-up a 50M€ funding to support decentralized storage system to be coupled with PV generation (commercial/residential customers) and around 4,000 solar-plus-battery systems have been 33 installed up to May 2014 (according to the Solar Industry Association) . In California, integrated PV and storage systems for residential and commercial customers increasingly have a business case via reduction of peak demand charges.Several non-utility companies are installing big batteries in buildings, mainly based on the business case of reducing peak
29
www.elia.be http://pjm.com/~/media/markets-ops/rpm/rpm-auction-info/2017-2018-base-residualauction-report.ashx 31 Considering 1$=0.86 € (currency change at January 2015) 32 http://www.navigantresearch.com/blog/a-dark-day-for-demand-response 33 http://www.navigantresearch.com/blog/germany-supports-solar-storage 30
20 April 2015
48 A report to The European Commission
Study on the effective integration of Distributed Energy Resources for providing flexibility to the electricity system
demand charges (component of the tariff based on the monthly peak consumption) for commercial and industrial customers34.
3.2.2 b)
Global level Portfolio optimization and arbitrage
Portfolio optimization refers to the use of flexibility by commercial actors (e.g. retailers) to optimize their position on the wholesale market, e.g. optimising the deviations from generation/demand from forecasted schedules or contracting flexibility to hedge risks. Flexibility can also be used to optimize a portfolio of distributed energy resources bidding on power markets via virtual power plant-VPPs. Examples include: ■
■ ■
A RES generator using distributed storage to smooth out the intermittency of RES and to make RES predictable, thus reducing imbalances, in those contexts where RES generator face balancing responsibility). A retailer choosing to activate demand response to reduce energy procurement costs in a period of high electricity prices. an aggregator optimizing the outputs of a different set of resources composing a VPP to launch a supply bid on the wholesale market
The use of DER flexibility (e.g. demand response) by balancing responsible parties is already commercially mature. The optimization of distributed energy resources into virtual power plants is progressively moving from pilot projects to commercial stage. For example in Germany, RWE started its first VPP pilot project in 2008 (8.6MW) and is expected to manage a VPP portfolio of over 200MW in 201535 increasing its commercial value. In the US, distributed storage (Li-Ion batteries) in the scale of 20-50KW (installed at commercial customers’ premises) are currently being aggregated and are bidding on a dayahead demand response programme managed by the California Independent System operator. The offers are accepted if lower than wholesale energy prices. The minimum size of accepted bid is 100kW36. Peak-shifting for portfolio optimization (both long- and short-term) is a value chain that generally involves two, or three-four actors; the provider (industrial or domestic consumers (provider), possibly an aggregator (intermediary), the BRP (end-user or trader), and possibly a third party BRP (end-user)). The portfolio optimization could in principal originate from two 34
http://www.greentechmedia.com/articles/read/Sharp-Jumps-Into-Distributed-Storage resnick.caltech.edu/docs/d-Siemens_Grid3.pdf 36 http://www.greentechmedia.com/articles/read/aggregating-building-batteries-into-gridresources 35
20 April 2015
49 A report to The European Commission
Study on the effective integration of Distributed Energy Resources for providing flexibility to the electricity system
demands; resolving inevitable forecast errors (both consumption and generation) by revising consumption so that the scheduled positions are met during the imbalance settlement period or as a traded product in order to balance other third party BRP portfolios. The underlying demand is identical; utilizing consumption flexibility in order to balance portfolios at an effective cost. There are several challenges that need to be resolved in the successful deployment of this transaction; metering and the remuneration of “participating” endconsumers (e.g. domestic consumers) due to the lack of “reference balancing consumption” with consumer settled by their consumption profiles, controlling of appliances/activation, the planning horizon for activation, the impact on underlying processes that use electricity (mainly related to industrial consumers). The remuneration is foreseen to mainly be via capacity payments ahead of delivery, however traded relatively short-term continuously. The reason for this is that the activation might be irregular and that suppliers might require return on invested money with reduced risk. An automatic activation is foreseen (due to large number of end-consumers). Furthermore, the settlement period is foreseen to be relatively short, and for profiled consumers the “reference consumption point” (probably handled via ‘baseline method’) might pose a challenge. There are synergies with the other long-term peak-shifting value chain as the needed equipment for control is similar.
20 April 2015
50 A report to The European Commission
Study on the effective integration of Distributed Energy Resources for providing flexibility to the electricity system
4
Market value of flexibility
The focus of this study is on the efficient integration of DER in order to provide flexibility to the electricity system. This implies that there should be an underlying value of the flexibility, which exceeds the cost of providing it. For products and services traded on markets, this value should be revealed through the market prices if the markets are properly designed. In this section we study the current market value across Europe based on available market data. As the availability and comparability of market data varies depending on which type of market we are looking at, the main focus in this section is on day-ahead prices. For illustrative purpose we also present a possible future situation based on model simulations. It should be noted that this is only one possible development, and the exact results depends on a number of assumptions that drive the results. We then also compare between day-ahead and intraday prices for Germany (continental thermal dominated system) and Sweden (Nordic, hydro dominated system). We also compare the value of flexibility revealed through market prices depending on the temporal resolution (15-minutes and 1 hour) in the German market.
4.1
Price volatility in the day-ahead market
The first indicator that we use is the price volatility in the day-ahead market. In Figure 18 the standard deviation of the day-ahead price for 2012-2013 is shown. The standard deviation captures price variation both within days and between seasons and years. From the map we can distinguish different groups of countries/market areas. The price volatility in the Nordic region is low in comparison to most other European countries, which is expected given the high share of reservoir hydro power. North-central/eastern part of continental Europe also has a relative low price volatility, while Italy stands out in the opposite direction. Italy is also interesting given that fact that it has many price zones 37. In particular some of the smaller price zones (nodes) with limited generation capacity have significantly higher price volatility than other price zones. This provides a local value of flexibility, which appears smaller in areas with larger price zones. Figure 19 shows the within-day average price spread, i.e. the average difference between the highest and lowest price within a given day. This is an indicator for the value of being able to adjust production or consumption between peak and off-peak hours. The overall picture is similar to the standard deviation, with lower price spreads in the Nordic region, and north-central/eastern part of continental Europe. However, the countries of the Iberian Peninsula also appear to have a low daily price spread.
37
As some of the regions are physically very small (basically nodes) only 6 are illustrated in the map. 20 April 2015
51 A report to The European Commission
Study on the effective integration of Distributed Energy Resources for providing flexibility to the electricity system
Figure 18. Day-ahead market price volatility (standard deviation), 2012-2013
Figure 19. Average daily price spread (EUR/MWh), 2012-2013 122 111 99 88 77 65 54 43 31 20 9
44 40 37 33 30 26 23 19 16 12 9
N/A
N/A
Source: Market data from European power exchanges, calculations by Sweco
20 April 2015
Source: Market data from European power exchanges, calculations by Sweco
52 A report to The European Commission
Study on the effective integration of Distributed Energy Resources for providing flexibility to the electricity system
Figure 20 illustrates the importance of the hourly price variations in different regions of Europe for seven days in beginning of 2012. SE2 (hydro dominated price zone in Northern Sweden) shows an almost non-existent price variation within the day or over the week. The market value of flexibility in the day-ahead market is thus (very) limited. Of course there could be a value of being flexible on intra-day and balancing markets, but given the amount of easily regulated hydro power that value is also expected to be low. Local flexibility in distribution networks could of course be valuable, although the (marginal) value of global flexibility is very low. All else equal, it will however be more difficult for flexible DER as they cannot count on a high remuneration of flexibility on the (global) power market. Germany and Italy show a clearly different pattern. While Italian prices are much higher than German prices during this period, both countries have a large variation between the highest and lowest prices. Germany also has hours with negative prices. If those market prices where pass-through to producers (and consumers) this would clearly create a value of flexibility on the day-ahead market. Figure 20. Hourly prices, 1-7 January 2012 (EUR/MWh)
200
100 50 0
1 7 13 19 25 31 37 43 49 55 61 67 73 79 85 91 97 103 109 115 121 127 133 139 145 151 157 163
EUR/MWh
150
-50 -100
Hour SE2
GER
GB
ITA
ESP
Source: Data from power exchanges While it is difficult to make a direct mapping from the price volatility to the profitability of DER flexibility on a general level, one can expect that if the conditions otherwise are similar, the incentive to provide flexibility from DER will differ depending on the market circumstances. However, this is not by itself a reason for policy interventions, but simply reflects the differences in value of flexibility across markets. It is only if the low price volatility is due to
20 April 2015
53 A report to The European Commission
Study on the effective integration of Distributed Energy Resources for providing flexibility to the electricity system
the existence of price caps, subsidization of e.g. generation or similar disturbances that a policy response is called for. The price volatility is expected to increase in the future. Figure 21 - Figure 24 show possible future (2030) price volatility (measured as standard deviation and average daily price spread) for two scenarios based on model simulations using Sweco’s European power market model Apollo. The model results of course depend on a number of assumptions (demand development, generation mix, fuel prices, CO 2-price level, etc.), but given realistic assumptions increased volatility is likely. The two modelled scenarios differ in respect to e.g. economic growth and demand, fuel prices, carbon prices etc. The general result is that the price volatility can be expected to increase, but the magnitude of the increase is highly uncertain. The model allows for some demand response, but demand response beyond what is assumed in the model could also contribute to decrease the price volatility.
20 April 2015
54 A report to The European Commission
Study on the effective integration of Distributed Energy Resources for providing flexibility to the electricity system
Figure 21. Simulated future day-ahead market price volatility (standard deviation), 2030 – LOW scenario 92 85 78 71 64 58 51 44 37 30 23
92 85 78 71 64 58 51 44 37 30 23
N/A
N/A
Source: Sweco Energy Markets, Apollo model simulations
20 April 2015
Figure 22. Simulated future day-ahead market price volatility (standard deviation), 2030 – HIGH scenario
Source: Sweco Energy Markets, Apollo model simulations
55 A report to The European Commission
Study on the effective integration of Distributed Energy Resources for providing flexibility to the electricity system
Figure 23. Average daily price spread (EUR/MWh), 2030 – LOW scenario 215 195 176 157 138 119 99 80 61 42 23
215 195 176 157 138 119 99 80 61 42 23
N/A
N/A
Source: Sweco Energy Markets, Apollo model simulations
20 April 2015
Figure 24. Average daily price spread (EUR/MWh), 2030 – HIGH scenario
Source: Sweco Energy Markets, Apollo model simulations
56 A report to The European Commission
Study on the effective integration of Distributed Energy Resources for providing flexibility to the electricity system
4.2
Price on the day-ahead and intraday market varies
A second indicator for the value of flexibility is the price differences between different time frames. Figure 25 shows the price difference between intraday and day-ahead markets for the German and Swedish (price area SE2, hydro dominated area in Northern Sweden) markets during 2012-2013. Again we can distinguish between different groups of countries, where the spread of the intraday price is expected to be significantly larger for thermal dominated markets like the German system, compared with the hydro dominated regions (like the SE2 bidding area). Figure 25. Price difference intraday vs. day-ahead markets in the Nordics and Germany.
Source: Sweco Small deviation between intraday and day-ahead prices could be explained by a number of different factors. One important factor is the resource availability. In the future with increasing shares of variable generation, it is likely that the predictability will decrease both on the system level and local level. In a system where the difference between day-ahead and intraday prices is likely to be small (e.g. SE2), the effects on reduced predictability of the supply-demand equilibrium is smaller compared with a system with a larger spread between day-ahead and intraday prices (e.g. Germany). Another possible factor reducing the value of flexibility is artificially low balancing prices. This is often due to market design features (worth mentioning is low balancing prices due to subsidies from the TSO). Regulation resources are in many cases procured by the TSO, and remunerated via capacity and activation fees. If the capacity charges are not reflected in the imbalance price, the imbalance price will be artificially low.
20 April 2015
57 A report to The European Commission
Study on the effective integration of Distributed Energy Resources for providing flexibility to the electricity system
4.3
Intraday market prices revealing the value of flexibility 38
This section illustrates the importance of why a sufficient settlement period is needed in order to reveal the value of flexibility. There is clear price pattern for the first and last 15minutes of a given hour. The price pattern is here described and explained briefly, illustrating where the valuation of flexibility originates from. The value is clearly revealed in the historical quarterly prices, and is dependent on the system load. In a system where there is significant contribution from VRES, the residual load ramping is expected to be even more volatile and less predictable compared to today’s situation, most likely increasing the need of intra-hour flexibility. Additionally, this section effectively illustrates the need for proper market design (and sufficiently short settlement periods) and how improper market design (e.g. too long settlement periods) hides the true value of flexibility. Case study: The German intraday and imbalance settlement period Market prices from the German intraday market from year 2013 were analysed, both on an hourly and a 15-minute basis. The hypothesis was that a certain need for flexibility would be revealed in the historical prices. In general, a portfolio manager would be active on the market if there is a need to update/change its position, and if there is a value/cost associated with being longer or shorter balanced. If the position is long, i.e. excess generation in the portfolio or short, i.e. demand exceeds the generation, then there is need for flexibility. Another example of a need for flexibility would be the TSO which could potentially use the ID for re-dispatch and counter trade in order to relax the transmission grid. Another application for the ID traders would be outages from power/consumption facilities and therefore the avoidance of imbalances (and imbalance costs). The German intraday market nowadays offers both hourly and 15-minute contracts. The contracts for the following day opens at 3PM (hourly contracts) and at 4PM (quarterly contracts), both the hourly and the quarterly contracts trade period closes 45 minutes prior to delivery. Thus the trading period varies between 7-31 hours. Since the Germany intraday market is not cleared with an auction procedure, hence there is not one single marginal price, the analysed prices were the weighted average price (WAP). The WAP represents all the transactions for a single time step (hour or 15-minute), weighted by the traded volume.
38
The definition of settlement period is described in chapter 6.5.
20 April 2015
58 A report to The European Commission
Study on the effective integration of Distributed Energy Resources for providing flexibility to the electricity system
Figure 26. Historical market prices for German during year 2013, 15-minute values
Source: EPEX Spot The average price on the intraday market per 15-minute and hourly time step and the average hourly load can be observed in the figure below. Figure 27. Weighted average price for the German market per 15-minutes and hour of the day, and the average load per hour during year 2013.
Interval A
Interval B
Interval C
Interval A
Source: Sweco, data from EPEX Spot In order to understand the underlying reasons for the price pattern in each interval (“Interval A”, “B”, “C” see figure above), hence the “need for flexibility”, one would have to look into the load throughout the day (grey dashed curve and the grey columns along the right axis in the figure above). On a typical day the price pattern can be divided into three different time 20 April 2015
59 A report to The European Commission
Study on the effective integration of Distributed Energy Resources for providing flexibility to the electricity system
periods (“intervals”); A, B and C. For example Interval A is defined to be, typically, between the hours 21-06. Obviously the exact hours for a given day vary, as does the price formation. The load is characterized during interval A to be “off peak”, and the first derivative of the hourly average load is relatively close to zero (small changes in load). We assume that, assuming a properly functioning market, that a certain scarcity/need for flexibility is indicated via a relatively high(er) market price. In principle, due to the hourly resolution from the dayahead market, the production plans based on the market outcome will result in a within the hour imbalance, if not resolved via one of the 15-minute contracts traded on the intraday market. On average, the cost of regulation will be higher when the “system” ramping direction is in the opposite direction (e.g. down regulation will be more costly when the “system-trend” ramping direction is up-wards, and vice versa). For a graphical illustration of this, see figure below. Figure 28. Schematic illustration of the hourly ramping effects and the incurred systematic imbalances between load and market outcome “load”.
Source: Sweco Interval A Interval A is characterized by a low, reasonably constant, load, often referred to as “off peak”. Interval A spans between hour 21-06. The price on the intraday market is relatively uniform within the hour, meaning that the average prices on the 15 minute contracts are not significantly different. It should be noted that the price for the first quarter (“00-15”) is slightly higher than the other quarterly contracts, however not as significantly as during interval B and C. Furthermore, worth mentioning is that the average price on the intraday market is relatively low compared to interval B & C.
20 April 2015
60 A report to The European Commission
Study on the effective integration of Distributed Energy Resources for providing flexibility to the electricity system
Interval B Interval B is characterized by a rapid increase of load, starting approximately at hour 6 in the morning and lasting until hour 13. It is between these hours that the load transforms from off peak to peak, and the majority of the daily positive ramping occurs. Historically speaking, this is when mid- and peak-load (central) generators are started. If one looks at the difference between the continuous load and the hourly average load it can be seen that the continuous load will be below the hourly average load for the first two quarters, and during the last two quarters the continuous load will be above the hourly average load, see the figure below for a schematic illustration. Figure 29. Schematic illustration of the systematic imbalance between the continuous and hourly average load during upwards regulation.
Source: Sweco. As can be observed in the figure above, the need for balancing/regulating power will be systematically larger during hours with significant change in the continuous load curve. The steeper the continuous curve is (larger change), the larger the imbalance between the average hourly load and continuous load for the first and last quarters. As the load needs to be balanced with generation at any point in time, any deviation between the actual load and the scheduled production plans needs to be resolved by the TSO (via regulating power and balancing energy). Looking at Figure 30 it can be observed that the average price on the intraday market is higher during the first quarter compared to the price during the last 15 minutes. The reason is because the cost of “flexibility” follows the ramping. Considering the first quarter in hour 06-07 in Figure 30, there is in general need for down regulation (system is short) in order to balance the continuous load. This contradicts with the overall movement of the system, i.e. if a certain generation unit reduces its output the need for future up regulation will be increased in order to be balanced during the next settlement period. This is revealed in Figure 30 above, where the average price during the first quarter (blue curve) is 20 April 2015
61 A report to The European Commission
Study on the effective integration of Distributed Energy Resources for providing flexibility to the electricity system
approximately 3 times higher compared to the price in the last quarter (red curve) for the same hour (hour 8-9). Interval C Interval C is characterized by peak-load and generally occurs between hours 13-18. The load development during these hours is on average relatively constant, however there is a slight decrease in load between the morning peak (around 09-10) and the afternoon peak (around 18-19) looking at the annual average load. However the general trend for interval C is a decreasing load, which is more obvious when one is looking at the load and ID price pattern curves for the month of June and January separately, see figures below. Figure 30. The German intraday quarterly average price for the month of January.
Source: Sweco, data from EPEX Spot The load curve (grey dashed) for January illustrates the need for regulating power and the corresponding cost effectively. A clear pattern can be observed where the price of the first 15 minutes of an hour is ~1.5 times higher on average during the hours with increase load (hour 7-12, 17-19), and the opposite average cost (roughly 1.7 times more expensive during the last quarter) during the hours when the load is reduced (13-16). This pattern that can be observed for January during mid-day (hour 13-16) does not appear for the month of June (or any of the other summer months), as the afternoon peak is not as clear as during the winter months. This is also reflected in the average price curves, see figure below.
20 April 2015
62 A report to The European Commission
Study on the effective integration of Distributed Energy Resources for providing flexibility to the electricity system
Figure 31. The German intraday quarterly average price for the month of June.
Source: Sweco, EPEX Spot In the figure above showing the average intraday prices there is a clear pattern of the quarterly costs and the need for regulating power. During the first half of the day (hour 6-13) the first 15 minutes show approximately 5 times higher prices on average compared to the last 15 minutes of the hourly contracts. The exact opposite relation occurs during the second half of the day (system load is decreasing) show approximately 10 times higher price on average for the last 15 minutes compared to the first 15 minutes. The conclusion that can be drawn from the case study is that the need for a representative and adequate market model needs to be in place in order to reveal the true value of flexibility. Depending on the regime and technological characteristics, the adequate ISP length will vary. For a hydro dominated region like the Nordics the value of flexibility will be less varying as for thermal dominated markets (e.g. the German market), thus reducing the need for a shorter ISP. The length of the ISP should balance proper system representation with burden on market participants and liquidity.
20 April 2015
63 A report to The European Commission
Study on the effective integration of Distributed Energy Resources for providing flexibility to the electricity system
5
DER provision of flexibility
Traditionally the flexibility of the system has primarily been provided by large centralized conventional generation resources, e.g. thermal and hydro power plants. As illustrated in chapter 2, the changes of the power system both increase the overall demand for flexibility and reduce the supply of flexibility from the traditional sources. Subsequently, the demand for flexibility from distributed energy resources increases. The suppliers of flexibility at distribution grid level will be consumers, distributed generation and storage providers. Some consumers already rely on or will in future have their own generation capacity available and are then often referred to as “prosumers”. DER comprises generation, storage and demand units connected to the distribution systems. In the following analysis options are grouped in four categories: ■ ■ ■ ■
demand response and electrification of other sectors distributed generation distributed storage electric vehicles
The following chapters give a short overview on DER flexibility options. The focus lies on the costs associated to the exploitation of DER flexibility, including investment costs and operational costs. This analysis considers only the extra costs necessary to make DERs flexible (DER flexibility scenario) with respect to the business as usual (BaU) situation (“delta costs” of flexibility). For example, if a smart meter roll-out is already taking place in BaU, the cost of the smart meter is internalized in the BaU scenario and not included in the investment cost to activate DER flexibility in the DER flexibility scenario.
5.1
Demand Response and electrification of heat sector
In future energy systems demand response has the potential to play a key role providing flexibility for system operation. Many studies reveal a huge potential for shifting or shedding options of electricity demand in EU. Most electricity consumers are connected to the distribution grid. Demand response potential can be allocated at industrial, commercial and residential consumers. An increasing number of consumers are becoming prosumers, i.e., also producing electricity in addition to consuming. Additional potential for flexibility lies in the electrification of other sectors, like heating (e.g. heat pumps, direct heating) including dedicated power-to-heat applications. This section analyses in detail the following options: ■ ■ ■ ■
Demand management in industrial installations Demand management in the commercial and residential sector Prosumers Power to heat
20 April 2015
64 A report to The European Commission
Study on the effective integration of Distributed Energy Resources for providing flexibility to the electricity system
Demand response programmes comprise a source of flexibility through the following ways: ■ ■ ■
Demand reduction Demand increase Shifting demand in time
The capital and operational costs to enable flexibility of demand vary significantly depending on the type of consumers. The cost per MW of flexible demand is generally lower for industrial consumers than for commercial and residential customers. In fact, the higher potential for flexible demand for large-scale consumers increases the effectiveness of the costs associated to the implementation of necessary hardware and software assets and to the acquisition of a new client.
5.1.1
Demand management in industrial installations
Industrial demand is shaped by the characteristics of specific industrial processes, and varies among industries. Some industrial installations involve processes that offer a level of flexibility-- the potential to shift energy requirements of the process in time. Examples of such processes include electrolysis (high DR potential, very energy intensive process), cement and paper mills, electric boilers, and electric arc furnaces. Concerning the industrial demand the biggest flexibility potential is to be found in the energy intensive industries. However the switching of industrial loads in energy intensive operations is more complicated than in less energy intensive operations due to the existence of special requirements in the industrial processes. The metal production and the chemical industry provide numerous flexible loads. Other industries with high flexibility potential are glass, ceramics, food, paper, automobile and machinery industry. Although industrial demand response programmes are already developed the unexploited potential of this group is still big. Costs for providing flexibility are generally modest if the primary process is not disrupted. Communication and control equipment is generally already installed at industrial installations. Costs generally relate to change of shifts in personnel, and potentially additional on-site storage of intermediary products. Furthermore administration and marketing costs contribute to the total cost of this option as process managers have to be convinced to use their potential for providing flexibility. The potential of the option is high and is easy to realise, however its realisation will depend on sufficient incentives. Costs associated with reduced production can be high and are usually avoided.
5.1.2
Demand management in the commercial and residential sector
In the residential and in the commercial sector, demand management can especially be applied in cross-section processes such as providing heating and cooling. This includes different levels of electricity demand, e.g. selective timing of the cooling of cold storage warehouses as well as automatic adjustments in the demand of refrigerators. Other potential 20 April 2015
65 A report to The European Commission
Study on the effective integration of Distributed Energy Resources for providing flexibility to the electricity system
demand management technologies include air conditioning, compressing air for mechanical use or even rescheduling of washing processes in households. An important factor to estimate the flexibility potential of demand response is the duration of the implemented programme on each group of customers and more precisely on each type of controllable load. It is estimated that the volume of controllable smart appliances (washing machine, tumble dryers, dishwasher, refrigerator etc.) in the EU by 2025 will be at least 60 GW – shifting this load from peak times to other periods can reduce peak-generation needs in the EU by about 10%. (Seebach, et al., 2009). In order to harvest this tremendous residential potential, investment in information and communication technologies (ICT) is necessary. Smart appliances, home automation and smart meters are the main instruments to tap this potential. ICT technology can facilitate the interoperability of smart devices. Interoperability will depend heavily on standardisation of appliances and of the different communication protocols. The commercial sector makes up 30% of total energy consumption throughout Europe. For these consumers, heating and cooling is the main source of consumption (up to 80%). (European Commission, 2013). According to a holistic demand management programme developed by DENA, in a typical German distribution grid area consisting of all groups of customers, the commercial sector should play a leading role providing the highest flexibility potential among all the three sectors. Especially the heating and cooling systems of commercial customers show a very high flexibility potential (Deutsche Energie Agentur, 2012). Some municipal water systems can provide the direct equivalent to pumped storage hydro by timing the reservoir refill to the needs of the power grid. Pooling of different demand potentials makes use of inherent reservoir storage. Demand response in the residential and commercial sector can be procured manually or automatically. Calculations for DR potentials are very much depending on the assumptions of procurement. If consumers have to react individually to price signals, potential for DR is very low. If appliances are remotely controlled, tremendous potential for flexibility is theoretically available, especially in demand shifting, e.g. in air conditioning systems. At residential level, a significant cost share of a demand response programme consists in the installation of smart meters and of home gateways (energy boxes) and smart appliances for home energy management. However, it should be considered that this enabling infrastructure for residential demand response might be made available by parallel developments in the power system. In particular, the roll-out of smart meters is taking place in several countries due to policy decisions. Moreover, in some context, the penetration of home gateways and smart appliances is taking place driven by a business proposition which is rather centred on home comfort solutions (home security, domotics) rather than simply on energy management. Therefore, in these cases, it could be considered that the cost of the enabling infrastructure for residential demand response largely accrue to external developments, with significant positive impact on the cost-effectiveness of residential demand response.
20 April 2015
66 A report to The European Commission
Study on the effective integration of Distributed Energy Resources for providing flexibility to the electricity system
In this hypothesis, the costs of residential and commercial demand response should include only the additional investment costs for putting in place the residential demand response programmes (e.g. the cost of the aggregation platform of the DR service provider; any additional hardware/software asset) and the operational cost for implementing and running the demand response programme (e.g. customer acquisition and retention; billing; etc.). In case of demand management programmes administrative and marketing costs should be taken into consideration being part of the service/market launch and the whole life cycle of the provided service.
5.1.3
Prosumers
Consumers that possess generation capacity (on their own premises) are summarised as “prosumers”. In the residential sector this can be households that acquired roof top PV panels with integrated battery storage. In the commercial sector, emergency back-up systems are common. They can be used to provide additional electricity in periods of high prices or need for grid management. Industrial customers often have own plants that deliver electricity and heat at the same time (CHP). They can be profitable because of higher efficiency and lower tax burdens. Electricity production from CHP plants can be adjusted according to signals from the market or the grid system (see below). The costs of activating these flexibility providers are low as communication infrastructure is often already installed. Main costs occur because of aggregating the rather small entities.
5.1.4
Power to Heat
Electricity can be used to replace other fuels such as gas or oil for heating purposes. One option is direct resistance heating: an electric current through a resistor converts electrical energy into heat energy. Flexibility is provided by selectively energizing heaters and storing the generated heat for later use. Thermal energy can be efficiently stored in a number of ways, most commonly used are insulated ceramic brick containers and hot water tanks. Heat is released as needed by the end user from storage. Electric heat pump technology offers a more efficient technology to convert electricity to heat. Heat pumps effectively move heat energy from a source of heat (e.g., ambient air) to the end use or storage. Heat pump technology is most familiar in air conditioners and refrigerators. The principle is the same but the direction of heat flow is out of the ambient air from the conditioned in cooling applications, whereas the flow is into the heated space in heating applications. Heat pumps are in fact reversible and can perform both heating and cooling functions— simultaneously in some applications.
20 April 2015
67 A report to The European Commission
Study on the effective integration of Distributed Energy Resources for providing flexibility to the electricity system
5.2
Distributed Generation
Small-scale generation technologies form the first group of flexibility options. It includes: ■ ■ ■
5.2.1
Biogas and biomass power plants Combined heat and power plants Wind and PV (VRES)
Flexibility in biogas power plants
Flexibility on the biogas production itself is possible but very limited. The reaction time expands over several hours to days. It could be ramped to about 50% of the capacity. The anaerobic digestion in biogas production has to run continuously 8760 h/a. More promising flexibility options are biogas storage and CHP operation according to electricity production needs. Biogas storage facilities are usually constructed to store 3 – 6 hours of biogas production and could be enlarged for provision of flexibility. The electricity production via Biogas plants makes use of Gas-Otto-engines which can ramp up and down in seconds. Because of subsidy regulation, high capital costs and the need for the cogenerated heat, they are often run in base-load operation. Additional capacity of the engine could provide flexibility in operation.
5.2.2
Flexibility in combined heat and power (CHP)
Combined Heat and Power plants produce electricity by heat that is generated from a central process. There are three main types of CHP, based on their central operation: ■ ■ ■
Industrial CHP, that mainly produces heat for an industrial process and the power generation follows the variations of the industrial heat demand, Residential CHP, used for district heating which follow daily/seasonal patterns according to the district heat demand, Micro-CHP, which are small-scale installations that are used for local residential heating purposes.
Due to their dependence on other primary tasks (heat production and heat supply), CHP plants often provide little flexibility. In general, heat driven CHP installations do hardly respond to electricity market prices and therefore represent a significant part of inflexible capacity in the system. If a heat storage system is applied, CHP plants can respond to changes in the residual demand and their operation can be optimised to electricity prices. This flexibility could reduce must-run capacity in the system. CHP are typically inflexible resources for the power system as their electricity output is constrained by the heat requirements of the process connected to the CHP. CHP can become provider of flexibility with the integration of heat storage, in order to decouple the generation of electricity and of heat to a certain extent. Investment costs for flexibility of CHP therefore include the installation of heat storage and of an energy management system, possibly with a gateway to receive external signals and commands. 20 April 2015
68 A report to The European Commission
Study on the effective integration of Distributed Energy Resources for providing flexibility to the electricity system
The operational costs of flexibility can be expressed in terms of any economic loss due to additional operational costs from the flexible use of the CHP (e.g. losses in the heat storage; less efficiency of the CHP; higher maintenance costs etc.). It is assumed that the introduction of the heat storage does not affect the heat supply to the industrial/commercial process associated to the CHP.
5.2.3
Flexibility from variable renewable energy sources
Active power control of renewable power plants refers to the adjustment of the renewable resource’s power production in various response timeframes to assist in balancing the system generation and load or congestion management. Wind turbines and PV installations have the technical capability for providing fast response to regulation signals. By curtailing power production, these installations can provide down regulation. Up regulation can be provided by operating units at generation levels below their potential generation value at a given time, and increasing to the normal level if needed. Both operations come at the expense of an overall reduction in VRES output. The integration of higher shares of VRES is a key driver for the power system transformation and the need for new flexibility resources. Their participation in provision of flexibility can thus be a solution with major potential, especially for systems with very high VRES shares. However, there are several challenges to implementing greater VRES controls. First, due to their stochastic nature, provision of flexibility from VRES is related to uncertainty. In addition, even though the installations have the technical potential to perform this task, often the regulatory / market environment present significant barriers. The actual use of the communication infrastructure between grid operator and power unit and the operational framework can pose key limitations to the realisation of this option as well. For example, in systems where renewable energy is subsidised, the renewable producer operates VRES to maximise the produced energy and has no incentive to curtail production. Although, this option faces political and perceptual challenges associated with “wasting” renewable energy, there can be significant cost savings for the power system by more intelligently operating renewable resources. For example, to the extent rapid changes in wind or solar output are expected due to large-scale weather fronts, or partly cloudy conditions, units can be constrained to more limited operating regimes — limiting lost generation to the so-called “rare events” for which large levels of balancing reserves would otherwise be needed. Nevertheless, active control of renewable generation is a common practice in areas with high congestion levels. Flexibility of renewable-based DG is typically related to two actions: 1. Active power control (via curtailment) 2. Volt-var (reactive power) control Investment costs include the equipment to make PV and wind generators remotely controllable. This includes the installation of a smart converter (e.g. smart inverter for PV installations able to control PV curtailment, volt/var regulation, etc.) and any necessary 20 April 2015
69 A report to The European Commission
Study on the effective integration of Distributed Energy Resources for providing flexibility to the electricity system
gateway for remote monitoring and controllability. It is worth mentioning that in a number of countries, also following grid code prescriptions, distributed generation units are increasingly equipped with built-in smart functionalities for their grid interface (e.g. smart inverter). This significantly reduces the additional investment costs necessary to activate the flexibility of DGs, and improves the cost-effectiveness. For existing DG systems, retrofit costs to add smart functionalities should instead be considered in the investment cost of DG flexibility. The operational costs of flexibility is associated to the curtailment of generation (opportunity costs), that can be expressed on a levelised cost of electricity basis. This cost is constantly reducing, due to advances in solar and wind technology and scale effects39. The operational cost of reactive power control is low, and depends on possible impact to the injected active power due to changes in the power factor. It is often assumed that RES-based DGs only can provide down-regulation (via curtailment). In principle, however, RES-based DGs could also provide up-regulation (increase of generation level) if they are normally operated below their nominal capacity.
5.3
Distributed storage
Small scale storage options can provide flexibility on distribution grid levels by enabling timeshifting of local demand and supply. The analysis includes ■ ■ ■ ■ ■
Pumped hydro storage, Compressed-air energy storage (CAES), Battery technologies e.g. conventional (lead acid, lithium ion), high temperature batteries and flow batteries, Flywheels, and Power to gas storage.
It is worth mentioning that storage penetration is constantly increasing worldwide and a rapid expansion of installations is forecasted. For example, according to Information Handling Services, Cambridge Energy Research Associates (IHS CERA), cited by the US Department of Energy,, 340 MW of storage were installed in 2012/2013 worldwide, and installation rate could reach 6 GW per year in 2017, to achieve 40 GW installed by 202240. GTM Research forecasts 720 MW of distributed storage (batteries, thermal and flywheels) to be deployed in the United States between 2014 and 2020 41. Distributed storage assets are installed for the provision of power system flexibility. Therefore the investment costs of flexibility include also the storage asset together with any
39
“Revolution Now The Future Arrives for Four Clean Energy Technologies“, US Department of Energy, available at http://energy.gov/sites/prod/files/2013/09/f2/200130917-revolutionnow.pdf 40
Grid Energy Storage,US DoE report, December 2013; IHS-CERA report ‘The Role of Energy Storage in the PV Industry – World – 2013; 41 http://www.greentechmedia.com/articles/read/Commercial-Energy-Storage-Market-to-Surpass-720MW-by-2020
20 April 2015
70 A report to The European Commission
Study on the effective integration of Distributed Energy Resources for providing flexibility to the electricity system
necessary investment for enabling communication and control capabilities, like the interface with the grid or with distributed generation at prosumers’ premises. In terms of costs, we consider together the capital and operational cost of the storage asset on a LCOE (Levelised cost of electricity) basis. Thus the cost of storage flexibility is expressed in €/MWh on a LCOE basis. It is assumed that the LCOE includes also the investment costs of communication and control equipment. Several studies report a constant reduction of LCOE of storage, particularly of batteries. For example, recent studies estimate that the LCOE of Li-ion batteries will reduce from 700-800 $/KWh [~600-700€/KWh] in 2013 to 300-400 $/KWh [~250-350€:KWh] 42 in 2020 (Rocky Mountain Institute, 2014). These numbers and other information on investment costs are presented in the fact sheets in appendix.
5.3.1
Pumped hydro storage
Pumped hydro (PHS) stores energy mechanically. Electricity is used to pump water from a lower reservoir to an upper reservoir and recovering the energy by allowing the water to flow back through turbines to produce power, similar to traditional hydro power plants. Pumped storage technology is mature, has low O&M costs and is not limited by cycling degradation. Capital costs are higher compared to i.e. gas fired power plants and very specific geographic requirements are needed. Final investment costs depend on size, siting and construction. Pumped hydro storage power plants are common technology and have significant share within Europe. Because of their optimal size, they are typically connected to the transmission network. There are only very few pumped hydro storages installed connected to the distribution grid level in Europe. Their number is not expected to grow significantly in the future.
5.3.2
Compressed Air Energy Storage
In compressed air energy storage (CAES), energy is stored mechanically by running electric motors to compress air into enclosed volumes. For discharge, the electrical energy is fed into the inlet of a combustion turbine. The combustion turbine consumes some fossil fuel in its operation, but it can generate almost three times the energy of a similarly sized conventional gas turbine. A second generation of Advanced Adiabatic CAES technology (AA-CAES) captures the heat energy during compression and returns it by heating the air as it passes to the combustion turbine inlet for carbon free operation. Another approach involves compressing and expanding the air slowly such that it nearly maintains the same temperature. Key barriers to the technology are its efficiency, high capital costs and the specific siting requirements. Also very often a primary fuel source like gas is required for the compressors. CAES technology is more common in US while there are recent projects on small scale and distribution network connection within Europe. 42 42
Considering 1$=0.86 € (currency change at January 2015)
20 April 2015
71 A report to The European Commission
Study on the effective integration of Distributed Energy Resources for providing flexibility to the electricity system
5.3.3
Flywheels
Flywheels are rotating masses that store electricity in the form of kinetic energy. Energy is transferred in and out using a motor-generator that spins a shaft connected to the rotor. To minimise the energy lost during rotation, flywheels are often maintained in a vacuum and rest on very low friction bearings (e.g. magnetic). The rotor is the main component of the flywheel. Rotor characteristics such as inertia and maximum rotational rate determine the energy capacity and density of the devices. The motor-generator and associated power electronics determine the maximum power of the flywheel, allowing for power and energy capacities to be decoupled. Key advantages of the technology are the fast response times and the provision of inertia for grid stabilisation, while key barrier are high investment costs.
5.3.4
Batteries
Batteries refer to electrochemical energy storage technologies that convert electricity to chemical potential for storage and then back to electricity. Batteries can be broken down into three main categories: ■ ■ ■
conventional batteries, that are composed with cells which contain two electrodes (e.g. lead acid, lithium ion) high temperature batteries that store electricity in molten salt (e.g. NAS), and flow batteries that make use of electrolyte liquids in tanks (e.g. Zn/Br Redox, FE/Cr Redox)
Batteries have a very fast response time and high efficiencies, but they have high capital costs.
5.3.5
Power to Gas
Power to Gas refers to chemical energy storage, namely the use of electric energy to create fuels that may be burned in conventional power plants. Key fuel is synthetic methane (and hydrogen to some degree). The procedure consists of two steps: ■ ■
1. Electricity is used in electrolysis to split water into hydrogen and oxygen. 2. Hydrogen is reacted with carbon dioxide to create methane.
Methane is the main constituent of natural gas and therefore can be injected to the existing infrastructure for natural gas (grid and storage). The high storage capacity of the gas grid (e.g. approximately 400 TWh for the German gas grid) could then be used for medium- and long-term storage purposes. A first demonstration project of kW-scale has been built and operated in Germany and a 6 MW plant also began operation in 2013 in Germany. Key strength of chemical storage over some of the other technologies is its high energy density (kWh/m3) compared to most of the other technologies and its high shifting period. Key barrier is the low efficiency.
20 April 2015
72 A report to The European Commission
Study on the effective integration of Distributed Energy Resources for providing flexibility to the electricity system
5.4
Batteries of electric vehicles (EV)
Electric vehicles are expected to play a bigger role in the transport sector. Electric vehicles make use of electricity stored in electric vehicle batteries, selectively charged by the grid when the vehicle is parked at a charging spot. The characteristics of transportation demand allow fleets of EVs to be used as a flexibility option for the power system in two key operational modes: 1. G2V (Grid-to-Vehicle, where fleets of EVs are operated as a DSM option, enabling a shifting of the charging times) or 2. V2G (Vehicle-to-Grid where in addition to charging, the batteries of EVs could be discharged and feed power to the grid) Due to their primary use as means of transportation, the provision of flexibility from EVs is subject to many constraints and is inherently uncertain. EVs form a parallel development. Their investment costs are driven by the transport sector. So far, there is still a lack of business models due to their high costs compared to other transport options. Assuming an increase of EVs due to the need in the transport sector, studies show that available EVs can be a competitive flexibility option because they are expected to be highly available during evening and night time hours (charging at home). During daytime their availability depends on the existence of charging infrastructure in other locations (e.g. work). If the batteries of EVs are used to provide flexibility, their life length is shortened. Therefore, the usage of EVs for flexibility is also highly dependent on the manufacturer of the batteries and the provided warranty. Investment costs to provide EV flexibility relate to the installation of a gateway to monitor and control the charging station and to the on-board EV converter, to ensure smart charging capabilities. Implementation of V2G services requires additional costs to enable bidirectional charging station-EV. However, it could be considered that investments enabling smart charging of EVs are part of the primary use of EVs and thus driven by the developments in the transport sector, and not by the need to provide flexibility to the system. In this respect, it can be assumed that the investment costs to provide EV flexibility are low and could potentially be related only to the additional investments to add V2G capabilities to EV and charging infrastructure. Operational cost of flexibility can be expressed in terms of increased maintenance, reduced efficiency and of reduced battery lifetime due to charging and discharging patterns. In terms of penetration of EVs, it is worth noting that that EV battery costs are significantly reducing, thanks to technological advances and scale effects, and this will favour the
20 April 2015
73 A report to The European Commission
Study on the effective integration of Distributed Energy Resources for providing flexibility to the electricity system
availability of EVs to provide flexibility to the power system. According to the US DoE, the cost of manufacturing an EV battery has dropped by 50 percent between 2009 and 2012 43.
5.5
Role of enabling ICT and communication infrastructure
In general, the presented resources for flexibility on the DSO level are smaller than power plants that are main providers of flexibility in the traditional electricity system. In order to make use of DER to provide flexibility especially on the system level, communication infrastructure is essential. Depending on installed functionalities, smart meters can enable the adoption of dynamic tariffs and the introduction of demand response based on price signals. This requires that Smart Meter data (including price) can be made available to the user. This is not always the case for deployed smart meters but solutions exist to add this functionality. For example, in Italy, the deployment of SmartInfo devices is being trialled out to allow the communication (via power line communication) between the smart meter and the home area network. A number of smart home kit on the market also includes modules to communicate meter data to the energy box44. However, as already commonplace in the US, smart meters could also allow the introduction of demand response programs to mitigate peak events without relying on price signals or direct communication smart meter-energy box. In that case, the utility communicates, via internet, to a smart energy box or a smart thermostat the need to shift consumption on a peak hour for the following day. The consumer is rewarded based on the quantity of reduced consumption which is measured ex-post thanks to the smart meter (e.g. Rush Hour Reward program)
5.6
Sources of value for DER flexibility
Table 1 summarises the key findings and shows qualitatively the technical potential of DER flexibility and the maturity of mechanisms for their valorisation, thus giving an indication of the potential value of DER flexibility in the short-medium term (5-10 years). The table takes into account on the one hand the potential use of DER flexibility to provide system benefits from a theoretical point of view and on the other hand the emergence of regulatory/market mechanisms for the valorisation of DER flexibility. The qualitative evaluation is intended to highlight trends of how sources of value of DER flexibility are becoming available in most mature markets in Europe and US. It does not reflect all possible national market/regulatory conditions.
43
“Revolution Now The Future Arrives for Four Clean Energy Technologies“, US Department of Energy, available at http://energy.gov/sites/prod/files/2013/09/f2/200130917-revolutionnow.pdf 44 e.g. http://www.pluzzy.com/en/home-automation/module-for-electronic-electricity-meterp9#Close 20 April 2015
74 A report to The European Commission
Study on the effective integration of Distributed Energy Resources for providing flexibility to the electricity system
The table’s notation should be thus understood as follows: ■ ■ ■ ■
/ Limited potential value could be exploited in short-medium term + Low potential value could be exploited in short-medium term ++ Medium potential value could be exploited in short-medium term +++ High potential value could be exploited in short-medium term
20 April 2015
75 A report to The European Commission
Study on the effective integration of Distributed Energy Resources for providing flexibility to the electricity system
Table 1. Summary of sources of value by DER flexibility System level
DER
Local level
Balancing
Congestion mgmt.
Portfolio optimizat ion
System adequacy
DSO grid management
++
++
/
+
(active/reactive power control)
/
Limited value due to indispatchabi lity (Value of system adequacy linked to availability in periods of high demand)
Prosumers’ gen/consump tion optimization
++
DG (RES) Via aggregation (Curtailment
Via aggregation(Curtailment)
++
Variable access contracts. Local markets at pilot stage
++
/
/
++
++
(depends on heating storage flex)
(depends on heating storage flex)
(depends on heating storage flex)
(depends on heating storage flex)
(depends on heating storage flex)
(depends on heating storage flex)
++
Via aggregation.
Via aggregation
- Optimize market position -Market bid via VPP
Capacity Market
Bilateral contracts with DSO. Local markets at pilot stage
Use of heat storage
++
++
+
/
++
++
- Via aggregation on AS market. -Owned by TSO (e.g. TERNA)
-Via aggregation on AS market. -Owned by TSO (e.g. TERNA)
- Optimize market position -Market bid via VPP
/
-Owned by DSO (under discussion) -Local markets (pilot level)
At commercial stage; Possibly coupled with PV (Germany, US)
/
/
/
/
+
+
Smart Charging only at pilot level. Limited EV penetration.
Smart Charging only at pilot level. Limited EV penetration
Smart Charging only at pilot level. Limited EV penetration
Smart Charging only at pilot level. Limited EV penetration
Smart Charging just at pilot level. However contribution possible at gridspecific locations
Smart Charging just at pilot level. Contribution possible at Smat home level, in combination with PV, batteries etc
+++
+++
+++
+++
+++
+++
-Via aggregation (e.g. Footroom in the UK)
-Via aggregation (”expertimenta tion n Bretagne by RTE)
- Optimize market position -Direct offers on energy markets (e.g. PJM)
Capacity market (e.g. PJM)
-Bilateral contracts with DSOs (e.g. UK). -Local markets at pilot level (e.g. Nicegrid)
Possibly coupled with DG (e.g. maximization of autoconsumption)
++
DG (CHP)
Storage
EV
DR
Source: Tractebel.
20 April 2015
76 A report to The European Commission
Study on the effective integration of Distributed Energy Resources for providing flexibility to the electricity system
Table 2. Examples of present valorization of DER flexibility and on-going extensions of use, system level
Sources of value
Examples of current valorization of DER flexibility § §
§
System level
Balancing
In France, around 400MW of flexible demand is presently contracted by (RTE) for tertiary reserve (“marché ajustement”). In Germany, monthly auctions are organized to procure up to 3000MW of balancing reserves from fast responding flexible distribution loads (less than 15 minutes activation time or less than 1 second for frequency control). In the UK National Grid contracts downward regulation to prevent wind curtailment at times of high wind generation when electricity prices become negative. Flexibility is provided by flexible loads (demand, storage etc.) which can increase demand and controllable distributed generation (e.g. CHP) reducing electricity generation.
Examples of extension of use of DER flexibility §
§
§
§
Congest.
§
§
Portfolio optimization
§
System adequacy
In France, in winters 2012/2013 and 2013/2014, RTE has contracted 70MW of distribution connected demand response (with a minimum bidding size of 1MW) in Bretagne, to assure supply at peak times in a region which depends on limited interconnections with other French regions In Italy, Terna, has invested in three large energy-intensive battery storage systems with an average capacity of approximately 10 MW and 80 MWh. The scope is to increment the transmission grid’s capacity to absorb renewable power without creating congestions. In Germany, RWE started its first VPP (virtual power plant) pilot project in 2008 (8.6MW) and is expected to manage a VPP portfolio of over 200MW in 2015. DER flexibility is aggregated for optimization of portfolio of balancing responsible parties and retailer In the US, around 10GW of demand response capacity was contracted in the latest capacity market auction for 2017/2018. Enernoc, the largest US aggregators, reports capacity payments of around 185 M$ [160M€] for a total of 4GW of contracted demand response capacity.
On-going trend for reduction of the minimum market bidding size to favour market integration of aggregated DERs Regulation evolving to support inclusion of demand response in energy (e.g. 2014 NEBEF rules in France) and in ancillary service markets (e.g. since 2014 aggregation of distribution-connected DR resources possible in tertiary reserve in Belgium since 2014) In the US, evolution of regulation to reward fast balancing resources (eg. distributed storage)
§
§
/
§
Inclusion of demand-side resources into future capacity markets in UK and France
Source: Tractebel. 20 April 2015
77 A report to The European Commission
Study on the effective integration of Distributed Energy Resources for providing flexibility to the electricity system
Table 3. Examples of present valorization of DER flexibility and on-going extensions of use, local level
Sources of value
Examples of current valorization of DER flexibility §
Local level
DSO grid management
§
§
Prosumersge n/consumpti on optimization
§
In the UK, UK Power Networks has set-up a bilateral contract with the aggregator Enernoc for the provision of demand response service to limit power congestions in selected grid areas and avoid reinforcements. UK Power Network’s business plan forecasts savings of around £40 million [€52M] from DR schemes from 2015 until 2023 In California, utilities have contracts of around 900MW of distributed DR for grid emergency In California, PV+storage systems for residential/commercial customers increasingly have a business case via reduction of peak demand charges. Home energy management systems are being marketed by utilities, telecoms and ICT companies (smart energy boxes, smart plugs, smart thermostats etc.).
Examples of extension of use of DER flexibility §
§
§
DSOs (e.g. Enel,UKPower Networks) piloting storage for grid management DSOs (e.g. in DE) remotely controlling DGs for grid security
Coupled with smart meters, smart thermostats) are increasingly used for residential DR programs in the US
Source: Tractebel.
5.7
Cost effectiveness of DER
In this section, we summarise the cost structure of DER and the main drivers of the expected evolution of power systems in Europe that affect the cost-effectiveness of DER flexibility. The analysis separately focuses on the impact of these drivers on the costs and on the value of DER flexibility. We then draw conclusions on the expected evolutions of the costeffectiveness of DER flexibility, in particular with reference to traditional alternatives like flexible central generation units and network reinforcements.
5.7.1
Cost structure of DER
Table 4 reports a summary of key findings on the typical capital and operation investments to make DER flexible. As mentioned, some of these costs could be avoided (in blue), if external developments (e.g. penetration of smart meters; penetration of EV charging infrastructure) make part of the enabling infrastructure for DER flexibility already available.
20 April 2015
78 A report to The European Commission
Study on the effective integration of Distributed Energy Resources for providing flexibility to the electricity system
Table 4. Capital and operational costs of DER flexibility
DER
Main CAPEX for flex [k€/MW] Smart converter/controller Communication Gateway Integration in a VPP platform
DG (wind)
Smart converter/controller Communication Gateway Integration in a VPP platform Heat storage Smart converter/controller Communication Gateway Integration in a VPP platform
DG (PV)
MiniCHP
Main OPEX for flex [€/MWh]
Curtailment of generation (opportunity cost)
Curtailment of generation (opportunity cost)
Any Loss of efficiency due to heat storage/edriven operation
MicroCHP
Installation of heat storage. EMS, communication infra.
Any Loss of efficiency due to heat storage/edriven operation
Distributed storage (LiIon)
LCOE of the storage asset Smart converter/controller; communication gateway; integration in a VPP platform Chargers with smart converter/controller and
EV
communication gateway. Bidirectional converters for V2G Smart Meter and communication gateway, EMS Integration in a VPP platform Smart meter; communication gateway ; EMS Integration in a VPP platform Smart meter; communication gateway; energy box; in-home displays; smart appliances Integration in a VPP platform
DR Industrial DR commercial DR residential
Any additional cost for performance degradation to due to smart charging and V2G. Very low (assumed that industrial processes are not affected) Low Medium (cost for customer acquisition and retention; running a more complex aggregation platform with several distributed loads)
Source: Tractebel. Evolutions of regulatory and market structures are not considered here. This analysis is carried out in the next chapters of the report.. In the following sections, we briefly present the considered drivers:
5.7.2
Key drivers affecting DER cost-effectiveness
The following five key drivers are found to be the most influential on the development of DER cost-effectiveness. The key argumentation is presented below. 1.
Penetration of RES (large-scale)
Penetration of (variable) RES, particularly wind and solar, is steadily increasing across Europe. Currently, policy incentives have represented a main driver (e.g. 20% target set by the European Commission, feed-in tariffs etc.). As reduction of generation costs of RES continue and reach grid parity, a tipping point could be reached for increased massive penetration of RES.
20 April 2015
79 A report to The European Commission
Study on the effective integration of Distributed Energy Resources for providing flexibility to the electricity system
2.
Penetration of distributed generation
The penetration of distributed generation, particularly renewable based (e.g. photovoltaic), is also dramatically increasing, thanks to policy incentives and reduction of generation costs. In Germany, Denmark and Spain, the penetration of distributed generation is already higher than 40% of total installed capacity. This trend is expected to rapidly continue in several European countries. The rapid spread of distributed generation is completely transforming the way that distribution grid are planned and operated, as bidirectional power flows at local level need to be taken into account. 3.
Electrification of other sectors
The use of electricity is expected to be increasingly extended in a number of energy services, like transport (via electric vehicles) and heat (via heat pumps). In particular, the electrification of a share of the transport sector (via electric vehicles and plug-in hybrids) is expected to generally increase the level of demand of electricity. A strong increase of peak demand can be expected, if no smart charging becomes available. Progress on EV adoption has been slow but penetration is steadily increasing, supported by policy-driven initiatives. For example, in terms of charging infrastructure, the Netherlands will carry out by 2015 a full roll out of a nationwide fast-charging network. In France, from 1st July 2015 all buildings with parking lot (commercial/residential) are required to be equipped with recharging plugs (up to 4kW). In terms of EV penetration, the absolute value of EVs and plug-in hybrid sold in 2013 is still low compared to internal-combustion-engine vehicles; however some countries are starting to witness significant increase of EV sales. For example in the Netherlands EV and Plug-in hybrids accounted for around 5% of the market in 2013. In Norway, during the first quarter of 2014 all-electric car sales reached a record 14.5% market share of new car sales and now 45 EVs represent 1% of the total cars registered in Norway . Therefore it is expected that EV penetration will increasingly have an impact on the evolution of the power systems and, accordingly, on the value of DER flexibility. For example, Smart EV charging could provide necessary demand flexibility in areas with high PV generation where a low net demand during the day and high ramp up of demand in late afternoon could occur. Moreover, the potential of flexibility of EVs is expected to be boosted by its integration with distributed generation and batteries in the Smart Home, to contribute to the optimization of prosumers’ load/generation. For example, according to UBS, in Europe the payback time for unsubsidized investment in electric vehicles paired with rooftop solar and battery storage will 45
http://www.rvo.nl/sites/default/files/2014/01/Special%20elektrisch%20vervoer%20analyse%2 0over%202013.pdf http://www.greencarreports.com/news/1091290_one-percent-of-norways-cars-are-alreadyplug-in-electrics 20 April 2015
80 A report to The European Commission
Study on the effective integration of Distributed Energy Resources for providing flexibility to the electricity system
be as low as six to eight years by 2020. Most favourable conditions are expected in Spain, Germany and Italy. 4.
Energy efficiency
Initiatives to improve energy efficiency are at the core of the European energy policy (e.g. the European Union has set a target of 20% reduction of energy consumption by 2020 compared to a baseline scenario). Energy efficiency is expected to continue to play a transformative role in the future power system. Energy efficiency provides structural reduction of electricity demand including at peak times. 5.
Roll out of smart meters and smart homes
Driven by policy requirements, the roll-out of Smart Meters is taking place in most European countries. According to a recent benchmarking report by the European Commission, 200 million smart meters for electricity (representing approximately 72% of all European consumers) will be installed by 202046. In parallel, even before the installation of smart meters, several consumers are starting to embrace smart home technologies. Smart home systems are already widely available on the market. They include among their functionalities home energy management services (energy box) but more generally provide home comfort solutions, ranging from home security to domotics. In other words, in a number of countries, the smart home development is already taking place, to some extent independently from the implementation of demand response programmes, and is providing the enabling infrastructure for future demand response programmes. In these contexts, it can be assumed that the cost of part of the enabling infrastructure (smart home box, smart appliances, in-home displays, etc.) does not accrue to DER flexibility investments. It appears that the main motivation for consumers to adopt Smart Home systems becoming available on the market is not limited to the energy savings that are currently possible with detailed monitoring of energy consumption, but includes more generally home comfort solutions (domotics, home security etc.). For example it is worth mentioning that several actors (utility, telecoms etc.) are already marketing smart home boxes which include also the energy monitoring functionality via smart plugs. These systems, even without smart meters, allow scheduling, controlling and monitoring the consumption of home appliances using a smartphone. With the introduction of smart meters and of dynamic tariffs, these systems could allow also the implementation of demand response based on price signals, as it is already the case in a number of demand response programs in the US.
46
http://ec.europa.eu/energy/gas_electricity/smartgrids/smartgrids_en.htm
20 April 2015
81 A report to The European Commission
Study on the effective integration of Distributed Energy Resources for providing flexibility to the electricity system
5.7.3
Drivers impacts on cost effectiveness of DER
Table 5 reports the impact of the evolution of the drivers on the need for flexibility in the power system and on the availability of sources of flexibility in the system. For example, the on-going penetration of variable renewables (e.g. PV) determines a significant increase in the flexibility needs of the power system in order to off-set their variability and to mitigate issues on distribution grids that were not designed to host significant amount of distributed generation. In terms of available flexibility in the system, the impact of penetration of variable RES is mixed. On the one hand, it is, pushing out flexible central generators out of the merit order (several GW of gas power plants are being mothballed in Europe) but on the other hand the possibility to active curtailment of variable RES in strategic points of the grid can provide the necessary flexibility to solve distribution congestion issues and increase the hosting capacity for new distributed generators. For what concerns the need for flexibility, as already discussed in chapter 2, we note that the on-going evolutions of the power system, particularly the penetration of RES, DGs and electrification trends, are increasing the need for flexibility at system level (global flexibility gap) as well as at local level driven by the high penetration of distributed generation (local flexibility gap). Concerning the role of traditional sources of flexibility in the system, we note two key trends: 1. The cost-effectiveness of central power plants is negatively affected by the on-going penetration of RES and DG. Firstly, an increase of operational costs and of the wear and tear of the equipment is observed due to operation at suboptimal operating point and due to higher cycling frequencies (Troy, et al., 2012). Secondly, the reduction of capacity factor of peaking plants brings the economic rentability of flexible central under strain. Finally, due to their remote position in higher voltage levels of the system, central power plants cannot access sources of flexibility value at local level and contribute solutions to close the local flexibility gap. 2. The cost-effectiveness of reinforcements is negatively affected by the on-going penetration of RES and DGs. Traditionally, reinforcements for DG hosting capacity are typically decided under worst-case planning scenarios (fit and forget 47). This practice becomes infeasible or too expensive with increasing penetrations of DGs as the nominal capacity of the new grid assets is used only a few hours per year (as explained in the examples in section 2.2.5). Finally, network reinforcements are
47
This analysis should be done on a case-by-case basis, as it depends on local circumstances. However fit and forget is in fact likely not to be an optimal solution from a society point of view, especially when a large number of DGs needs to be connected. It is true in fact that the maximum allowable DG capacity connection is usually calculated based on deterministic procedures and assuming the worst case scenario, i.e. maximum substation voltage, minimum network loading conditions and maximum DG output power. Nevertheless, the simultaneous occurrence of all these conditions is not likely, which means that there is considerable room for improvement, if appropriate control actions are developed for network operation (e.g. possibility to modulate active and reactive power of DGs). 20 April 2015
82 A report to The European Commission
Study on the effective integration of Distributed Energy Resources for providing flexibility to the electricity system
increasingly facing public opposition, with higher uncertainties, long delays and higher permitting costs. As a consequence, new opportunities to enable DER flexibility are becoming available, and overall the potential value that DER flexibility can capture is strongly increasing. Table 5. Impact of drivers on flexibility needs and flexibility available Impact of drivers on FLEXIBILITY NEEDS
Impact of drivers on AMOUNT OF FLEXIBILITY AVAILABLE IN THE SYSTEM
Increase of balancing needs (higher variability of net demand)
Mothballing of central flexible units due to economic and technical strain: Higher cycling costs and sub-optimal operating conditions; lower capacity factors Increase of available (downward) flexibility due to higher potential for RES curtailment
Increase need of market actors to hedge against volatility of prices
/
Increase of flex needs for DSOs’ congestion management
Distributed generation providing locational flex to DSOs and, via aggregation, global flex to system level
Increase of need for optimization of generation/demand profiles for prosumers (e.g. auto-consumption)
/
/
Enabling residential/commercial demand response Increase for flex supply, particularly at local level (DSOs’ and prosumers’ needs), and, via aggregators, also at system level.
DRIVERS
Penetration of RES
Penetration of DG
Penetration of smart meters/smart home devices
Energy efficiency
Possible reduction of flex needs due to lower peak demand (both at system/ local level). Possible increase of flex needs due to higher variability of net-demand
Electrification (EV, heat pumps)
Increase of flex needs to avoid higher peak demand (needs at system and local level)
Less potential for demand response (part of value of demand response already captured by energy efficiency) Increase of available flex supply (system land local level). Higher potential for peak load shifting (via demand response) via heat pumps, EV, airco etc. (e.g. possibility to synchronize EV charging to periods of high PV production )
Source: Tractebel analysis Table 5 summarises the impacts of the drivers on the evolution of the potential value associated to DER flexibility. In the table, a positive impact is highlighted in green, a negative impact in red.
20 April 2015
83 A report to The European Commission
Study on the effective integration of Distributed Energy Resources for providing flexibility to the electricity system
Table 6 and Table 7 reports the impact of the drivers on the evolution of the costs of DER flexibility. In the table, a positive impact is highlighted in green, a negative impact in red. We can observe two main dynamics which are leading to the reduction of costs of DER flexibility: 1.
On-going evolutions in the power system are leading to the deployment of infrastructures which enable DER flexibility and reduce its implementation costs:
■
Penetration of EVs and charging infrastructure (driven by transport policy incentives), provides part of the enabling infrastructure for activation of EV flexibility. Penetration of smart meters (driven by policy decisions), is laying the foundations of the enabling infrastructure for activation of demand flexibility. Penetration of smart home devices, mainly driven by domotics market developments, is laying the foundations of the enabling infrastructure for activation of demand flexibility, particularly at residential level.
■ ■
2. ■ ■ ■
■ ■
Technological evolutions are significantly reducing the cost of DER flexibility Constant reduction of LCOE (levelised cost of electricity) of RES reduces the opportunity cost of DG curtailment Constant reduction of LCOE for distributed storage and of reduced uncertainties over its charging/discharging performances reduces the cost of storage flexibility Manufacturers increasingly provide built-in smart functionalities in converters for DG-grid connection (e.g. smart inverters). Increasingly baseline assets are smartgrid ready (in other words the delta cost, compared to the BaU, to activate DER flexibility is reduced). Reduction of EVs cost due to scale effect On-going standardization in Europe is expected to drive down device costs and transaction costs due to lack of interoperability
20 April 2015
84 A report to The European Commission
Study on the effective integration of Distributed Energy Resources for providing flexibility to the electricity system
Table 6. Impact of drivers on the value of DER flexibility Value from flexible DG
DRIVERS
Value from EV smart charging
Value from distributed storage
Value from DR
Penetration of RES
Higher flex needs for balancing (system level)àHigher value to provide flexibility
/
Higher flex needs (system level)àHigher value to provide flexibility, especially to meet net-demand.
/
Penetration of DG
Higher flex needsàHigher value to provide flexibility for DSOs grid management, also at planning stage, to defer grid investments and to increase DG hosting capacity.
Higher value to provide flexibility for DSOs grid management, also at planning timeframe
Higher value to provide flexibility for DSOs grid management, also at planning timeframe Higher value to provide flexibility to prosumers to optimize generation/demand
Higher value to provide flexibility for DSOs grid management, also at planning timeframe Higher value to provide flexibility to prosumers to optimize DG/storage
Penetration of smart meters/smart home
/
Higher value to provide flexibility to prosumers for load/generation optimization
Higher value to provide flexibility to prosumers for load/generation optimization
/
Energy efficiency
/
/
Lower demand (including peak)àlower potential for demand response. On the other hand, lower demand means higher share of net demand with high variabilityàpotential high value for fastramping flexible loads.
/
Electrification (EV, heat pumps)
/
Higher value to provide flexibility for DSOs grid management, also at planning timeframe
Higher peak demandàHigher value due to higher potential of peak load shifting
/
Technological evolutions
Higher flexibility (e.g. volt/var control range) thanks to progresses in smart converters
With storage capable to meet stricter charging/discharging constraints, higher flex value by accessing more flex remunerations. Future opportunity of V2G (No commercial availability yet)
Higher potential thanks to integration of smart devices enabling automated demand response with minimal human intervention
With storage capable to meet stricter charging/discharging constraints, higher flex value by accessing more flex remunerations. Lower costs due to uncertainties and risks of battery warranty.
Source: Tractebel
20 April 2015
85 A report to The European Commission
Study on the effective integration of Distributed Energy Resources for providing flexibility to the electricity system
Table 7. Impact of drivers on the cost of DER flexibility, cont.
DRIVERS
Cost of flex from DG-RES
Cost of flex from EV
Cost of flex from DR
Cost of flex from distributed storage
Penetration of RES (policy driver)
-Scale effect is driving down LCOE of DG/RES
/
/
/
-Scale effect is driving down LCOE -For
certain
of DG/RES application,
Penetration of DG (policy driver)
-DGs increasingly reduction due to equipped with
/
/ integrated
converters with DG+storage built-in smart system design functionalities (e.g. smart inverters) -Reduction, as cost of DR flex
Penetration of smart meters (policy driver)/smart home (domotics market driver)
CAPEX mostly internalized by on-going /
roll-out
of
smart
“smart
home”
/
/ meters
and
assets (e.g. smart appliances; energy boxes)
Energy efficiency (policy driver)
/
/
/
/
-Reduction, as cost of EV flex CAPEX -Reduction
of
mostly internalized costs of batteries
Electrification (EV, heat pumps)
by EV and charging /
/ infra
thanks
to
scale
investments effect due to EV
(driven by transport penetration not
by
power
system needs) -Reduction of costs due to -On-going reduction -Reduction of costs
standardization, more active
-On-going
due
consumer
reduction of LCOE
standardization and
participation/awareness, scale
of
scale effects
effectàlower transaction costs,
storage
of LCOE of DG-
Technological evolutions
RESàreduction
to
of
opportunity cost of curtailment larger VPP platform
Source: Tractebel.
20 April 2015
86 A report to The European Commission
distributed
Study on the effective integration of Distributed Energy Resources for providing flexibility to the electricity system
5.7.4
Cost effectiveness of DER flexibility – Main messages
This chapter has provided a qualitative assessment of the evolution of the cost-effectiveness of DERs to address the global and local flexibility gaps identified in chapter 2, in particular with reference to traditional options like central flexible generation and reinforcements. The analysis aimed at: ■ ■
Assessing how cost-effectiveness of DER is evolving, by analysing the evolutions of the costs of DER flexibility and of the sources of value associated to it. Carrying out a qualitative comparison of the evolution of cost-effectiveness of DERs to provide system flexibility over traditional options (central flexible generation, local reinforcements).
A number of key drivers affecting the cost-effectiveness of DER flexibility has been identified and analysed, such as on-going penetration of variable RES, particularly at distribution level and reduction of their generation cost; on-going roll-out of smart meters; on-going penetration of Evs and charging infrastructure; on-going market penetration of smart home kits and smart home devices (e.g. smart thermostats). In particular, we have analysed how each driver impacts the overall need of flexibility in the power system and the availability of flexibility means in the system. The main points that can be extracted from this chapter are the following: Flexibility options from DER are available. Plenty of controllable demand, storage and generation units are connected to distribution grids. They need communication infrastructure to provide flexibility on the global level and local level which in many cases is available due to parallel developments. The potential value that DER flexibility can capture is strongly increasing On-going developments in the power system are clearly leading to an increased value of flexibility in the system, both at system and local level,. In particular, at local level, with the growing penetration of distributed energy resources, flexibility increasingly shows a locational value (e.g. flexibility to solve congestion in the distribution grid). This creates significant opportunities for DER flexibility, as DERs are in principle able to provide flexibility at both system and local level. Technological evolutions are reducing the cost of DER flexibility. Levelised cost of electricity from VRES and distributed storage decrease constantly, thus reducing the opportunity cost of curtailment as a source of flexibility. Manufacturers increasingly provide built-in smart functionalities in their DG-grid converters and baseline assets are increasingly smart-grid ready. Economies of scale reduce the costs of electric vehicles (EV) and the ongoing standardisation in Europe is expected to drive down device and transaction costs thanks to improved interoperability. Likewise the cost of distributed storage technologies like batteries are steadily declining, making them increasingly competitive in stand-along applications to provide grid services or to be integrated in behind the meter applications (e.g. in conjunction with PV systems). 20 April 2015
87 A report to The European Commission
Study on the effective integration of Distributed Energy Resources for providing flexibility to the electricity system
A number of on-going power system developments are expected to act as catalyst for the cost-effectiveness of DER flexibility –A number of on-going market, technological and policy developments are contributing to the set-up of an enabling infrastructure to activate DER flexibility. For example: The on-going penetration of EVs and of charging infrastructure offers the potential for new flexible electricity demand when smart charging programs or dynamic recharging tariffs are added. (Smart EV charging could for example provide necessary demand flexibility in areas with high PV generation where a low net demand during the day and high ramp up of demand in late afternoon could occur.) The on-going penetration of smart home devices, including energy related devices (smart thermostats, smart energy boxes, smart plugs etc.), which are triggered mainly by on-going developments in the general domotics market, already provides energy monitoring and control functionalities on the consumer side, even without smart meters. The on-going roll-out of smart meters, coupled with upcoming smart energy boxes and smart appliances (see previous point), would enable demand response programs to activate demand flexibility (e.g. via price signals). In a scenario where smart energy boxes, smart appliances etc. are already appearing in the market thanks to domotics developments, the cost of demand response developments would be reduced and consumer adoption incentivized. Cost-effectiveness of DER flexibility is on the rise overall. On-going evolutions in the power system are leading to the deployment of infrastructures which enable DER flexibility and reduce its implementation costs: ■
■ ■
Penetration of EVs and charging infrastructure (driven by transport policy incentives), provides part of the enabling infrastructure for activation of EV flexibility. Penetration of smart meters (driven by policy decisions), is laying the foundations of the enabling infrastructure for activation of demand flexibility. Penetration of smart home devices, mainly driven by domotics market developments, is laying the foundations of the enabling infrastructure for activation of demand flexibility, particularly at residential level.
The potential value that DER flexibility can capture is strongly increasing. How market changes might enable DER options to provide flexibility in economic terms will be further elaborated in the final report. Flexibility can be provided by both supply and demand as well as by energy storage. Physical or institutional extensions of market areas and changes in market regulation can also open access to flexible supply and demand resources in both time and geography.
20 April 2015
88 A report to The European Commission
Study on the effective integration of Distributed Energy Resources for providing flexibility to the electricity system
6
Linking supply and demand of flexibility – the value chains
This section will briefly present the existing typical market places for electricity, followed by the different market mechanisms related to flexibility provision/procurement.
6.1
Different trading arrangements related to flexibility
6.1.1
Time horizons
In order to have a satisfying and efficient linkage between providers and procurers of flexibility it is crucial to have suitable remunerations, and a sufficient planning horizon. Depending on which need, and which provision of flexibility one refers to, different remuneration and planning horizons are appropriate. In general, there are two different remuneration mechanisms; activation and capacity remuneration. Additionally, penalization can be applicable as the avoidance of costs can provide the appropriate incentives for efficient operation. One or several of the remuneration/cost mechanisms can be combined in order to achieve the optimal incentive(s) for a successful and effective integration of DERs. Capacity remuneration may be suitable whenever the frequency and usage is uncertain, which is often the case of products that are typically activated a couple of hours during one year, if at all. An example of such products/services could be demand adjustment in order to meet extreme demand peaks, hence ensuring security of supply during hours with very high demand possibly in combination with plant outage(s). Demand adjustment can be used during these (rare) events to ensure security of supply and system adequacy. As certain investments are needed in order to activate the demand response during these events, a certain remuneration level is required in order to ensure a profitable investment. With capacity remuneration mechanism providers are remunerated for keeping capacity available whenever needed. It is not rare that the capacity is furthermore remunerated when activated additionally to the capacity remuneration. For the products that are activated frequently with a high probability and that can be continuously traded, capacity remuneration is of less importance. A concrete example would be portfolio optimization which will be continuously balanced, possibly on the intraday market, and where flexibility will be traded as products (volumes of energy). Here the (likely automatic) activation of e.g. demand response could be remunerated via activated volume, however possibly in combination with capacity payments. Different services/products are anticipated to have different planning horizons and participants, thus requiring different market places. Furthermore, some services are expected to be less suitable for deregulated market places and competition, and could possibly be handled by technical requirements, rather than through markets. For example local voltage problems due to local generation could potentially be resolved via technical requirements in the generation equipment.
20 April 2015
89 A report to The European Commission
Study on the effective integration of Distributed Energy Resources for providing flexibility to the electricity system
Figure 32. Mapping market places, actors, planning horizon and flexibility provision.
Table 8. List of abbreviations used in Figure 32 above.
Source: Sweco The different linkages between provision and demand for flexibility, and the corresponding value chains market places and time horizons is illustrated in Figure 32 above. The abbreviations and their corresponding value chains are illustrated in Table 8. The methodology applied for the classification of the planning and trading frame is based on the anticipated frequency of activation (often means less need for investors to have a fixed 20 April 2015
90 A report to The European Commission
Study on the effective integration of Distributed Energy Resources for providing flexibility to the electricity system
remuneration, e.g. capacity remuneration), consequences (redundancy and alternative resources in the case of delivery failure) and a suitable planning horizon (in order to ensure adequacy and supply of demand).
6.1.2
Arrangements for acquiring resources
The different types of markets and linking provision and demand of a certain product can be designed in many different ways. Broadly the following types of procurement mechanisms exist: a. Direct bilateral contracting b. Tendering c. Markets/auctions d. Regulation/grid code e. Tariff design Direct bilateral contracting do not take place through any exchange, but via direct communication between two parties (possibly involving a broker). The bilateral agreements are not necessarily structured, i.e. they can be formulated in order to fit the needs and preferences of the involved parties, e.g. in theory they could have any time horizon or format. This is one of the benefits of bilateral contracting, compared with other procurement designs. Due to this, the bilateral contracts can be used for a wide range of services. A con of nonstandard bilateral contracts is that the traded services can be hard to compare with other similar non-standardized products, thus making it less transparent and stimulating liquidity. This pushes for the need for participants to have a high degree of product valuation and insight, and could potentially lead to speculation in the value/costs for the counterpart providing a particular service. Tendering is in its simplest form a call from a user of a certain product/service. The call for tenders includes the prerequisites of the particular service (could be activation time, minimal/maximal bid size, location, etc.). The providers of the service/product can formulate their bids according to the prerequisites and the most beneficial bid(s) is(are) accepted. One of the benefits with tendering would be the ability to customize the bids/requirements; the major con would be the lack of standardization in order to stimulate liquidity and competition from the supply side (if the prerequisites vary). The administrative burden is higher than other mechanisms. Markets/auctions is in practice operated via continuous trading (bilateral agreements and trading of standardized products) or via gate closure (auction). Both of these designs require a certain level of standardization of products, and stimulate liquidity and competition. The auctions enables the market operator to gather bids (liquidity) and clear the market according to the most beneficial (often price) offers, and to remunerate participants either via pay-as-bid or marginal pricing. In the case of continuous auctions pay-as-bid applies. The benefit of using markets/auctions is that services/products are forced into standardization and therefore stimulating competition and liquidity. The con would be lack of customizability and therefore might favour certain technologies and/or actors participation on the market and possibly be ill-fitted for specific needs/demands of certain actors. If many different variations of in principle the same service is procured, in order to cover all the different preferences of 20 April 2015
91 A report to The European Commission
Study on the effective integration of Distributed Energy Resources for providing flexibility to the electricity system
all different needs (possibly flexibility) two challenges potentially arise. The different products will start to compete about the same resources, and a competitive actor will always allocate his provision to the market that remunerates the highest. Combining this with many different traded products, the supply & liquidity might be reduced, resulting in increased risks of market power and poor market operation. In order to find the optimal product portfolio of flexibility products the fundamental needs should thus be well-defined, and the standardized products should be composed based on those definitions. The optimal mix of traded products and services is expected to vary with various market regimes and technological characteristics. Regulation is another alternative for acquiring services. This is materialised via technical requirements in order to ensure the system operation, and is already today a reality via technical constraints on generation from generation units (e.g. a particular generator is not allowed to exceed a certain level of reactive power, etc.) and on large scale consumers (industrial equipment should have a maximal level of flicker, harmonics, etc.). For example, the Swedish TSO require that BRPs that have a planned ramping of generation of 200 MW or more between two consecutive hours, have to start their ramping 15 minutes before the hourly shift (e.g. at hour XX:45), and end their ramping at 15 minutes past the hourly shift (e.g. at hour XX+1:15) and ramp linearly. The result is smoother ramping of generation, thus reducing the need for flexibility (balancing power) during the hourly shifts. A con of introducing such a prerequisite is that it might favour certain actors, potentially creating a barrier for non-beneficial actors. Furthermore, related to the Swedish example with ramping above, is that certain requirements could possibly be solved more efficiently via market mechanisms (e.g. a third party BRP might have cheaper/better regulating resources available), rather than “self-ramping” as a BRP. The benefit of such regulations is that the need for regulating power is reduced. Different tariff designs will lead to different incentives. Previously an example of time-of-use tariffs in France have been made48, where certain demand response has been achieved and thus reducing the peak load by a certain amount by having higher retail prices during periods when capacity is limited. There are many different tariff designs, which all provide their specific incentives; ■
■
48
Progressive tariffs give incentives on energy efficiency, rather than reducing system peaks and/or providing flexibility. A progressive tariff is in its simplest form a charge per kWh (unit cost) which is increased with increased consumption. If a particular end-user manages to reduce the energy consumption, the cost will be reduced. Another paradox is that the usage of electrical heat pumps rather than oil fired heating might be penalized as the electrical energy consumption will increase and thus the unit cost of energy (progressive tariff). Power-based subscription. The highest load a particular end-user of electricity puts on the grid during the particular settlement period, yields a cost (e.g. Y EUR/kW/month). This will give the end-user incentives into minimizing the maximal load during each settlement period. Assuming the peak load of a given See footnote 27 on page 47.
20 April 2015
92 A report to The European Commission
Study on the effective integration of Distributed Energy Resources for providing flexibility to the electricity system
■
■
consumer co-varies with the system (could be local and/or global), this will reduce the system peak load. Time-differentiated power-based subscription. Same as above but with different rates depending on when the dimensioning load occurs (e.g. during off-peak hours a high load will not be problematic as the system is “off-peak”). Provides incentives into minimizing the load during certain hours (e.g. peak-load) during each settlement period. Dynamic pricing tariff. The dynamic pricing tariff is a tariff that is varied depending on the state of the system. If the system has abundant supply/capacity, the price signal will be to use more electricity (lower, theoretically even negative, cost of electricity consumption) and in a constrained supply/load situation the price signal will be the opposite (expensive to consume). The difference between the time-ofuse tariffs and the dynamic tariffs is mainly that the ToU originates in peak/offpeak hours (easy to forecast even with long planning horizon) whereas the dynamic tariffs will consider the current state of the system, not necessarily following the traditional peak/off-peak pattern.
Worth mentioning is that more customizability is not necessarily the best suited solution when designing the appropriate tariff structure. With complexity (e.g. dynamic pricing) comes a trade-off in transparency and predictability, which have to be balanced with the benefits attained.
6.2
Existing market places – a brief overview
As described above there are several different ways of acquiring resources, where different organised market places are one important way. This section provides a brief overview of existing categories of organised market places where flexibility could be acquired. Depending on the market regime the market products and places varies. The products typically range from years ahead (financial products and capacity remuneration mechanisms) to close to real-time products (balancing market) before delivery. The gate closure (ending of the trading period) for different products also varies with the market regime, even if significant progress have been made in harmonising the markets across the European member states. Until now the most progress of harmonisation has been achieved for the day-ahead markets across the member states. Broadly speaking, there are two sectors in the power sector; the regulated and the deregulated sector. The regulated sector include DSOs and TSOs, due to the fact distribution/transmission of electricity is a natural monopoly. The TSO procures resources for ensuring a safe and satisfactory real-time operation of the transmission grid, in order to ensure that the demand is met at all times. These resources have traditionally been procured from central producing units, owned by firms operating in the competitive part of the power market (deregulated) providing a link between the regulated and the deregulated part of the power market. The DSO however has historically had less interaction with the deregulated part of the sector. Since the distribution grids traditionally are operated passively, it is not common in that the DSO procures ancillary services (unlike the TSO). The methodology applied has rather been “fit-and-forget”, meaning incentives of “over-investment” in grid 20 April 2015
93 A report to The European Commission
Study on the effective integration of Distributed Energy Resources for providing flexibility to the electricity system
capacity is not necessarily avoided. Many DSO regulations also ban the DSO from procuring (“trading”) energy, making it literally illegal for DSOs to procure energy services. Thus there might be a gap between the DSO and market places in certain regulatory regimes.
6.2.1
Difference between capacity and energy remuneration mechanisms
Although the European market model often has been described as an “energy-only” model, i.e. a market model where remuneration is based on delivered energy, this has never been the complete picture. Different types of capacity or availability payments have been adopted in many markets with different forward looking horizons. An example of capacity payment is primary reserves auctions (and for several of the other products on balancing markets) are in some cases held daily for the next day (e.g. Denmark, Sweden) and in other cases there is a weekly auction (e.g. Germany). As the primary reserves are “non-energy”, the purchased product is capacity rather than energy. For the balancing products with a longer activation time (Frequency Restoration Reserve (FRR), Restoration Reserve (RR)) the remuneration is often by both capacity (MW) and activation (MWh). The purpose of the capacity remuneration would be to ensure that sufficient resources are available.
6.2.2
Capacity remuneration
Different types of capacity remuneration mechanisms are in place in several countries in Europe, and additional capacity markets have been decided on or are under consideration. For example a number of countries, such as Ireland, Italy, Spain, Portugal and Greece have had different capacity remuneration mechanisms for a number of years. The schemes vary significantly in design. Currently capacity remuneration mechanisms are discussed or already introduced in additional countries (Great Britain, France), again with differences in the market design. In the US capacity markets are common, and demand side participation plays a significant role in many of these markets. However, it is often welcomed that capacity markets are also open for demand side resources and for aggregators. In addition the detailed requirements, e.g. activation rules, may have a significant impact on the possibility of demand side resources to participate in capacity markets. In addition to the broader capacity market schemes there are more targeted schemes in place. Sweden and Finland both have had strategic reserves for a number of years, including both generation and demand side resources (also open for aggregators). Strategic reserves can be problematic for the functionality of the power market, in particular if the activation rules are not set in a proper way. Originally the purpose of the strategic reserves in Sweden and Finland was to ensure that sufficient physical resources were available and it was bid in as regulating power. Later on it also become possible to use the reserve to ensure market clearing in the day-ahead market. The principle is that it is activated after the last commercial bid (demand or supply bid). However the reserve is shifted towards introduction of demand side participation and it is required that at least 25% of the reserve should originate from the demand side. Since 2011 demand side resources in the reserve can also bid into the day-ahead market. The motivation for this is to have the demand side resources taking part in the price formation in the day-ahead market. While this in principle could distort the market the argument is that while the generation resources would not be available at all
20 April 2015
94 A report to The European Commission
Study on the effective integration of Distributed Energy Resources for providing flexibility to the electricity system
without the strategic reserve, the demand side resources would exist as long as the owner is using electricity in its (industrial) process. Norway is an energy constrained market. The TSO runs a regulation power options market to secure sufficient upwards regulation. More interestingly as an example is however the energy options market (ENOP). The energy options can be used to reduce consumption during a period of the winter season if a highly strained power situation arises. If the energy options are called the resource owner should down regulate an agreed energy volume (X MWh/week), but is free to determine when of the day or week this down regulation should occur. The down regulation should be in relation to the normal consumption specified in the bid. Due to the specific requirements on the resources (geography, volume, flexibility etc.) this is not a standardised product, but the Norwegian TSO evaluates bids based on the benefits to the system and the cost elements. While there is no formal lower consumption level to be eligible to bid (apart from hourly metering), in reality it is larger electricity customers (power intensive industry) that will be accepted. The remuneration to the resource owners consist of one options premium corresponding to the annual costs of participation and a strike price corresponding to the costs connecting with the TSO utilizing the options. The different markets operate on different time horizons, see figure below for an illustration of the planning horizon and typical chronology.
6.2.3
Future and forwards markets
The future and forwards markets are financial markets, where sellers, buyers and traders of electricity can manage their risks by buy/selling/trading financial contracts for electricity for future delivery. The financial contracts are varying in length, the most common ones include; yearly, quarterly, monthly and weekly contracts. Often it is also divided into base and peak load, referring to specific hours during the week (peak), or throughout the delivery period (base). The coupling between the financial market and the physical market is done by the day-ahead and intraday markets.
6.2.1
Day-ahead market 49
The day-ahead market (DAM) is a spot market where supply and demand is met for the following day. A spot price is cleared for every single settlement period (often hourly, but depends on the local market design) for the following day, based on the bids that market participants placed before the clearance of the DAM auction. Significant progress has been made in harmonizing and integrating the different DAM regimes throughout Europe during the last years, where the successful price coupling in the North-Western Europe (NWE) project, coupling the Nordic, GB and Central Western Europe spot markets in the DAM auction during February 201450. Flexibility could in theory be included on the DAM by a number of different bid types:
49 50
Committment for physical delivery. http://www.nordpoolspot.com/How-does-it-work/European-Integration/NWE/
20 April 2015
95 A report to The European Commission
Study on the effective integration of Distributed Energy Resources for providing flexibility to the electricity system
■
A price sensitive demand/generation bid, which is cleared if below or equal to the marginal price Conditional block bid, e.g. if the price during a number of hours is on average below a certain level, then the consumption(or generation) bid is accepted Flexible bids, meaning that a certain energy volume is requested during one or several of the hours within the following day. This energy volume is cleared for the cheapest hours constraint to the bid size and level
■ ■
The naming and type of bids allowed varies between the different power market exchanges, however with the price coupling of the different European exchange using the EUPHEMIA 51 algorithm the support for different bid types is harmonised and each connected power exchange has support for each bid type.
6.2.2
Intraday market
The intraday market (ID) serves as a complement to the DAM, where the trading horizon is shorter (trade allowed closer to delivery). The market design of the ID differs across the European member states. The level of harmonisation is relatively immature for the intraday compared to the harmonisation of the DAM, thus limiting the ability for cross-border trade across Europe. Both continuous trade and gate closure is applied for various European market regimes. Spain and Italy for instance uses an auction based market clearing procedure, whereas the Nordic region uses continuous trade. Furthermore, hybrid solutions (i.e. both auction and continuous trade) are being discussed and are considered likely to be implemented for different markets (e.g. EPEX SPOT in Germany).
6.2.3
Balancing markets
As the load and injection into the grid needs to be precisely balanced in every moment in time, any deviation between load and generation is balanced by the TSO. The TSO ensures that the grid is balanced by using the procured resources and real-time control (frequency restoration reserve) combined with other (slower) products (frequency restoration reserve, restoration reserve). A particular imbalance during a given imbalance settlement period is resolved by the TSO, and the concerned balance responsible parties are either billed or credited the actual imbalance energy volume and price ex-post. The calculation of the imbalance price differs between different market regimes. Settlement period and imbalance pricing is more elaborated upon in later sections of this report, see below. In theory demand response can be used for balancing, and is already today used for balancing in for example Finland and Austria.
6.3
Regulated markets
Both the TSO and DSO are regulated monopolies. As such they need to comply with certain regulatory requirements. They should for instance be neutral market facilitators, rather than active market participants. This limits the range of actions that TSOs and DSOs can take also regarding capturing the value streams from flexibility. Today market places exist that are 51
http://www.epexspot.com/en/market-coupling/pcr
20 April 2015
96 A report to The European Commission
Study on the effective integration of Distributed Energy Resources for providing flexibility to the electricity system
operated by regulated authorities, and where the entire demand originates from these authorities (e.g. balancing markets). Furthermore, in some market regimes the regulated authorities are active on the deregulated market as an actor (e.g. TSO and the German intraday). The regulated markets are different from the deregulated markets, since one of the transaction sides are represented by a regulated actor. The regulation needs to balance incentives carefully, in order to promote both neutrality and efficiency, thus ensuring a wellfunctioning continuous operation. Related to flexibility and DER, aggregators are likely to be needed, and one or several of their revenue streams are expected to originate from regulated markets. The regulated markets can generally be divided into two blocks; the DSO and the TSO. The TSO has experience of operating balancing markets, and the traditional suppliers have been the centralised generators. In a transition towards flexibility provision from DERs the TSO needs to handle the change of suppliers, which might push for a change of regulation of balancing markets as the traditional rules might be less efficient in the new regime. Additionally to the TSO-operated balancing market there might be need for a similar market place with ancillary service transaction, however operated and controlled by the DSO in collaboration with the TSO. Naturally, these two market places will affect the other, and should thus be coordinated and (probably) jointly operated. In addition to the “real time” balancing market, there are the long-term needs for flexibility (e.g. long-term peak-shaving, generation adequacy via strategic reserves, etc.) which also are operated by the regulated actors in some market regimes. The demands for flexibility that are expected to be relevant for the regulated actors can be observed in Table 9.
20 April 2015
97 A report to The European Commission
Study on the effective integration of Distributed Energy Resources for providing flexibility to the electricity system
Table 9. Table of flexibility provision related to the regulated actors Service
Function of service
Flexibility offering party
Flexibility user
Peak shifting (i.e. shifting the peak demand)
Long term congestion management Generation capacity adequacy
Aggregated (or individual) industrial and commercial users Aggregated domestic customers
DSO, TSO
Demand adjustments (manual/automatic)
Short term congestion management Generation capacity adequacy
Aggregated (or individual) industrial and commercial users Aggregated domestic customers
DSO, TSO
Balancing services
Frequency control
Aggregated (or industrial and commercial users) Aggregated distributed generation
TSO
Generation adjustments
Short term congestion management Grid losses reduction
(Aggregated) distributed generation
DSO, TSO
Curtailment products
Short term congestion management
(Aggregated) distributed generation (Aggregated) industrial and commercial users Aggregated domestic customers
DSO, TSO
Reactive power (mandatory)
Voltage control
(Aggregated) distributed generation
DSO, TSO
Source: EG3, Section 1: Flexibility The following section will describe each value stream presented in Table 9, in the same order as presented in the table above. In addition to describing the value streams, we also outline a few stylized example business cases. Peak loads in electricity demand increase total costs of the system. The total peak demand determines the necessary grid capacity on TSO as well as on DSO level. Generation capacity has to be provided to cover every peak in demand, which is costly. DER can reduce peaks in demand on the DSO and TSO level by shifting demand from times of peak demand 20 April 2015
98 A report to The European Commission
Study on the effective integration of Distributed Energy Resources for providing flexibility to the electricity system
to times with lower demand or by shedding the load, i.e. cutting demand. The value chain will include two or three actors; the provider (industrial or domestic consumers), possibly an aggregator (intermediary), and the TSO/DSO (end-user)). Depending on the number of providers, or the capacity of the average provider, the need for an aggregator is varying. The level of sophistication in the communication infrastructure and automation level of activation will also play an important difference in the need for aggregators. The providers of flexibility are likely to be remunerated by a capacity payment due to the long planning horizon (longterm), and the risk for local markets (DSO). The alternative measure (reinforcing the grid) has a (very) long planning horizon which further pushes towards capacity remuneration for an adequate planning horizon. These capacity remunerations could potentially be combined with an activation fee. Challenges for an efficient implementation are mainly related to firmness of supply (voluntary or mandatory activation), DSO regulation and the inclusion of the flexibility remuneration in the revenue cap (increased OPEX). Other related challenges are conflicting interests with the BRP during activation of the flexibility if successfully deployed in a large scale. This will yield an imbalance from the scheduled portfolio demand. This indicates the need for coordination between the market participants, or adjustments accordingly ex-post. Peak-shifting for (generation) capacity adequacy (Security of supply long-term) value chain is foreseen to include two, or three, participants; the provider (industrial or domestic consumers, possibly an aggregator (intermediary), and the TSO/DSO (end-user)). The remuneration is via capacity remuneration, and the trading horizon is foreseen to be relatively long-term (yearly). Another alternative is ToU tariff schemes, which have proven to be useful in long-term peak-shifting. For the ToU tariff schemes there is no (obvious) need for an aggregator. One of the challenges might be reduced predictability for exactly when the need for flexibility (“shifting”) is needed in a system with significant generation from VRES, thus making the “scheduling” of equipment to consume during “off-peak” harder as off-peak is dependent on the weather. A conflict could arise between the grid needs and the balancing needs, e.g. a BRP could be imbalanced while the grid is under significant load (assuming “opposite balancing directions” demanded), why the signal from these two actors could be conflicting. The “optimal” hierarchy should be following the law of physics, e.g. the grid should be superior to market incentives if conflicting (market model fails to adequately reflect the needs of the system). The needed equipment for communicating signals/activation could be the same as for several other value chains, for example for shortterm demand adjustments.
20 April 2015
99 A report to The European Commission
Study on the effective integration of Distributed Energy Resources for providing flexibility to the electricity system
Business case A: DSO demanding flexible resources Motive: DSO require flexible resources in order to reduce (long-term) grid investments Primary value driver: Reduced CAPEX Additional value sources: Congestion management, ancillary services to TSO, rebalancing the position of BRPs Implications: OPEX likely to increase. Full CAPEX reduction likely not to be immediate. Involved participants: DSO, owners of DER (end-users, distributed generation, storage), aggregators (possible)
DSO TSO DER owners
Aggregators DER owners
Market (e.g. BRP)
Key barriers: §
Economic regulation of DSOs generally provides weak incentives/possibilities for CAPEX/OPEX optimization, in particular over time. The DSO may not be able to replace reduced CAPEX with increased OPEX in the regulated revenue. In particular this is likely to be the case if OPEX increases precede CAPEX decreases.
§
DSO’s possibilities to trade energy are limited due to vertical unbundling. The DSO may therefore not be able to capture additional value sources through transactions with TSO and market participants.
20 April 2015
100 A report to The European Commission
Study on the effective integration of Distributed Energy Resources for providing flexibility to the electricity system
Business case A: DSO demanding flexible resources (cont.) Key barriers (cont): §
Aggregators likely to be important. Regulatory environment for aggregators is difficult in many MS, relating to the legality of aggregators, acceptance of aggregated demand or absence of a regulatory framework for DER.
§
In order to capture the full value stream DER owners or aggregators need to have multiple relationships with DSO, TSO and other market participants. Therefore, roles and responsibilities of the different actors should be clearly defined in a market model. Due to these multiple relationships it may be more difficult to coordinate the needs of DSO/TSO/market. This is likely to increase the importance of aggregators/intermediaries. On the other hand using a common platform or market place for all DER services could make coordination less complex.
Conflicting interests: §
DSO/TSO/market needs may not be aligned at all point of time. Priority of flexibility needs have to be defined, with possible compensation for parties negatively affected.
§
TSOs have platforms for procuring resources. Depending on setup the liquidity on these platforms could either be improved or drained.
§
Imbalances may be created for BRP if flexible resources are activated without coordination with the BRP, unless there is regulation ensuring that imbalances from activation are not attributed to BRP or flexibility is measured separately per DER owner.
20 April 2015
101 A report to The European Commission
Study on the effective integration of Distributed Energy Resources for providing flexibility to the electricity system
The underlying value of demand adjustment for short-term congestion management is reduced costs for re-dispatch (historically remunerated/activated by TSO on the transmission grid; in principal a similar role could be taken by the DSO). Re-dispatch actions are needed when the transmission capacity is insufficient for the scheduled/actual requests on the grid. In order to ensure the operation of a grid, the system operator needs to procure and activate congestion management (traditionally by ramping up/down (central) generation units on each side of the congestion). Rather than ramping up generation on one side of the congestion, the immediate balance could be satisfied via a reduction of load (short-term demand response). A conflict could, again, occur between the system operator activating the demand response without notifying the BRP or disregarding the incurred “imbalance” ex-post and cancel the financial impact from the imbalance penalty. A synergy could arise with the longterm congestion management and the dynamic ToU communication infrastructure as the needed IT-communication and product activation might be similar. A feasible solution could be a regulation where the DSO is allowed to adjust demand/generation once or a few times per year when problems are expected to arise, rather than dimensioning the grid for 100 % (overinvestment into grid capacity), this requires possibly the need for a change of the regulation for the DSO. Balancing services for the TSO is basically divided into energy and non-energy products. The non-energy products includes the primary regulating power (“FCR”) which is, on average, not resulting in any net energy during the activation as it will vary naturally around the set point (set generation or consumption level). Therefore, the FCR is usually not remunerated by energy units, but rather capacity (EUR/MW/Hz). The “energy-products” (“FRR” & “RR”) includes slower products, and can result in energy units during activation. From a traditional perspective the different products have been procured and remunerated via both a capacity and an activation component, which is foreseen to be the case for the future transactions as well. The value of flexibility is expected to originate from several streams: a. more (central) generator capacity available for the wholesale market as less generator capacity will be reserved for ancillary services b. Costly ramping of ramping generators will be more expensive compared to the (competitive) demand resources c.
Increasing liquidity and competition on the supply side of the regulating markets, lowering costs for the system
d. Enabling more intermittent power generation to be balanced as the supply of balancing power will increase compared to a scenario without DER. The TSO procures resources (“capacity”) with different time horizons in the various member states, ranging from months to days before delivery. The energy products could in theory interfere with the BRP if activated volumes are not accounted for in the settlement calculation ex-post. However this should be a relatively small challenge as the TSO should have the necessary overview in order to include activation in the imbalance settlement 20 April 2015
102 A report to The European Commission
Study on the effective integration of Distributed Energy Resources for providing flexibility to the electricity system
calculations ex-post without too much need for coordination. Traditionally the balancing power has been supplied by central generators, meaning that it has been relatively easy to measure activated energy for balancing. This is still the case for consumption which is metered and balanced explicitly, however for profiled end-users the reference point and activated energy might be harder to quantify. Statistical measures and methodologies could be applied for the ex-post settlement, which details are to be agreed upon. Balancing products require generation/load increase and reduction. They can be provided by demand and supply sources as well as storage facilities on DSO level. The value chain for generation adjustments for short-term congestion management used by the TSO/DSO is anticipated to have 2 or 3 participants; the distributed generation facilities, an aggregator (intermediary) and then the final user of flexibility (TSO/DSO). As the generation adjustment from VRES is asymmetric, i.e. only curtailment of generation due to non-programmable units, in the case of wind and solar power the flexibility transaction might be dependent on the usage and support of such asymmetric products. Assuming a scenario where the flexibility is required to be offered symmetrically (technical requirements), the output of generation facilities will be limited below the maximal available output in order to offer the extra generation which will effectively mean at a close to zero or negative value, assuming remuneration based on dispatched energy. A prerequisite for symmetry drives for an opportunity cost for non-programmable generators if participating on the balancing market. The opportunity costs are likely to be relatively high, however should easily be included in the bids for short-term congestion management. If the bids (including opportunity costs) are competitive, they should be accepted. Generation adjustments and curtailment products can be used to avoid or decrease the need for reinforcement and investments into the grid. In this section we assume that the adjustment and curtailment will reduce generation output. In the case of distributed generation, which is often non-programmable, the need for generation adjustment and curtailment products are likely to occur if high generation co-occurs with rare events such as significantly low load, e.g. during periods when load is low, which then will lead to excess local/regional generation which exceeds the grid capacity. Rather than dimensioning the grid for these (assumed to be) rare occasions, the curtailment/adjustment of generation can be applied ensuring grid stability. In principle the cost for the producer can be interpret as the opportunity cost, meaning the remuneration the producer would have received for the, theoretically, energy generated. The value of the flexibility is equal to the avoidance of CAPEX, which should be weighed against the opportunity cost (cost) mentioned above. The value stream of generation adjustment will include two or three participants; the provider (generator), the optional intermediary aggregator, and the DSO/TSO. The opportunity cost can vary; one concrete example is the spot price and feed-in tariffs (FITs). The true opportunity cost is likely to be closer to the spot price rather than the FITs. The balance responsible party will be affected by curtailment or generation adjustment, if the adjustment/curtailment is not included in the generation schedule. In practice, assuming a certain market design, the TSO and DSO publishes the available grid capacity and the market is cleared based on this capacity. Assuming that the true grid capacity is insufficient in transmitting the scheduled dispatch, there is need for adjustments and possibly re-
20 April 2015
103 A report to The European Commission
Study on the effective integration of Distributed Energy Resources for providing flexibility to the electricity system
dispatch. The relevant BRP will then have the production plan adjusted accordingly, possibly leading to an imbalance and financial consequences. Reactive power and power quality has historically been “procured” via requirements and grid codes for generators/consumers. Depending on the actual regime, the different minimum technical requirements have been prepared and adopted by the relevant parties (TSO, DSO, NRA). This can be translated into that this is not a product that is being “traded”/”procured” as such, but rather forced into the system by setting the minimum connection criteria.
6.4
Unregulated markets
While all markets have some basic regulatory arrangements we refer to the supply/trading and generation of electricity as unregulated markets. Market participants need to comply with certain requirements, but are not subject to sector specific monopoly regulation. The unregulated procurers of flexibility mainly include traders and BRPs. The value streams related to the unregulated market are presented in Table 10 below. Table 10. Table of flexibility provision related to the unregulated actors Service
Function of service
Flexibility offering party
Flexibility user
Peak shifting (i.e. shifting the peak demand)
Long term congestion management Generation capacity adequacy
Aggregated (or individual) industrial and commercial users Aggregated domestic customers
BRP
Demand adjustments (manual/automatic)
Short term congestion management Generation capacity adequacy
Aggregated (or individual) industrial and commercial users Aggregated domestic customers
BRP
Source: EG3, Section 1: Flexibility Peak-shifting for portfolio optimization (both long- and short-term) is a value chain that generally involves two, or three-four roles; the provider (industrial or domestic consumers (provider), possibly an aggregator (intermediary), the BRP (end-user or trader), and possibly a third party BRP (end-user)). The portfolio optimization could basically originate from two demands; resolving inevitable forecast errors (both consumption and generation) by revising consumption so that the scheduled positions are fulfilled during the imbalance settlement period or as a traded product in order to balance other third party BRP portfolios. The underlying demand is similar; utilizing consumption flexibility in order to balance portfolios at a (more) efficient cost. There are several challenges that need to be resolved in the successful deployment of this flexibility provision; 20 April 2015
104 A report to The European Commission
Study on the effective integration of Distributed Energy Resources for providing flexibility to the electricity system
■
■
■ ■
Metering and the measurement of activation in the case of profiling. As there is no “reference consumption” for a single end-user settled under a consumption profile it can be challenging to assess the actual level of activation and distinguish between contributors and “free-riders”. Most likely statistical methods will need to be established and agreed upon, and distributional effects (“free-riders”) are likely to occur. Remuneration of “participating” end-consumers (e.g. domestic consumers) could vary significantly. Annual discount on the tariff, remuneration via activation or possibly via a capacity payment. Controlling (activation) and firmness of appliances/activation. The planning horizon for activation. This can relate to both domestic and industrial end-users of electricity. A concrete example could be certain industrial consumers that, assuming an adequate planning horizon, can reschedule their processes thus revising their “base-case” consumption schedule. For the long-term consumption the planning horizon is likely to be adequate, however for short-term it is less likely. The planning horizon is assumed to be highly consumer-specific, meaning it will have to be agreed upon bilaterally.
The remuneration is foreseen to mainly be via capacity payments ahead of delivery, however traded relatively short-term continuously. An automatic activation is considered likely (due to large number of end-consumers) in the case of an aggregator, thus having relatively small capacities of demand adjustment but large number of flexibility-portfolio participants. There are expected to be synergies with the other long-term peak-shifting value chains as the needed equipment for control and activation. Furthermore, the grid needs in terms of longterm peak reduction is likely to co-occur with the portfolio needs for long-term peak reduction, indicating synergies. The long-term peak shifting will vary from the short-term as this will require a larger degree of planning and partnership between BRP/portfolio manager and the end-user. The need for coordination between BRPs and the TSO/DSO is smaller for long-term peak shifting compared to short-term since the market is expected to learn and adapt to possible changes in long-term peak shifting. Therefore this is not expected to lead to any systematic imbalances due to a lack of coordination. The short-term peak shifting is likely to lead to a need for coordination, since this is anticipated to be harder to respond and adapt to. The different roles both on the regulated and the deregulated sections of the market are expected to be effected significantly from demand response, please see section 7.2.2 for the role of an aggregator and demand response.
20 April 2015
105 A report to The European Commission
Study on the effective integration of Distributed Energy Resources for providing flexibility to the electricity system
Business case B: Demand response in day-ahead market Motive: Peak shifting, reducing peaks or filling valleys Primary value driver: Reduced system cost, reduced cost for end-customers Additional value sources: Possible reduction in grid investments/reduced congestions; reduced market power, synergies with energy efficiency measures Likely implications: Troublesome including demand response in the price formation in the case of reactive end-consumers, price spike demand response might yield new price spikes in surrounding hours and incur imbalances. If the global need is not aligned with the local need for demand response, conflict might arise. Involved participants: DER owners, aggregators, BRP, other market participants
DAM Could be either or, depending on the market regime
DER owners
owners
Traders/BRP
Aggregators
TSO/DSO
DER owners Key barriers: §
Small scale of DER limit cost effectiveness of market participation.
§
Market design, product definitions and regulatory barriers creating difficulties for DER and aggregators
§
Limited interest of demand side flexibility from many customers.
§
Low share of end-consumers exposed to spot prices, e.g. no direct incentives for participation.
20 April 2015
106 A report to The European Commission
Study on the effective integration of Distributed Energy Resources for providing flexibility to the electricity system
Business case B: Demand response in day-ahead market (cont.) Key barriers (cont): §
If large scale penetration, the inclusion of demand response in the price formation is crucial in order to ensure an efficient and successful integration.
§
In order to capture the full value stream the implementation cannot only include DR on the DAM, but should include energy efficiency, BRP services and ancillary services which demands coordination (and valuation) of the flexibility between several markets/time horizons. This can be hard and complex in reality, pushing towards centrally coordinated (control) demand response.
Conflicting interests: §
DSO/TSO/market needs may not be aligned at all points of time. Priority of flexibility needs have to be defined, with possible compensation for parties negatively affected.
§
The need for demand response will vary in time as the load/supply balance is inevitably changing with the weather (wind and solar irradiation). Furthermore, if the full value stream is captured, several markets and gate closures will “compete” for the same resources (demand response), which naturally leads to conflicting interests if not coordinated. There is a risk of selling the same flexibility with several time horizons and to several market participants, this should be avoided.
§
Imbalances may be created for BRP if flexible resources are activated without coordination with the BRP, unless there is regulation ensuring that imbalances from activation are not attributed to BRP or flexibility is measured separately per DER owner
20 April 2015
107 A report to The European Commission
Study on the effective integration of Distributed Energy Resources for providing flexibility to the electricity system
Business case C: BRP demanding flexibility for balancing of portfolio Motive: Reducing deviation between actual position and scheduled plan Primary value driver: Reduced imbalance costs. Additional value sources: Possible reduction of TSO procured balancing resources, reduced costs for portfolio managers leading to reduced costs for end-consumers, ability to balance larger shares of RES. Likely implications: Difficulties in quantifying theoretical balance and activation without metering, more complex operation with BRP reacting to deviances between scheduled and actual position, speculation in system imbalance (depending on dual/single price). rd
Involved participants: DER owners, aggregators, BRP, 3 party BRPs.
Exchange
3rd party traders/BRP TSO
Could be either or, depending on regime
Traders/BRP Aggregators DER owners
DER owners
Key barriers: §
Small scale of DER limit cost effectiveness of market participation.
§
Regulatory environment for aggregators is difficult in many MS.
§
Finding the appropriate technology and methodology for remuneration. Finding the correct imbalance cost incentives, “not too high nor too low” in order not to create a barrier for new (small) market participants.
20 April 2015
108 A report to The European Commission
Study on the effective integration of Distributed Energy Resources for providing flexibility to the electricity system
Business case C: BRP demanding flexibility for balancing of portfolio (cont.) Conflicting interests: §
The BRPs need to communicate with the TSO in order not to jeopardize the system stability by real-time balancing their portfolio while the TSO activates balancing energy (overbalancing)
§
In this case BRP is buying services from the aggregator or directly from DER owners. Other arrangements could create conflicting interests between aggregator and BRP/third parties.
20 April 2015
109 A report to The European Commission
Study on the effective integration of Distributed Energy Resources for providing flexibility to the electricity system
6.5
Imbalance responsibility and imbalance settlement
The outcome of the aforementioned markets is a schedule for both generation and consumption of electricity. The schedule is with a certain temporal resolution, and each time step is defined as an imbalance settlement period. Furthermore, each actor on the physical power market has a balance responsible party (BRP). In brief the BRP is financially liable for any imbalance between the scheduled consumption/generation and the actual outcome. The imbalance responsibility and imbalance settlement are two fundamental cornerstones of any electricity market. In several market designs the calculation and pricing of imbalances differs between conventional generation, consumption and renewable generation. Simply defined, energy imbalances are the difference between a BRP’s contracted positions and what is actually delivered or consumed in real time over a given timeframe known as the imbalance settlement period (ISP). To keep and/or restore balance in real-time, TSOs purchase balancing services from pre-qualified market participants referred to as Balance Service Providers (BSP). To hedge the risk that BSPs may not submit enough balancing energy bids in real-time, TSOs sometimes procure balancing capacities ex-ante. Imbalance settlement is the process by which a BRPs’ energy imbalances are settled at an administratively determined price. Ideally – and according to the Network Code on Electricity Balancing - the general objective these arrangements should be to incentivise market participants to minimise their imbalances in an efficient way, and to allow TSOs to cover their costs for balancing the system. This means that all market participants should be financially responsible for keeping their contracted positions balanced over the imbalance settlement period, and that imbalance charges should capture the costs to the TSO of balancing the system. This is not always the case in current national imbalance settlement arrangements.
6.5.1
Imbalance responsibility for RES
Variable RES generation has historically been totally or partially exempted from balance responsibility in several European countries, while in others they have balance responsibility in line with other market participants. The rationale for socializing the costs for RES imbalances is a desire to encourage electricity generation from renewable energy sources, and market arrangements that have not been deemed suitable to generation that cannot accurately predict its output in the day-ahead timeframe. Electricity trading takes place in several different timeframes: forward, day-ahead, intraday and balancing or real-time. The target model for the internal European market puts an emphasis on the day-ahead timeframe, when buyers and sellers hedge the price and volume risk associated with delivery in real-time, and the first binding schedules for delivery every hour of the following day is determined. Inherent errors in day-ahead forecasts for variable RES generation result in suboptimal day-ahead schedules. Assuming that gate closure for the day-ahead market is at 12 noon, generation (and consumption) schedules are determined 12 to 36 hours before delivery. The existence of liquid intraday markets where BRPs can adjust their positions (schedules) is therefore paramount if variable RES is to be exposed to its imbalances. The timing of 20 April 2015
110 A report to The European Commission
Study on the effective integration of Distributed Energy Resources for providing flexibility to the electricity system
intraday gate closure, i.e. the final chance for BRPs to adjust schedule before the TSO takes over is also important, as the accuracy of forecasts improves closer to real time. Figure 33. Uncertainty of a wind power forecast as a function of forecast horizon, wind power in Denmark, year 2012. (higher value on the vertical axis means higher uncertainty)
Source: Data from Nord Pool Spot, calculation by Sweco. Variable RES generators in many countries have therefore argued, often with success, that variable RES should be exempt from imbalance charges. Some countries have opted for making TSOs or independent companies BRPs for small and variable RES generation. However, as shares of variable RES generation increase as a result of generous incentive policies, the socialized costs to consumers have increased. In some countries this has led to requirements concerning more accurate forecasting to improve schedule accuracy, which often materializes in more cost-reflective imbalance settlement charges for all market players.
6.5.2
Imbalance settlement
The length of the imbalance settlement period and how imbalances are priced differs in the different European countries. Concerning imbalance pricing there are two major approaches to imbalance pricing: single or dual. Under a single pricing scheme, the price BRPs pay (if short) or receive (if long) will only depend on whether the total system imbalance in a given imbalance settlement period is positive or negative. In a dual pricing scheme, the imbalance price for BRPs that have imbalances that extend (aggravate) the net imbalance of the transmission system in a given imbalance settlement
20 April 2015
111 A report to The European Commission
Study on the effective integration of Distributed Energy Resources for providing flexibility to the electricity system
period is different from the imbalance price applied to BRPs whose imbalance alleviate system imbalance. Depending on which type of pricing scheme is applied the incentives to be in balance will differ. If a participant is remunerated for mitigating the system imbalance, incentives will be given to speculation in the system imbalance. This will help balancing the system, however on the other hand this could in theory result in a situation where the TSO has to balance two imbalance origins (the original imbalance and the speculation imbalance if wrong). On the other hand, providing a regime which does not fully reflect the imbalance costs will dampen the signal to the market participants, thus reducing the incentives for forecasting correct and accurate physical positions. Depending on which mechanism applies, the market value of flexibility will vary. In both single and dual pricing, the cost for procuring balancing capacity ex-ante may be weighted in the imbalance price, but this is the exception rather than the rule. These costs are usually socialised via transmission grid tariffs. In general, dual pricing is regarded as detrimental to variable RES development due to the inherent uncertainty of weather forecasting: ■
■
■ ■
Prices in balancing markets are usually higher than day-ahead price so the price spread in dual imbalance pricing can be significant. This is further aggravated in markets with large shares of variable RES and much price volatility, making imbalance prices difficult to predict. The spread should provide a signal for participants who can control their positions to do so. For participants that have difficulties in balancing, large spreads may place a significant cost on their businesses. For example, independent wind generators or small suppliers without the benefits of a diversified portfolio will have a greater proportion of their volumes exposed to imbalance pricing. In general, regulators are concerned that imbalance pricing should accurately reflect the costs that renewable generators’ variability may impose on the system without unduly penalizing these parties. Imbalance prices based on marginal pricing tend to be more extreme than prices based on average prices, and are thus less favourable to RES generation. In some countries there is concern that the whole approach where energy-related and systems related balancing actions are financed separately is becoming obsolete with increasing shares of RES generation and increased risk for network congestion. In most countries, imbalance pricing schemes encourage participants to be in balance without taking network constraints into consideration. This may lead to behaviour where efforts by participants to avoid imbalance charges leads to increased system-balancing costs for TSO’s, and it may also lead to market power issues.
For these reasons, some countries have opted for different balances for conventional generation, variable RES generation and consumption, with single pricing applying for variable RES and consumption, and dual pricing for conventional generation. Also, some countries (Belgium) apply single pricing which becomes dual pricing if the net system 20 April 2015
112 A report to The European Commission
Study on the effective integration of Distributed Energy Resources for providing flexibility to the electricity system
imbalance over a particular imbalance settlement period exceeds a certain amount MW. This may also apply to the BRPs imbalance. In what follows three different market regimes will be described in the pricing of imbalances. The market design varies, and could to some extent be expected to be a function of the energy mix.
20 April 2015
113 A report to The European Commission
Study on the effective integration of Distributed Energy Resources for providing flexibility to the electricity system
7
Roles and relations in the market
7.1
The current model
Today’s market designs are mainly formulated around the concept that electricity is (centrally) generated and consumed in the other (distributed) end. Most system services originate from central generators, and usage of electricity is considered to be highly static/inelastic (“vertical demand curve”). With the introduction of VRES and the fundamental change of the power sector, the interdependence between central generation and distributed consumption is changing. In such a transition, alternative market design and new business models are important, and necessary in order to ensure an efficient integration of distributed energy resources. The market is anticipated to have more roles and actors, and the relations between market participants will be changed compared to the traditional roles. A concrete example of changing roles and responsibilities is the transformation from strict consumers into prosumers, consumers that produce. Furthermore, the demand side will start to respond to certain signals, demand response. Additionally, energy storage schemes and small-scale generation response will possibly take part of the market. This will have different effects on the power market mainly depending on the regime and service/product offered by the distributed energy resources. This section aims to present a principal relation-scheme between the different actors on the market and their roles, from both a traditional and a future perspective. The market designs across Europe vary both due to the actual system requirements but also due to historical circumstances and traditions. The details of a certain market regime thus vary, and the roles and therefore relations for different actors can vary between different regimes. The general ongoing transformation towards the European Target Model aims at harmonizing (or patch) the market design in order to facilitate integration.
20 April 2015
114 A report to The European Commission
Study on the effective integration of Distributed Energy Resources for providing flexibility to the electricity system
Figure 34. Market roles and relations - traditional perspective. White filled arrows indicates a contractual agreement, the transparent arrows indicates a flow of energy (and the direction).
Source: Svensk elmarknadshandbok, modified by Sweco Figure 34 provides a simplified, high-level overview (focusing on a “distributed level”) of the market design, showing partly the complexity and interrelations between the different actors. Here follows a description of the roles in a traditional context.
7.1.1
Transmission system operator, TSO
The TSO is responsible for the balance between load and generation on the grid, and is covered under the regulated section of the power market. The balance is ensured by maintaining the nominal grid frequency (50 Hz in Europe). The TSO also holds an important function on the deregulated market; reporting the transmission capacity to the market operator so that the market auctions and clearance does not violate any of the transmission constraints. Furthermore, the TSO is responsible for the physical and financial settlement between different market actors, mainly via the balance responsible parties. In order for the TSO to calculate the balance of each BRP, meter values are collected (and profiling values are calculated) from the relevant actors. The actual actors’ supplying this data differs depending on the market regime. The TSO operates the grid in real time, and based on the frequency deviation balancing power is activated. In theory the balance could be maintained by either increasing/decreasing load and/or consumption. Load and generation operate in the opposite direction, e.g. reducing generation will practically have the same effect as increasing the load (consumption). The frequency relates to the short-term balance between demand and supply in the transmission grid, whereas the long-term balancing of demand and supply is materialized by ensuring the adequate generation capacity and transmission capacity.
20 April 2015
115 A report to The European Commission
Study on the effective integration of Distributed Energy Resources for providing flexibility to the electricity system
7.1.2
Distribution system operator, DSO
The DSO is responsible for the distribution of electricity, and ensuring that the needed grid capacity is available in order to perform this service adequately with a sufficient level of quality. The DSO is covered under the regulated section of the market. A “fit and forget”approach has historically often been applied to the DSO task of ensuring adequate distribution grid capacity, yielding passive grid operation. The DSO is sometimes responsible for metering consumption and/or production within a particular grid, and then reporting the meter values to the relevant actors. Handling and distribution of metering data is however not necessarily covered by the DSO.
7.1.3
Central generator
The central generators will likely, in the foreseeable future, still play an (highly) important role. The system will not be able to operate without considerable contribution from these central generators who will contribute not only with injection, but also inertia52 that will ensure sufficient frequency quality. The central generators will however compete with the DERs, both on the regulated and on the unregulated markets. The central generators mainly generate electrical energy, which they sell. Additionally to the dispatched energy they provide system services, which are not necessarily measured in energy units but rather power. The central generators are (primarily) operating on the unregulated side of the market.
7.1.4
Supplier
A supplier basically has one task, providing clients with electricity. In order to fulfil this task they procure electricity from traders and/or generators, and they sign wholesale agreements with their clients. Much simplified the deviance between these two, the procurement costs and the wholesale costs will yield a suppliers margin. The supplier has a number of obligations when supplying clients with electricity and for each supplier there must be a balance responsible party. The balance responsible party could be the same entity as the supplier, however not necessarily.
7.1.5
Balance responsible party
The BRP (balance responsible party) is expected to have a more complex role in the future as the need for balancing, and coordination between other actors/roles on the power market will increase with a successful integration of DERs. Historically the BRP would take careful consideration of making accurate generation schedule plans, and resolving any imbalance using the generation side, while the consumption side has been static (vertical load) and relatively predictable. Depending on the market regime, the incentives for balancing portfolio(s) varies. The BRP signs an agreement with suppliers, and the suppler and BRP could in theory be the same entity with both roles. The BRP will charge a supplier a fee for
52
Inertia helps maintaining the nominal frequency since any sudden outages are ”dampened” temporarily. A higher inertia will yield a slower frequency change, thus increasing the technical response time of primary reserves. 20 April 2015
116 A report to The European Commission
Study on the effective integration of Distributed Energy Resources for providing flexibility to the electricity system
balancing generation/consumption, which varies depending on the expected predictability and variability.
7.1.6
Consumers
The consumers have historically, generally speaking, had a (short-term) inelastic demand of electricity. Furthermore, relatively non-existent incentives for helping the system have been made available for the end-consumers. The end-consumers have been distributed, thus yielding a distributed, non-informative consumption of electricity. The cost of electricity has typically been socialised, and focus on tariff composition has rather been simplicity than (more complex) incentivizing rate plans. The end-consumer have not taken an active part in the operation of the grid. The end-consumers have had electricity readily available to consume from the grid, and there has been a unidirectional flow of electricity from the grid towards the end-consumers premises. Many of the operational costs (e.g. ancillary services, variations in the spot price, seasonal variations) have been flattened out and have none or little pass-through in the retail and distribution costs of electricity. The roles will depend on the actual market design and the final flexibility transactions. The final markets and products should be based on what is economically and practically optimal, both from a geographical but also from a technological point of view. E.g. demand response should only be promoted and introduced on the market if it can serve needs more efficiently than the alternative “service”.
7.2
Changes in roles and responsibilities in a future model
7.2.1
Roles and responsibilities
Above we briefly described the traditional key roles in the power market. These traditional roles will remain, but there will be new and changes of roles. In order to fully capture the value of flexible DER we foresee that those roles will be adapted accordingly and also that new roles will become important. The roles described in the following can be fulfilled by different actors and combined in various ways. However, there will also be some key relationships that will have to be defined and/or clarified. With the introduction of DERs and VRES, the energy flow will change and the operation and roles will be revised. Originating from the same model as above, new actors, roles and relations are introduced, and the traditional roles are revised (Figure 35). The energy flow changes from unidirectional to bidirectional in the distribution grid, as endconsumers are occasionally producers (when generation exceeds load locally) and generation facilities are connected at lower voltage levels compared to the traditional generation schemes. With this fundamental change, there will be need for new roles and actors in the system (e.g. energy storages, aggregators). The traditional value chains (transactions) might change, and new value chains are expected to emerge with the introduction of new demands, provisions and technologies. Different market players will have different roles in the integration of DERs. As there are several different market designs and 20 April 2015
117 A report to The European Commission
Study on the effective integration of Distributed Energy Resources for providing flexibility to the electricity system
technological characteristics in Europe, there is no one-model-fits-all for an efficient and successful integration of DERs. Figure 35. Market participants and relations – DER context. White filled arrows indicates a contractual agreement, the transparent arrows indicates a flow of energy (and the direction).
Source: Svensk elmarknadshandbok, modified by Sweco
7.2.2
Aggregators
The aggregators will most likely play a (very) significant role for the integration of DER. As the large number, small-scale category of DERs are integrated further into the market (possibly transactions with TSO, DSO, BRPs, Suppliers), the need for an aggregator is probable. The aggregator role could be taken by a number of different actors. It could for instance be the same entity as the supplier/BRP, in principle even the DSO or TSO, however with a significantly different role. It could also be independent aggregators. In order to stimulate competition and innovation it is important that not only established market participants can take on the role as aggregators. Both the regulated and unregulated part of the electricity market is potentially of interest for an aggregator, and a particular aggregator could theoretically operate on both the regulated and de-regulated sections of the power market simultaneously. Concrete examples of regulated activities are the distribution of electricity (DSO) and flexibility provision/procurement, whereas unregulated activities mainly relates to the wholesale market. Depending on the service, different challenges arise. For services procured by regulated entities (DSO, TSO) we expect that the procuring entity will put up requirements that ensure that the services are actually delivered. For example, if 20 April 2015
118 A report to The European Commission
Study on the effective integration of Distributed Energy Resources for providing flexibility to the electricity system
demand reduction is acquired from an aggregator the DSO or TSO would have incentives to put in mechanisms that at least on an aggregated level ensure that the demand reductions are delivered. The accessibility and policy on access on metering data and information will be a key question on the importance of the aggregator. Furthermore, depending on the size and the actual value chain of a given transaction, an intermediate party is or is not required in the flexibility provision from DERs. An example of two feasible scenarios is the activation of TSO balancing services e.g. frequency control. Either the TSO communicates directly with the providers (“DERs”) of frequency control reserves using the appropriate technology, or the TSO communicates with an aggregator that activates the demanded service using the connected DERs. Depending on which of the above scenarios that are realized, different demands and needs are put on IT, regulation and market design. Depending on this, and depending on the demands, different barriers will result in different uptake and optimality. The minimum requirements needed in order for DER to provide a certain service should be provided by both the DSO and the TSO in the relevant market, where uptake and efficient integration should be balanced against the technical requirements. Let’s consider three different time horizons; day-ahead, intraday and the balancing market. Balancing market Within the balancing market, which operates within the imbalance settlement period, only the TSO and potentially the DSO is operative. The TSO procures resources and activates these depending on the operational state, and ex-post the positions and imbalances are determined for the BRPs based on metering and profiling data. In practice this will not affect the balance of BRPs as the activation can be adjusted for ex-post, and the coordination could be kept at a minimum as the actions of the TSO do not affect any of the BRPs (unregulated section of the power market) positions. The regulated side of the market (DSO) will need to ensure that the adequate capacity is available (e.g. up/down regulation can only give an effect if there is grid capacity in the “right” direction). Therefore for the products on the balancing market there is need for coordination between the TSO and the DSO. Likewise, for the products activated by the DSO, there is need for coordination between the TSO and the DSO. Cross-border trade within the ISP will affect TSOs on both sides of the interconnector, indicating the need for TSO-TSO coordination in the case of DER participation cross-border. As there is only “regulated” activity within the ISP (TSO and DSO is active), and the affected parties are limited, DER contribution within the ISP is considered relatively simple compared to provision on earlier time horizons/products where more participants are affected. Day-ahead and intra-day markets For the products on the day-ahead (DAM) and intraday (ID) markets there is an increased need of coordination compared to the provision within the ISP. The underlying logic behind this is that there are more actors and involved parties as a transaction before delivery (“ISP”) will affect a particular portfolios balance, and therefore the imbalance settlement (see section 6.5). There are several challenges related to DER participation before the ISP is entered. 20 April 2015
119 A report to The European Commission
Study on the effective integration of Distributed Energy Resources for providing flexibility to the electricity system
The fundamental role of an aggregator is simply coordinating several “DERs”. In particular there are issues relating to demand side response, and the fact that demand reductions cannot be sold back to the market unless they have been bought in the first place. For consumption that is not metered on an hourly level (or ideally with the same frequency as the ISP) it may not be possible to link demand side measures to a specific market participant. Here follows a couple of examples of challenges related to the demand side provision of flexibility via an aggregator. Assume there are two BRPs; BRP1 and BRP2. For simplicity we assume that each BRP has a portfolio of both consumption and generation that is balanced as a whole. BRP1 manages to forecast the correct amount of demand for his portfolio, and the scheduled generation that BRP1 has procured/activated corresponds to this exact amount during the delivery period. BRP2 misses a certain amount of consumption from his portfolios consumption (BRP2 is short). Assuming all other BRPs on the market are balanced, there will be need for up regulation (market is short). This is the outcome of the day-ahead auction, and thus there will be a demand for portfolio optimization for BRP2, otherwise the imbalance will be resolved by the TSO when entering delivery and potential imbalance costs will burden BRP2. There exists an aggregator on the market; A1. A1 has technology installed at consumer premises, and can offer a reduction of consumption corresponding to up regulating power. A1 puts his bid on the market, and the bid is matched by the bid from BRP2. Assuming the load reducing consumers that are connected to A1 are balanced by BRP1, then BRP1 will be imbalanced since their positions are balanced based on the previous “perfect” forecast. Furthermore, BRP1 will not be able to bill as much energy as they initially would which would reduce their revenue, even though their costs (generation level) remains the same as before A1 activated any demand response (otherwise the system would be imbalanced again). In practice the generation from BRP1 will be consumed by BRP2’s portfolio. BRP2 will be able to bill the consumers of their portfolio the consumed energy volume, without having to pay for the generation (paid via the activation of demand reduction from A1). It appears that BRP2 will have to remunerate BRP1 for the generation of electricity which was sold to the consumers of BRP2. Obviously there is need for coordination between BRP1 and A1 in order to register the transaction. Building on the example above, but assuming that the portfolio of BRP1 is imbalanced and the portfolio of BRP2 is balanced, thus enabling us to disregard BRP2 the outcome is different. As the portfolio of BRP1 is imbalanced, there is need for portfolio position optimization. A1 offers to control the consumption of his perimeter, thus offering the appropriate flexibility and portfolio optimization. BRP1 will weigh the bid of A1 against a possible up regulation bid from generators, and pick whichever bid that is cheaper in order to balance his portfolio. The bid from A1 is activated, and the portfolio of BRP1 is balanced. A1 is remunerated accordingly, and the imbalance penalty cost is avoided. BRP1 will now be able to charge his consumers less as the total consumption is reduced. This reduction of “billable” energy will have to be weighed against the anticipated imbalance cost in the case of revenue maximization for BRP1.
20 April 2015
120 A report to The European Commission
Study on the effective integration of Distributed Energy Resources for providing flexibility to the electricity system
The illustrated challenges in both example scenarios above illustrate the complexity of demand contribution to the flexibility market. Generally a distinction can be made between energy and non-energy services. Non-energy services will not systematically affect the expost settlement process, which are (today) based on energy volumes. Energy services will however affect the settlement between different actors, thus indicating the need for coordination and communication between different market participants. Depending on the planning horizon and application, different actors should be informed. Both the TSO and DSO are eligible (neutral) facilitators and should thus be well-suited for a coordination role. In most market regimes they already today hold a coordinating role (settlement and reporting of meter data). The challenges related to conflicting interests between the suppliers, BRPs, consumers and aggregators should be emphasized and minimum requirements are partly presented above (coordination and settlement routines). The risk if these issues are not properly resolved in the market design, DER participation and aggregators could be hindered by traditional actors on the market. On the other hand, the perverse effects such as aggregators selling “unsold” energy should be avoided (see example above). On the other hand, independent aggregators should be included on a level playing field on the market. Independent aggregators are already witnessed on the market in several market regimes today (example Austria, Finland, Sweden) and are highly innovative and cost-effective. The aggregator as an independent trader will only work under certain conditions. Assuming a scenario where there is one supplier (S1), a certain balance responsible party (BRP1) and an aggregator (A1). S1 has a portfolio consisting of end-users (C1). S1 has a physical contracted position on the power exchange, A1 does not. A1 has the capability of (partly) controlling the load in C1, thus reducing the consumption during certain periods and consume more during other periods compared to the “standard” consumption curve. When approaching delivery A1 declares that the there is a certain flexible capacity of consumption flexibility. However the load reduction belongs to S1, as S1 is the actor who paid for the position originally. Thus S1 is entitled to remuneration when a part of their position is sold to third party actors. The aggregator should only be allowed to sell the load reduction to BRP1 and/or S1 directly; however the actual controlling will then be sold as a service rather than physical “deliveries” since the volume is already owned by the S1/BRP1. This service will then be remunerated accordingly. A scenario where A1 sells the flexibility to third party actors will lead to the following: S1 and BRP1 will be imbalanced and the physical positions that S1 bought will be useless (the share that is long corresponding to the sold flexibility) unless sold to another party. This is valid for both the case with and without profiling. Therefore we would recommend that the aggregator, on the deregulated markets, will operate as a service provider for the supplier/BRP and not acting independently. One feasible relation scheme between the different relevant roles is illustrated in the figure below.
20 April 2015
121 A report to The European Commission
Study on the effective integration of Distributed Energy Resources for providing flexibility to the electricity system
Figure 36. The roles and relations needed for aggregators to operate on the deregulated market.
Source: Sweco The figure above illustrates the importance of the relation between the supplier and the aggregator. The BRP provides the supplier with balancing energy (in principal one way), however the supplier provides the BRP with physical positions enabling the BRP to balance the portfolio. The relation between the supplier and aggregator could in theory also be via a neutral facilitator, e.g. the TSO and/or DSO, even though it is not illustrated in the figure above. The exchange of information between the supplier and end-user mainly relates to activation and the resulting cash flow from certain actions (i.e. ‘baseline methodology’). It could possibly include information regarding volumes/capacities and corresponding price of activating those quantities based on the current and future state of an end-consumer. On the regulated part of the power market (ancillary services) the aggregator can operate independently, as the physical and financial settlement can be adjusted ex-post accordingly, reducing the need for coordination and financial implications. In addition to the challenges presented above, there is overlap between the regulated and deregulated activities. A concrete clear example of this would be DSO and TSO activities related to ancillary services. Some of the flexibility provisions are related to long-term services (e.g. long-term peak shifting via changes in the consumption seasonality), wellbeyond both the day-ahead and intraday market planning horizon.
7.2.3
Prosumers
In a system with significant contribution from distributed small-scale generation a substantial share of the capacities, thus generation, will be installed at end-user premises. This will then lead to the introduction of prosumer role, e.g. consumers that produce. The share of annual production and consumption will vary between different actors, however during certain hours 20 April 2015
122 A report to The European Commission
Study on the effective integration of Distributed Energy Resources for providing flexibility to the electricity system
these prosumers will exceed their local consumption with their local generation, and start to feed on to the distribution grid. This will change the traditional unidirectional energy flow on the grid, towards a bidirectional flow. Furthermore, it will change the value stream since the prosumers would expect some sort of remuneration from the electrical energy they “sell” to the grid. Depending on the regime and legislation, there will be a change of the monetary exchange. Some regimes opt for net metering, meaning that the sum of energy over a relatively long settlement period (monthly or yearly settlement periods are common) which is a subsidy for prosumers since they will net tax, VAT and potential transmission tariffs from their energy consumption. Furthermore, with net metering the prosumer will not necessarily face the differences in value of electricity over time (e.g. feeding in during low demand period and taking out during peak demand period). In such a scenario, where net metering is applied, the prosumer will be decoupled from the system state and the incentives (e.g. incentives of certain behaviour) for a given point in time (within the net metering settlement period). Another aspect of the situations when the prosumers are feeding into the grid is the forecasting of generation. The supplier is in many market regimes “balance responsible” for a consumer via the wholesale agreement, meaning that the supplier is responsible for balancing his portfolio. In order to balance a portfolio the supplier has a contract with a balance responsible party (who is financially liable to any deviation (“imbalance”) from the physical positions and the actual outcome. This role could be internalized for a given supplier, however is not necessarily resolved internally. With the introduction of prosumers and excess generation the supplier is responsible for forecasting the prosumers load and generation, and penalized for any imbalance. The incentives for accurately forecasting the prosumers load and generation are strongly dependent on the imbalance cost calculation (see 6.5.2 Single and dual price system). In the case when there is significant in-feed from the prosumers in the region the grid might become congested (see explanation under 2.2.3), and generation from one or several of these prosumers will be adjusted or even curtailed. This indicates the need for coordination between the DSO and the supplier/BRP, in order for them to balance their portfolios in the planning phase. The curtailment/generation adjustment will affect other actors, see description of the value stream above. The prosumer might also push towards the need for regulation of technical requirements of equipment. In order for the market to cope with significant supply volatility, changes are needed in how electricity is consumed. The changes in how electricity is generated is already well-defined, the future is likely to bring distributed (small-scale) generation of electricity. The prosumers both generate and consume electricity and with a more volatile price pattern, business opportunities will arise where then prosumers take a natural part in the value chain. The prosumer is anticipated to have a stronger relation with one or several of; suppliers, BRPs, the DSO/TSO. Furthermore, the prosumers might become complex actors as they will procure additional flexibility in terms of energy storage schemes, as alternative adjacent market such as power-to-gas and power-to-heat technology if terms are (temporarily) more beneficial on the adjacent markets.
7.2.4
Balance responsible party
The BRP (balance responsible party) is expected to have a more complex role in the future as the need for balancing, and coordination between other producers/users of flexibility will increase with a successful integration of DERs. Historically the BRP would take careful 20 April 2015
123 A report to The European Commission
Study on the effective integration of Distributed Energy Resources for providing flexibility to the electricity system
consideration of making accurate generation schedule plans, and resolving any imbalance using the generation side, while the consumption side was static (vertical load). In the future, where DERs take an active part of the future and the real-time markets, the balance of a portfolio will be dynamic from two sides; both the generation and the load side. The roles will depend on the actual market design and the final flexibility transactions. The final markets and products should be based on what is economically and practically optimal, both from a geographical but also from a technological point of view. E.g. demand response should only be promoted and introduced on the market if it can serve needs more efficiently than the alternative “service”.
7.2.5
Distribution system operator
The inherent natural monopoly of energy distribution networks will not change when integrating the DER solutions; the distribution of electricity will still be a natural monopoly, why it should remain regulated. The unbundling of network from other services will remain however in order to achieve and utilize the full value of DERs and flexibility, it is foreseen by many that the DSO should take a more active role in the operation of the distribution grid. This will affect the operation of the transmission grid as transmission and distribution are closely coupled. Literature has stressed the importance of the neutrality of DSOs during this transition of roles and responsibilities.
7.2.6
Transmission System Operator
The TSO is likely to have a similar role as of today, however with the fundamental difference that distributed energy resources and DSOs will take a natural part of the operation of the transmission grid. Historically, central generation units have been used for the continuous operation of the transmission grid, which is expected to be reduced in the future. The TSO is, and will be in the future, responsible for the operation of the transmission grid. Furthermore, the TSO holds a (very) important role for the market operation as the TSO is the allocator of interconnector capacity to the markets. The markets are cleared based on the interconnector capacities, and the price of electricity is calculated taking into account the available capacity that the TSO has published. If the TSO forecast of available transmission capacity is wrong, or whenever there is a sudden outage, the available transmission capacity is revised. Since this will affect the scheduled generation/load plan, the grid is potentially congested and re-dispatch/curtailing is needed in order to ensure the operation of the grid. The actual methodology on how this is done, and market participant’s compensation/penalty, differs depending on the actual regime.
7.2.7
Traditional generators
The central generators will likely, in the foreseeable future, still play an important role. The transmission grid will not be able to operate without considerable contribution from these
20 April 2015
124 A report to The European Commission
Study on the effective integration of Distributed Energy Resources for providing flexibility to the electricity system
central generators who will contribute not only with injection, but also inertia53 that will ensure sufficient frequency quality. The central generators will however compete with the DERs, and the optimal generation portfolio will succeed.
7.3
Reactive or Active demand side participation in the day-ahead market
The day-ahead market plays a key role in the European market design, and DAM price is the key reference price for financial contracts and the largest volumes are often traded on the DAM market. With this perspective it seems advantageous that demand flexibility could also be taken into account in the day-ahead market, obviously dependent on the service supplied by the demand response. If increasing demand flexibility is used to reschedule demand within the day this has to be considered when placing the DAM bids, otherwise larger volumes will end up on the intraday or balancing power market. Not only would this constitute credibility problem for the DAM, it could also cause very high balancing prices and make balancing of the system more challenging for the TSO. Another challenge is that the participating end-consumers have no direct incentives to balance consumption against the consumption forecast, as their consumption is profiled. Even in the case of smart-meters the balance will not be settled explicitly, but could remain profiled. During a learning period the different market participants will probably experience difficulties in forecasting end-consumer behaviour when the consumption is significantly changed from the profiling consumption curves. Any deviation (equivalent to a high degree of penetration of reactive54 end-consumers) from the forecasted consumption curves is likely to incur an imbalance in the portfolio, which needs to be resolved via one of the available institutions (intraday, balancing market(s)). It is not apparent how fast the learning curve is for market participants, and how predictable this reactive demand response will be. A likely development is a function of the incentives and the adoption pace, e.g. if the incentives are significant then the adoption pace will be higher, and vice versa. Instead increased demand flexibility will require the portfolio manager and the BRP to take demand flexibility into account when placing bids on the DAM. If balance responsible parties do this by using a price forecast to forecast how the demand flexibility will affect the total demand for each hour, a reliable price forecast becomes very important. A poor price forecast can lead to significant errors in the demand forecast, potentially worse than not considering demand flexibility in the bids at all. For example, in the extreme case, if all balance responsible parties predict hour 1 to be more expensive than hour 2, they will 53
Inertia helps maintaining the nominal frequency since any sudden outages are ”dampened” temporarily. A higher inertia will yield a slower frequency change, thus increasing the technical response time of primary reserves. 54 Reactive demand response means that the signal is based on the expected state of the system. In the case where the signal is from the day-ahead market, that is based on the expected balance between demand and supply, not necessarily the true balance. Consumers then react to this signal. 20 April 2015
125 A report to The European Commission
Study on the effective integration of Distributed Energy Resources for providing flexibility to the electricity system
assume that demand flexibility will decrease demand by 2,000 MW hour 1 and increase demand by 2,000 MW hour 2. If it then turns out that the price is higher during hour 2 the demand flexibility will move demand in the opposite direction from what was expected and create a forecast error of 4,000 MW during both hour 1 and hour 2. Figure 37. Forecast errors may increase as a result of reactive demand flexibility.
Source: Sweco The illustrated example obviously shows an extreme situation, and does not necessarily illustrate the outcome from demand response. The example rather illustrates a “worst case” scenario when market participants speculate in the future market price and reactive demand response. A possible alternative would be to enable a bid which defines the total amount of energy needed during the day and the maximal deviation from the “profiling” curve during any single settlement period (often hour). The energy can then be bought at the lowest possible price, fulfilling the boundary conditions. This would potentially minimize the volumes that end up on the balancing market from the reactive demand response.
7.4
Capturing the value streams today – some good examples
Already today demand response and other DER are used. This section provides a few selected examples. Initially we briefly outline demand response in one part of the USA, the PJM market. We then describe a few European cases focusing either on the regulated or deregulated part of the market.
7.4.1
Demand response and PJM
Demand response is a well-established part of the PJM market (Eastern USA). PJM is operating in 13 states, linking supply and demand of electricity for more than 51 million end20 April 2015
126 A report to The European Commission
Study on the effective integration of Distributed Energy Resources for providing flexibility to the electricity system
users. In brief demand response can be distinguished into two different types; economic and emergency demand response. A provider of flexibility could in principle participate in both markets, depending on the circumstances. The emergency demand response is often referred to as Load Management Resources or Interruptible Load Resources. Once committed the delivery is mandatory and failure to deliver the committed service will be penalized. The activation of the emergency demand response is by load reduction or only to consume electricity to a certain level when PJM requires assistance to ensure the operation of the grid. There are several “products” that can be signed; ■
Limited DR – allowing activation for 10 weekdays between June and September (peak-load season) where each activation could be up to 6 hours in duration, ■ Extended Summer DR – allowing activation all days between May and October, where each activation could be up to 10 hours in duration, ■ Annual DR – activation between June and May (following year) where each activation could be up to 10 hours in duration. The participants are mainly activated via an aggregator, and the remuneration is mainly done via the capacity auction prior to delivery. The remuneration is a function of the auction clearing price and load reduction commitment. In addition to the committed resources under the capacity auction there is the voluntary participation in the emergency demand response. Under this mechanisms the aggregators have the possibility to participate when an emergency is called and remunerated according to activate energy. Economic demand response is a voluntary program which basically operates on a monthly basis. The service is activated by the PJM if the wholesale price is equal to or above the net benefits price. The net benefits price represents the price at which the benefits (reduction of wholesale prices) from the economic demand response exceed the cost of activation. Parallel to the participation in the economic demand response a consumer can participate in the ancillary services market. The ancillary services market comprises three different services; ■ ■ ■
Synchronized Reserves (load reduction within 10 minutes) Day-ahead scheduling (load reduction within 30 minutes) Regulation (Frequency Containment Reserve)
The participation in the economic demand response is voluntary, however if a bid is accepted then delivery is mandatory (otherwise financial penalties applies).
20 April 2015
127 A report to The European Commission
Study on the effective integration of Distributed Energy Resources for providing flexibility to the electricity system
7.4.2
Aggregator in Austria – frequency control from electrical heaters
Service provided
Capacity (and activation) for frequency containment reserve (FCR)
Actors involved
■
TSO (Austrian Power Grid AG) Purchase and activation of the reserve. Aggregator: Aggregates and assists end-customers providing capacity to the reserve. Tele provider (communication) End-customers (domestic): Provide capacity to FCR from electrical heaters.
■ ■ ■
Value streams
■ ■
TSO remunerates for the capacity. Profit sharing between aggregator and end-user.
Business model - description In Austria the use of electrical heaters for domestic usage of water is common. The business case of FCR from electrical heaters uses independent metering and communication, and the communication between the aggregator and end-consumers is via SMS and cellular technology. The metered value is the temperature of the water in the electrical heater, which is provided with a certain frequency (minutes). The aggregator can remotely control to activation (or de-activation) of an electrical heater, and the capacity of an electrical heater is generally 2 kW. By activating prematurely or postponing the activation of an electrical heater the electricity consumption can be shifted in time, and the thermal inertia in a water tank can be utilized without the end-consumer experiencing any inconvenience. As the delay/prematurely activation of a particular electrical heater is relatively short compared to the TSO’s needs for balancing, the electrical heaters are activated in sequence in order to provide a service with sufficient duration. The response time is sufficiently short for FCR.
20 April 2015
128 A report to The European Commission
Study on the effective integration of Distributed Energy Resources for providing flexibility to the electricity system
Figure 38. Illustration of flexibility provision from demand response
Source: PwC The FCR from electrical heaters in Austria uses existing cellular infrastructure for communication. One of the included partners in the flexibility provision is a local telephone operator, which provide the communication infrastructure. A particular boiler can either be complemented with the appropriate equipment (remotely controlled relay for activation/deactivation, temperature sensor and cellular device), or is bundled with the needed equipment if sold from the partnered appliance companies. Before the introduction of the flexibility provision from the electrical boilers pooling of resources was not allowed in the TSO procurement of FCR. The regulation was changed so that resources could be pooled, and that the individual resources have a capacity of 2 kW or higher. Furthermore, in order to not affect third party market participants (e.g. the BRP) the ex-post settlement period includes the activated volumes from FCR activation and adjusted accordingly.
20 April 2015
129 A report to The European Commission
Study on the effective integration of Distributed Energy Resources for providing flexibility to the electricity system
7.4.3
Aggregator in Finland – frequency control from demand response 55
Service provided
Capacity (and activation) for frequency containment reserve (FCR)
Actors involved
■ ■
TSO (Fingrid): Purchase and activation of the reserve. Aggregator (SEAM): Aggregates and assists end-customers providing capacity to the reserve. End-customers (commercial): Provide capacity to FCR mainly from ventilation equipment.
■
Value streams
■ ■
TSO remunerates for the capacity. Profit sharing between aggregator and end-user.
Business model - description SEAM is an aggregator based in Finland. SEAM has multiple value streams involving dayahead market, intraday market and the balancing market (frequency containment reserve, FCR). The business model includes the end-consumers (mainly commercial users currently), SEAM and Fingrid (TSO). Traditionally Fingrid has procured FCR from hydropower producers, and for the last three years costs have increased with approximately 20 % per annum. Hydropower producers have historically had difficulties with supplying FCR when the spring flood has started, as there is little regulating capacity left (operating at full name plate capacity in order to avoid spillage of water). The procurement procedure for FCR is divided onto two auctions; yearly and hourly FCR. The yearly auction is remunerated via a flat fee for capacity, the hourly market is continuous. Historically the hourly market has remunerated participants the highest. Last year the remuneration was on average 400,000 EUR/MW of FCR capacity for demand response. The pricing mechanism is marginal pricing on the hourly auctions. The profits attained are shared between the aggregator and the end-user. At present the Finnish TSO subsidizes the end-user in the needed communication and steering equipment by financing 50 % of the investment needed. The cost for procuring and activating these resources is covered by the transmission tariff, i.e. costs are socialised. The most suitable end-user providing FCR has historically been large real-estate properties as the building requirements in Finland demands commercial property to have a relatively large name plate capacity for ventilation, which is seldom fully used. This means that there is a regulation possibility. The cycles of activation typically last for around 3 minutes, which can be rescheduled without noticing any discomfort for the users of the commercial properties (inertia in air quality). Industrial consumers have traditionally not been participating in the FCR, due to uncertainties related to increased wear on machinery and equipment. As the actions of the TSO does not affect any other market participant (within the imbalance settlement period), and since the activated regulating power is a zero sum energy product (in theory up regulation is equal to down regulation effectively yielding a net energy volume of zero) the provision of flexibility from end-users does not have any direct conflicting interests. 55
Case description based on interview with SEAM
20 April 2015
130 A report to The European Commission
Study on the effective integration of Distributed Energy Resources for providing flexibility to the electricity system
According to SEAM the demand resources are better suited for FCR as they are not dependent on the hydrological regime (e.g. spring flood) and is easier to activate as response times are faster.
7.4.4
Aggregator of heat pump control in Sweden56
Service provided
Start-up, proof-of-concept. Possible services include: ■ ■ ■ ■
Portfolio management/balancing TSO balancing DSO congestion management Peak forecasting
Actors involved
■ ■ ■
Aggregator (Ngenic): Control of heat pumps End-customers: Providing flexibility Possible users of flexibility: DSO, TSO, suppliers/BRPs
Value streams
Multiple value streams depending on service provided: ■ ■ ■
Energy efficiency Arbitrage Capacity payments from TSO and/or DSO
Business case - description The Sweden based (start-up) aggregator Ngenic has a technology that enables them to control heat pumps remotely. Heat pumps are common in Sweden for domestic heating. In brief, heat pumps extract energy from an ambient medium (often ground or outside air), and “drops” the extracted heat energy to the indoor area. The efficiency of heat pumps is mainly depending on the ambient temperature, and at low temperatures the efficiency (“COP factor”) will be reduced. Due to this change of efficiency dependent on the ambient temperature the optimal electricity consumption can be (theoretically) scheduled so that it ensures the indoor comfort criterion (indoor temperature not exceeding/dropping a maximal/minimal indoor temperature. By scheduling the heat pump consumption of electricity according to the current and forecast (expected) ambient temperature of coming hours and using thermal inertia to store heat, the electricity consumption can be minimized. The needed equipment for the control of a specific heat pump is basically a temperature sensor, communication to the control and a temperature forecast. The algorithm applied is a machine learning algorithm which “learns” the thermal inertia of a given end-consumer and the actual efficiency curve for a heat pump. In other words, the need for a “smart-meter” is not needed as the electricity consumption is implicit from the usage of the heat pump (and other electricity usage behind the meter). Currently Ngenic’s business case is primarily based around energy efficiency (reducing energy consumption by operating at higher efficiencies (temperatures)), and secondly around time-of-usage distribution tariffs. This is mainly due to a) exposure to spot prices for end-consumers yields little arbitrage (spot price 56
Case description based on interview with Ngenic
20 April 2015
131 A report to The European Commission
Study on the effective integration of Distributed Energy Resources for providing flexibility to the electricity system
is flat due to hydro domination in Sweden) and b) due to lack of exposure to imbalance costs (costs are socialised) from the BRP. In the case of a flat tariff (simply a constant unit cost of electricity e.g. cEUR/kWh) the control algorithm will strive to minimize the electrical consumption, thus minimizing the cost for heating. Assuming other incentives than simply minimizing electrical consumption, e.g. portfolio management or balancing the controlling of the heat pump can be set to minimize the costs based on the future expectation of electricity unit cost. By consuming electricity differently than the optimal consumption plan the consumption of electricity will increase, however the total costs will decrease (compared to the operation minimizing the electricity consumption). In the figure below two different price incentives are illustrated schematically. In the top graph the unit price of electricity is illustrated. This could correspond to a dynamic tariff (e.g. following the spot price or intraday price), or the net cost after the portfolio manager has traded on arbitrage (profit sharing), or similar. The cost of electricity (illustrated in the top graph) in the scenario “incentives” is initially low, followed by high prices, followed by lower prices, ending with higher prices again (dashed black). The flat rate is linear, e.g. the unit cost of electricity is constant (solid black). The temperature (red solid), heat pump efficiency curve (also red solid) and electrical consumption from both scenarios (solid and dashed black) are illustrated in the middle graph. The temperature is initially high (thus high efficiency of the heat pump), followed by lower temperature (lower efficiency), followed by high temperature again (high efficiency) (red solid curve). The bottom graph illustrates the indoor temperature, and the comfort zone (temperature should not go outside of the predefined comfort criterion). In the middle graph the two different scenarios are both minimizing the cost based on the incentives provided. The sum of the “incentive” electricity consumption is larger compared to the “flatrate” curve, however both satisfies the pre-set comfort criterion. The flatrate-curve (solid black) is initially activated at nominal capacity (temperature and efficiency is high), then reduced to minimum load, and later activate again when the efficiency is high. The dashed black curve is initially operating at a high load even if the temperature drops, and when the prices are the highest the load drops. The price will later be reduced, thus activating the heat pump once again. In the end, when the price signal is back at the high level, consumption is reduced even though the efficiency is once again high.
20 April 2015
132 A report to The European Commission
Study on the effective integration of Distributed Energy Resources for providing flexibility to the electricity system
Figure 39. Schematic illustration of ambient temperature, heat pump efficiency, electrical consumption for two scenarios (flat and incentive), indoor temperature, and cost of electricity.
Source: Sweco The illustrated example above illustrates two alternative paths of consumption, which are based on the provided incentives. In theory, the cost for providing a “bid” to day-ahead, intraday or balancing markets is defined by the increase in electrical consumption compared to the optimal consumption path (based on the retail tariff). As the current thermal state and the heat pump efficiency curve of a household is unique, a series of bids could be formulated and submitted to the market. The bids could be formulated relative to the optimal consumption path (minimize costs which depend on unit cost of electricity), e.g. if the price of up/down regulation is cheap enough compared to the base case it is justified to increase electricity consumption. As each household is unique, and could in theory generate a number of alternative consumption paths, the flexibility potential is liquid (e.g. many bids) and could be remotely operated by the operator. The user could be BRP, portfolio manager or the TSO/DSO (regulated market).
7.4.5
Future business cases – using storage as a service
Distribution grids with significant shares of DG might experience congestion and/or bad utilization of the existing capacity (nominal capacity only utilized a couple of hours each year, if at all). A measure for relaxing the grid during these (extreme) events could be to install an energy storage scheme. A central energy storage scheme could in theory charge the storage during periods with a significant excess generation, which would in the base line scenario be curtailed. During periods with less generation the energy storage could be discharged and 20 April 2015
133 A report to The European Commission
Study on the effective integration of Distributed Energy Resources for providing flexibility to the electricity system
providing the local consumers with electrical energy. An alternative to a central storage scheme is distributed (e.g. domestic) storage schemes, which might be problematic due to a number of reasons: ■ ■ ■
Location inside the house might be challenging as they need to be properly installed, Connection schemes need to be properly setup, Needed control equipment to ensure safe and efficient operation.
As an alternative to the domestic energy storage schemes a central storage scheme could offer the same services, and with a number of pro’s. The economies of scale is the most obvious benefit compared to the domestic energy storage schemes, as is the operation of the energy storage scheme. The central (however still located at distribution grid level) energy storage scheme will offer grid congestion, minimization of distribution losses, asset maximisation by selling flexibility and resources to the highest paying buyer. The central storage should be exempted system costs since this is paid during injection to the grid by the prosumer. The financial burden the system (including both VRES and energy storage) will reduce the burden on the distribution grid since there is a reduction of grid investments due to an efficiency increase (nominal capacity is utilized more frequently). Challenges There are several challenges related to energy storage schemes as a service. Double taxation and fees might form wedges for the business case of using energy storage as a service. In the case of the energy storage operated by the DSO (or another regulated market actor) there are several regulatory barriers as the details are yet to be defined for many European regimes. In addition to above, the regulation is not clear regarding an energy storage which is owned in a consortium between several market participants (could be multiple prosumers). The energy storage is not physically placed behind the meter (which is often encouraged) but placed outside of a prosumers perimeter, still principally offering the same (system) benefits. Related to energy storage owned by a consortium is energy taxation, transmission fees, profit sharing between DSO and prosumer(s), and possible VRES subsidies (e.g. market premiums, FITs, etc.).
20 April 2015
134 A report to The European Commission
Study on the effective integration of Distributed Energy Resources for providing flexibility to the electricity system
8
Current barriers
The examples provided above show that there are ample opportunities already today to take advantage of the flexibility that can be provided by DER, provided that the value is there. The technological barriers are typically quite limited, although improved metering can facilitate capturing more of the value streams. In some cases there is a need for adapting existing regulations to facilitate for DER participation, but generally we do not see a need for a massive regulatory intervention. However, there are some barriers that prevent or make it more difficult to capture this value. There are for instance some regulatory barriers that create difficulties for aggregators and that in some cases also could undermine the business case for an aggregator.
8.1
Lack of markets
The value of flexibility can be revealed in several different ways, e.g. through tendering, bilateral agreements, network tariffs etc. In addition to these, organised market places are important for some flexibility services. In order for organised market places to function properly, it is necessary that sufficient liquidity can be established. This likely means that very local services in many cases will be difficult to supply through organised market places, but other arrangements will be necessary. In particular, DER may provide local services where national or regional markets are not necessarily relevant. In cases where DER can supply services to larger markets, e.g. on the system or wholesale level, organised market places are more likely to be a suitable mechanism for revealing and remunerating value of flexibility also from DER. However, markets do not currently exist for some products, for instance voltage control in the distribution grid. The main markets are set up to provide energy, and markets for other services are often not in place. For instance energy storage could potentially provide several different services to the power system. There are several applications such as energy arbitrage, generation capacity deferral, ancillary services (regulation, contingency reserves), ramping, T&D capacity deferral, end-user applications (managing energy costs, power quality and service reliability) and renewable curtailment (Sioshansi, et al., 2012). There are thus multiple value streams, and a fundamental problem is an inability both to quantify and to capture those value streams. This is partly due to missing or incomplete markets for some of those values, and many services are thus not priced in markets (voltage support, reactive power, inertia, ramping etc). Both Shishansi et.al (2012) and Bhatnagar, et al. (2013) point at this problem, but from a US context. Similar issues are however present also in Europe. As pointed out above, it of course needs to be recognized that there are difficulties in arranging such markets, as extreme locational market power could easily arise. This is a problem also for “centralized energy resources”, but can be expected to be even more difficult for distributed energy resources. In any case this leads to an inability to quantify and capture the multiple value streams provided to the grid. The use of locational pricing is also limited in Europe on the wholesale level (some use of bidding areas), and absent in distribution networks. Increased use of locational pricing in the 20 April 2015
135 A report to The European Commission
Study on the effective integration of Distributed Energy Resources for providing flexibility to the electricity system
wholesale market could provide stronger incentives for flexibility in relation to more local needs (i.e. bidding zones rather than national markets). However, this may not provide the incentives for flexibility in the local distribution grids. In theory locational marginal pricing in the distribution grid could provide an opportunity to capture (very) local value of flexibility, although in practice such pricing schemes may be difficult to implement. Price differences trigger deployment of flexibility options. The fundamental driver for the profitability of demand response/energy storage is the arbitrage between peak and off-peak prices, i.e. the savings/remuneration will be larger the higher the volatility is. In a (local) system where there are relatively few market participants, the impact from one market actor could be (very) influential in the price formation meaning the business case will (if remunerated via the arbitrage and marginal pricing) be less profitable. An example of alternative, more beneficial, remuneration schemes could be capacity payments, rather than energy-only remuneration. The paradox is that local markets are anticipated to generally have a larger need for flexibility, simply because of their non-diverse supply curve.
20 April 2015
136 A report to The European Commission
Study on the effective integration of Distributed Energy Resources for providing flexibility to the electricity system
Value of flexibility and market concentration High price volatility means that there is a large variation in the value of power over time. This provides one indicator of the value of a certain type of flexibility, i.e. the ability to adjust demand or generation in order to match the current demand supply balance. More isolated markets have less access to different type of generation sources, which easily could lead to large variations in the cost of supplying power, i.e. high price volatility. Such markets would also typically have a high market concentration. This would generally be associated with more potential problems of market power. If there are significant market power problems the market outcome will not be efficient. The figure below illustrates the standard deviation of the DAM price (measure of volatility) plotted together with the Herfindahl-Hirschmann index (a measure of competition, lower means more competition) for the Italian price zones. It can be seen that there is a positive correlation between volatility (the higher the volatility is, the larger the indicator for flexibility needs) and the level of competition (the smaller the competition, the smaller the diversity of the supply curve is).
St. dev EUR/MWh (volatility, higher means more volatility)
Figure 40. Volatility (standard deviation) plotted together with competition (HHI) Italian power market, 2013. 45 40 35 30 25 20 15 10 5 0 0
2000
4000
6000
8000
10000
HHI (level of competition, lower means more competition)
Source: Gestore Marcati Energetici 2013, calculation by Sweco. This indicates that flexibility from DER will be more valuable in congested market areas which also have a high degree of market concentration. In addition to providing flexibility, DER may also help to mitigate potential problems related to market power. Integration of DER could therefore be beneficial both from a systems and a market point of view.
20 April 2015
137 A report to The European Commission
Study on the effective integration of Distributed Energy Resources for providing flexibility to the electricity system
8.2
Lack of market access
Even if market exists it may be difficult for DER to access the markets for different reasons. This can be due to lack of liquidity in markets which limit the usefulness of the markets, regulatory barriers or technical specifications preventing market access for DER. Direct participation in organized market places requires exchange membership or e.g. a client arrangement. The membership fee varies somewhat between exchanges. In Nord Pool Spot the annual fee for participants on Elspot 57 and Elbas is €15,000 and on Epex Spot58 the annual fee for participation in one auction (and corresponding intraday market) is €10,000. If there is in addition a need to participate in financial markets there is a separate fee. Nasdaq OMX Commodities for instance has an annual trading fee of €13,500 and clearing fee of €25,000. For it to be worthwhile to be a direct participant the volume obviously needs to be fairly large, i.e. for most DER this is not a relevant alternative. In some markets there are also other options such as participating as a client (through a client representative). The fee to the exchange is then substantially lower, in the case of Nord Pool Spot the annual fee for a client member is only €1,500. In addition a commercial agreement with a client representative is needed. In addition to the direct fees that have to be paid to the market places there will be additional costs for market participation. Markets with continuous trading means that you as a market participant need to devote substantial resources for participating in the markets. Furthermore, minimum bid sizes may prevent smaller actors from being able to participate in markets. This highlights the importance of intermediaries, e.g. the supplier or an aggregator that can function as a link between the market and the DER owner.
8.2.1
Market access for aggregators
Aggregators gather flexibility of many (small) consumers and from this build demand response services. Through aggregation one pool of aggregated load is created which facilitate market participant. The Smart Energy Demand Coalition59 has recently mapped the status for demand response across several European countries (SEDC, 2014). SEDC have developed 10 guidelines for enabling demand response participation in wholesale, balancing and other system services markets. The guidelines are categorised into four criteria: 1) involve consumers, 2) create products, 3) develop measurement and verification requirements, and 4) ensure fair payment.
57
Elspot is the Nordic exchange day-ahead market, Elbas is the intraday market. German exchange 59 Smart Energy Demand Coalition (SEDC) is an industry group with focus on promoting demand side programs. 58
20 April 2015
138 A report to The European Commission
Study on the effective integration of Distributed Energy Resources for providing flexibility to the electricity system
Information on member state level was gathered through desk research and expert interviews. It is explicitly mentioned that the findings reflect the experience of the players on the ground. This is important, as in some cases the assessment (grading) differs between countries, although the underlying conditions are described in very similar ways in the report. This could of course reflect differences in details which are not fully reflected in the report, but is also likely to at least partially be due to the subjectivity that comes from the chosen methodology. According to the SEDC research demand response is not accepted in several national markets as a resource, or the market roles and responsibilities prevent direct access of consumers to service providers. Figure 41 provide an overview of the first criteria, consumer access to markets, according to the SEDC analysis. The actual barriers differ between the countries. In Spain aggregation is not legal, and there is only one scheme allowing demand response. However, there are proposals to open balancing services to demand response and changes could come. In several countries aggregation is legal in theory, but BRP-BSP relationship is unclear or there are other critical barriers. In the Nordic countries aggregation is legal and consumers can in theory buy and sell electricity independently, but have to be connected to a BRP. The situation in Finland is assessed to be somewhat better than in the other Nordic countries due to e.g. better access to the ancillary services markets and that aggregators can register as a BRP and pay a (small) monthly fee to the TSO. In Germany aggregation is legal, but existing market rules for purchase/sale, transportation and balancing of electricity have to be recognized. That necessitates the conclusion of different agreements like standardised contracts with the TSO, DSO or BRP and contracts with possible retailers and the consumer. At least for suppliers or independent aggregators that are not accustomed to the standards of the German energy market, this can be difficult.60 However existing grid tariffs on the consumption of negative balancing energy are assessed to be a market barrier for Demand Response in Germany. Also in countries in which demand response and aggregation is enabled in a range of markets there is typically need for further development, according to the SEDC analysis. In Great Britain there is for example a need to further define the roles and responsibilities of the BRP and BSP.
60
In the SEDC analysis the assessment was that independent aggregation is very difficult due to regulatory barriers. This view is questioned by other stakeholders. 20 April 2015
139 A report to The European Commission
Study on the effective integration of Distributed Energy Resources for providing flexibility to the electricity system
Figure 41. Consumer access to markets DR or aggregation illegal or aggregated demand not accepted as a resource Legal in theory in one or two markets, but not commercially viable, critical barriers remain such as BRP-BSP relationship unclear DR & Aggregation legal in selected market BRP-BSP relationship unclear, but market viable DR & Aggregation enabled in a range of markts N/A
Source: SEDC (2014), Mapping demand response in Europe today, April 2014
8.2.2
Market rules and product definition
Market rules and product definition may impact the viability for DER to access different markets. This could for instance relate to minimum bid size and bid increment, which is typically small in well-developed day-ahead markets (0.1 MW) but large in many balancing markets (up to 50 MW). A high minimum bid size prevents participation of DER in such markets. Product definition and different technical rules are other important barriers. While some of those rules are justified in order to ensure that the system services that are needed will actually be delivered, modifications could be made to facilitate participation of DER. For instance the viability of demand response is significantly affected by issues such as the required delivery period (demand response could typically deliver for a few hours but not for a full day) and the frequency of required delivery (may need sufficient time between activation). Both product definition and market rules have typically been set-up with based on the needs of conventional (centralized) generation resources, and alternative arrangements are in many cases possible. Other potential barriers could be activation rules such as activation time as well as duration and frequency of activation. SEDC (2014) studied the impact on program requirements on aggregators, creating products suitable for aggregation and demand response. This relates to issues such as activation time, minimum and maximum quantity, pay-as-cleared vs. pay-as-bid, penalty requirements and several other market design characteristics. Balancing markets have traditionally been designed on the basis of the needs of larger generators. 20 April 2015
140 A report to The European Commission
Study on the effective integration of Distributed Energy Resources for providing flexibility to the electricity system
In day-ahead markets the minimum volume increment is 0.1 MW, while in balancing markets the minimum bid size could be as high as 50 MW, with increments of 10 MW. The high minimum bid size and volume increment is due to manually operated markets (i.e. telephone call to activate the resources). Some markets have reduced the minimum bid size in the range 1-5 MW, or in some cases even below that, in the balancing market. For DER participation the general rule would be that the smaller minimum bid size/bid increment the better (also in the case of an intermediary). For demand response it is also important that the activation time is not too long, or that the duration between of activations is not too short, as it would exclude many demand side resources. Pricing models differ between markets. In day-ahead-markets, pay-as-cleared is the commonly used model. In reserve markets pay-as-bid is however often used. With pay-asbid regimes low cost resources typically receive a lower compensation than higher cost resources. Demand side resources can often be activated at a low variable cost and those resources would then receive a lower payment under a pay-as-bid regime. This is of course in particular the case if there are requirements to submit cost-based bids. Figure 42. Program requirements Program requirements block demand side participation Significant barriers remain, creating major competition issues for demad side resource participation Minor barriers to demand side partcipation in market remain, however participation is possible Program requirements adjusted to enable a range of resources to participate in multiple markets N/A
Source: SEDC (2014), Mapping demand response in Europe today, April 2014
20 April 2015
141 A report to The European Commission
Study on the effective integration of Distributed Energy Resources for providing flexibility to the electricity system
8.3
Lack of price pass-through
Even if markets do exist, prices are in many cases not properly passed-through to distributed energy resources, and in particular the demand side resources. This is due to several factors including regulatory and technical barriers, but customer preferences are likely to also play a role. In addition pricing of different products may be such that the full value of flexibility is not passed through in prices.
8.3.1
Regulated end-user prices
Regulated end-user prices (retail prices) are present in several European countries. In particular this is the case for household customers (see Figure 43 and Figure 44), where regulated prices are more common than unregulated prices. Also for SMEs regulated prices are common across Europe (see Figure 45), and regulated prices for industrial customers are also present in some European countries (see Figure 46).61 Among the European countries with regulated end-user prices, rate of return or cost-plus regulation is the most common. There is however also examples of price cap or revenue cap regulations.62 Regulated end-user prices do not necessarily prevent all type of price differentiation, but in general it cannot be expected that market prices will be passed-through to end-customers. In principle it could be done basing the regulated price on a spot price (+mark-up), if the regulation permits such models. This would of course require technical systems supporting such pricing (hourly metering), and for it to be acceptable hedging opportunities also for small customers. A regulated entity’s incentives to provide such pricing schemes are however limited, in particular under a cost-plus regime. The extent of regulation of end-user prices for household differs. In some cases it mainly refers to households with special needs, and the impact on the provision of flexibility from DER would then most likely be limited, but if a large share of household customers are subject to regulated prices it would imply a significant barrier to demand response provided by this customer segment (e.g. electricity demand for heating or air-conditioning). Regulated prices for SMEs and industries could have significant impact on the availability of demand response from those customer categories. 12 member states had regulated enduser prices for SMEs in 2012 and a five member states also had regulated prices for industries. In these segments it is likely that there is potential for demand response, and the existence of regulated prices would provide a barrier for activating the underlying flexibility among those customers. Active customers could generally opt-out of regulated prices, but it is then important that the regulated prices are not below cost as few would otherwise opt out.
61
Data in the figures are for 2012. Estonia abolished price regulation for all segments in January 2013. There are also different arrangements with ex-post price assessment, price freezes etc which is not included in the data presented here. For more detailed information we refer to the ACER/CEER Annual Report on the Results of Monitoring the Internal Electricity and Natural Gas Markets in 2012. 62 See for example Energy prices and costs report SWD(2014) 20 final/2, page 31, map 3. 20 April 2015
142 A report to The European Commission
Study on the effective integration of Distributed Energy Resources for providing flexibility to the electricity system
Figure 43. Household customers supplied under regulated prices, 2012
Figure 44. Share of household customers supplied under regulated prices, 2012 100 90 % 80 % 70 % 60 % 50 % 40 % 30 % 20 % 10 % 0%
Regulated prices present Non-regulated prices N/A
N/A
Source: Annual Report on the Results of Monitoring the Internal Electricity and Natural gas Markets in 2012, (ACER/CEER, November 2013)
20 April 2015
Source: Annual Report on the Results of Monitoring the Internal Electricity and Natural gas Markets in 2012, (ACER/CEER, November 2013)
143 A report to The European Commission
Study on the effective integration of Distributed Energy Resources for providing flexibility to the electricity system
Figure 45. SMEs supplied under regulated prices, 2012 Regulated prices Non-regulated prices N/A
Regulated prices Non-regulated prices N/A
Source: Annual Report on the Results of Monitoring the Internal Electricity and Natural gas Markets in 2012, (ACER/CEER, November 2013)
20 April 2015
Figure 46. Industry supplied under regulated prices, 2012
Source: Annual Report on the Results of Monitoring the Internal Electricity and Natural gas Markets in 2012, (ACER/CEER, November 2013)
144 A report to The European Commission
Study on the effective integration of Distributed Energy Resources for providing flexibility to the electricity system
8.3.2
Feed-in tariffs
Feed-in tariffs are being used for renewable generation in many member states. This could also include distributed generation. Feed-in-tariffs, at least in its simplest form, remove all incentives to adapt generation depending on the supply-demand situation, and thus the incentives to be flexible. For low marginal cost technologies (e.g. wind and solar) incentives to produce would however remain until the price is close to zero. For those technologies the key barrier for flexibility is thus that feed-in tariffs are paid even during hours with negative market prices.
8.3.3
Net metering
Net metering is applied in some member states (e.g. Denmark, Belgium, Netherlands). This practice implies that electricity generated by an electricity consumer from an eligible on-site generating facility (e.g. PV system) and delivered to the grid, could be used to offset electricity purchased from the grid. The consumer would then only pay for the net consumption during the applicable billing period. Net metering can be applied for different billing periods and also related to different parts of the total electricity bill (network charges, taxes, purchase of electricity). A far reaching alternative is net metering over a longer time period, e.g. a year and where the selfproducers net purchase is regarded as its total purchase. In this case the self-producer is using the grid to artificially store electricity produced at one point of time to consume it at another point of time, without taking into regard that the value of the electricity may vary substantially between the time periods. This artificial storage reduces the value of flexibility as the self-producer will not face the true value of the electricity and thus not have incentives to be flexible.
8.3.4
Fixed prices are dominating
End-user price structure varies significantly between member states, and of course also depends on consumer preferences (in a liberalised market). Fixed price contracts limit, or remove, the incentives for flexibility. 63 However, provided that there are no legal restrictions contracts are likely to develop if flexibility is of sufficient value. This may be a lengthy process, in particular since consumer preferences may have to adopt. The existence of price regulation is likely to hamper a development towards customers accepting contracts with a higher pass-through. In some markets the situation is very different. In Sweden, for example, the share of variable price contract is close to 40%, and different fixed price contracts have a similar share. For the majority of the customers, the contracts will not provide incentives for short term flexibility. 63
With fixed price contract we refer to contracts with a fixed energy price (per kWh) over a longer time period, which implies that spot prices are not directly passed-through into enduser prices. Contracts may also include a non-energy dependent price component, which is not specifically addressed here. 20 April 2015
145 A report to The European Commission
Study on the effective integration of Distributed Energy Resources for providing flexibility to the electricity system
For smaller (domestic) customers profiling is typically used and the variable price is based on the monthly average spot price. Although all customers have the right to hourly metering and billing at no extra cost for the customer very few smaller customers have so far opted for this. One reason of this could be the lack of volatility and market value of flexibility, due to the vast amount of flexibility from hydro power. Figure 47. Share of different contracts, Sweden (March, 2014)
7% 16%
39%
38%
Variable price contract
Fixed price contract (< 3 years)
Default contract
Other contracts
Source: Statistics Sweden, Swedish Energy Agency It is of course important to recognize that variable price contracts expose end-consumers to a price risk, which not all customers are willing (or should) carry. It is however possible to use hybrid contracts in which hedges a fixed volume while using variable price for the marginal consumption (above or below the fixed volume). The design of contracts/price model is primarily an issue for the market participants, subject of course to general legal requirements. Regulation of contracts would imply a significant risk to decrease innovation in commercial arrangements. A shift towards more use of variable price contracts would however be beneficial for the introduction of e.g. demand side response.
20 April 2015
146 A report to The European Commission
Study on the effective integration of Distributed Energy Resources for providing flexibility to the electricity system
Figure 48. Measurement and verification
Figure 49. Finance and risk
Requirments are non-existent or do not enable demand side participation
Payment structure inadequate, penalty structure is a critical barrier
Requirements act as a significant barrier to aggregated consumer participation
Payment structures seem inadequate, penalty structures create high risk issues
Requirements are under development or have limited negative impact, but do not act as a significant barrier Requirements are well defined and enable aggregated consumers to participate in demand reponse
Payment structures are weak or result in unequal pay per MW between supply and demand, penalty structures create risk issues for service providers but participation is still Payment and penalties are fair and adequate N/A
N/A
Source: SEDC (2014), Mapping demand response in Europe today, April 2014
20 April 2015
Source: SEDC (2014), Mapping demand response in Europe today, April 2014
147 A report to The European Commission
8.4
Economic regulation of DSOs
The economic regulation of the DSOs is important as it provides the basic economic incentives for the DSOs. The regulation could therefore affect the decisions of DSOs of whether they should invest in more grids and physical infrastructure or solve (some) network problems by using DER and changing the operation of the grid. The first alternative would imply an increased CAPEX, while the second alternative would keep CAPEX lower but likely result in an increased OPEX. Generally speaking the monopoly regulation of the DSOs typically does not provide good incentives for CAPEX-OPEX optimization, and this is in particular the case if the CAPEX-OPEX optimization occurs over time, i.e. not within one regulatory period. The economic regulation of distribution networks should broadly speaking both provide incentives for efficiency and be cost-reflective. However, it is not easy to achieve both these aims simultaneously. Regulatory models with a high focus on cost-reflectiveness for the individual DSO typically provide relative weak incentives for efficiency as the actual cost of the individual DSO to a high degree will be pass-through into the regulated tariff or revenue cap. Models with a strong emphasis on efficiency cannot allow for a high degree of cost pass-through and will therefore not be cost reflective to the same extent. Regulatory models with strong emphasis on efficiency will therefore also allow for informational rents to the DSOs that are relatively more efficient. In reality, all regulatory models are compromises with varying emphasis on cost-reflectiveness and efficiency incentives. Monopoly regulation also has the more general underlying purpose of customer protection, i.e. preventing the regulated monopolies from overcharging its customers, and from this follows that it would be natural to focus on keeping the costs for the services low. At the same time the customers have a long term interested in maintaining a stable grid and that the necessary investments are undertaken. The regulation therefore should also provide appropriate incentives for investments. Depending on the details of each national regulation there could be specific incentives for stimulating investments, increasing quality, reducing operating costs etc. This is not necessarily sufficient for the future regulation that needs to accommodate for a high share of distributed energy resources, provision of new services and management of more complex flows. Network regulations typically remunerate CAPEX, subject to some used-and-useful provision, at a regulated cost of capital. That means that investments in new physical network assets will be remunerated, but solutions increasing OPEX may not be remunerated. OPEX are remunerated using different approaches. In some cases it is mainly backward looking on a company level with an efficiency requirement and in other cases more sophisticated benchmarking methodologies are applied. In the first case increased OPEX, that decrease CAPEX today or CAPEX and/or OPEX in the future, is not rewarded at all or in the best case with a lag. This creates an incentive to use CAPEX intensive solutions and distort the trade-off between CAPEX and OPEX. In the second case, sophisticated benchmarking methodologies could in principle handle this and provide incentives for a trade-off between CAPEX and OPEX. However, in practice it is likely to be difficult. First of all, the value of the services provided by the DSO needs to be measured. The output
Study on the effective integration of Distributed Energy Resources for providing flexibility to the electricity system
measures used are typically simple output measures such as delivered energy or essentially input oriented measures relating to the size of the network, number of connection points etc. There is generally a need to develop the economic regulation of DSOs to allow DSOs to efficiently deal with potential trade-offs between CAPEX and OPEX. This could potentially include the possibility to use distributed energy resources, rather than investing in grid assets. Regulators are however facing a very difficult task here, and there are no apparent or simple solutions. To the extent that the CAPEX-OPEX trade-off occur in the same period a regulatory model focusing more on total costs rather than CAPEX and OPEX separately could facilitate the optimization. Regulators could for instance allow an increase in the OPEX allowance, if the DSO can demonstrate the CAPEX saving. This easily could be burdensome both for the DSO and the regulator, and the regulator will also have difficulties verifying the claims of the DSO. Still, the approach would in principle be rather simple. However, we would expect that in many cases it may be necessary for the DSOs to invest in both physical equipment (e.g. metering, sensors, control equipment) and analytical and operational capabilities in order to avoid future investments. This would imply that the CAPEX-OPEX optimization occurs over several regulatory periods and a total cost methodology would then not be sufficient. Allowing increased OPEX against a possible but uncertain CAPEX saving in the future is significantly more difficult as it will automatically involve many assessments around the future development. One possibility, although far from perfect, would be to allow a certain OPEX add-on to investments in certain equipment in the grid to allow for needed analysis and operation. In order for this not to be only a wind-fall profit for the DSOs that make such investments, it would have to be surrounded by certain requirements and control mechanisms. The need to demonstrate a link to future CAPEX savings would however be limited or could be excluded entirely. It is outside the scope of this report to develop the regulatory models that better could meet the future needs, but we point at the need for such development.
8.4.1
Classification of storage and unbundling of distribution
Energy storage can be used to supply several different services. It can be used to supply energy during high demand periods and e.g. solve transmission congestion problems. This would require participation in (wholesale) power markets. However, an energy storage located in a distribution grid could also provide e.g. distribution congestion services. It could then be regarded as a network component, which is included in the regulated business. For the latter it could be natural for a DSO to own and operate energy storage facilities with this purpose and it could also be an efficient solution. The DSO would then buy and sell energy to operate the storage scheme. Given the importance that the DSO is a neutral market facilitator such market participation could however become problematic. With a more active operation of the distribution grids, the unbundling might become more challenging. However, the capacity the energy storage may not at all time be needed to supply distribution services, and would then in principle be available for supplying other services to the market. The DSO is not allowed to be a market participant, restricting the possibilities for using a DSO owned energy storage in a way that provides most value. In many cases there are also significant uncertainties on whether, and to what extent, DSOs can invest in storage. 20 April 2015
149 A report to The European Commission
Study on the effective integration of Distributed Energy Resources for providing flexibility to the electricity system
One possibility would be for an independent party to own and operate the energy storage and sell distribution services to the DSO, and other services to other market participants. Whether this option is economically feasible partly depends on the economic regulation of electricity distribution networks, as discussed above. Independent ownership and operation of storage also has its pros and cons. One clear advantage is that an independent party could operate more freely, without the restrictions necessarily put on a regulated entity and thus be able to capture value streams from more sources. On the other hand, it may be more efficient to have storage and distribution under the same control if the storage to a large extent is used to serve the distribution network. The network regulation may also prevent or restrict the ability of a DSO to compensate certain services provided ‘behind the meter’. Storage located ‘behind the meter’ can often not be included in the regulated asset base. While there are many good reasons for this it could also distort the incentives, e.g. towards network reinforcements rather than use of energy storage. While it is likely to be difficult, and from many perspectives questionable, to include such storage in the regulated asset base of the DSO, the approach should rather be that the DSO buy services directly from the storage owners or from aggregators. In order to avoid market distortions the unbundling between monopoly and competitive parts of the market is crucial. While this may create barriers in some areas, it is also important that the regulation has clear unbundling rules.
8.4.2
Network tariffs
The distribution tariffs are subject to monopoly regulation, although there are significant differences in the details of the regulation. While the regulation applies to both tariffs for consumers and producers, the tariffs for these groups are typically designed differently. There is also a wide range of different tariff types (power tariff, ToU power tariff, Progressive tariffs, etc.). In principal, the tariffs should be designed so that they put the cost of operating and offering the sufficient grid capacity to end-users (and producers) in a non-discriminatory fashion. For energy storage, where the main purpose not necessarily fits in under production nor consumption, but rather providing system services for one or several actors (DSO, TSO, BRP, etc.), the historical tariff design is perhaps not suitable with the clear distinguishing between producer or consumer tariffs. Assuming a properly functioning market, that effectively remunerates a certain provision with the true value of a particular product, the energy storage will ease the operation of the system (hence the (positive) value of the product), thus should not be penalized with a cost burden. Assuming a flat tariff, where the energy storage owner is faced with a cost per unit of energy transmitted (actually twice the cost, since there will be a cost for charging and discharging of the energy storage), this will put a wedge between the true value of providing a particular service (reducing, for example, the grid load, thus reducing the distribution losses) and the marginal value (total income – total costs = marginal value). Progressive tariffs might lead to even more perverse effects. This is however not new, as the same issues also relate to large scale pumped storage. Pumped storage has in some countries not been charged for the transmission of pumping electricity. This was previously the case in Germany, but in 2008 the regulator decided to charge grid fees for pumping electricity in the same way as for other consumption (Steffen, 2011).
20 April 2015
150 A report to The European Commission
Study on the effective integration of Distributed Energy Resources for providing flexibility to the electricity system
8.4.3
Taxation and surcharges
Energy taxes are typically paid based on consumptions. It is common with different exemptions from, or reduction of, energy taxes. For example, electricity consumed for power production could be exempted which may then apply to e.g. large scale hydro pumped storage. Distributed storage technologies may not always have the same exemptions. If storage in the tax legislation is considered as end-consumption and subject to electricity tax it will create a wedge between the price paid for the electricity when charging the storage and the price received when discharging. If the main value driver for the storage is this arbitrage, the price differences needed to finance the storage would have to go up. The business case and profitability of energy storage schemes are directly affected by the taxation regime, as the electricity tax will be applied as an uplift to the energy storage, providing an effective barrier to the provision of flexibility from grid connected energy storage schemes. In addition the storage is not end-consumption as such, but the electricity will rather be taxed twice – first when it is used to charge to storage and secondly when it is used for the final consumption.
8.5
Technical barriers
In general, installations connected to the distribution grids are smaller than (aggregated) demand, storages and supply connected to the transmission grid. The size of the installations is one main technical barrier to exploit the flexibility potential from DER, as it will require coordination and communication with many small resource providers. Aggregation of single installations is key prerequisite for participation in existing electricity markets. Aggregation requires communication infrastructure. Smart meters are one step forward to facilitate DER flexibility. Only if information is available, consumers and small generators can decide if they want to react to incentives that require change of demand or generation. The potential for demand response or flexibility utilization of small generation facilities grows exponentially, if the communication infrastructure is bidirectional. Remote control offers the possibility to automatic response to incentives from markets, transmission grid operators or distribution grid operators. The second key technical barrier is time dependence of demand and supply. Electricity demand is no end in itself. Electricity is needed in production processes, for lighting or leisure activities. Only small parts of the consumption can be shifted to other points in time. Generation technologies at distribution grid levels are often cogeneration plants that are run according to heat demand. In this case, heat storage technologies can shift parts of the heat demand and therefore the according electricity generation in time. Generation from VRES are depending on weather, their generation cannot be shifted in time. Also storage facilities have time limit on their demand and generation. They can only provide electricity if they have been charged before and their storage capacity is in general limited. Additionally, specific storage technologies deplete electricity in time, especially flywheels. Flexibility potential from DER has a geographical component. Distribution grids are small subsystems with limited geographical scope, especially compared to transmission grids. If there are few flexible DER in the region of one distribution grid, options for flexibility services to the according DSO or to the system level are limited. 20 April 2015
151 A report to The European Commission
Study on the effective integration of Distributed Energy Resources for providing flexibility to the electricity system
Other technical barriers are low full cycle efficiency of storage facilities and increased wear off at installations that provide flexibility services. Power to gas has especially low full cycle efficiencies of less than 40%. 60% of the electricity is lost if the stored methane is used in gas fired power stations to generate electricity at a later point in time. Increased wear off is mainly the case for generation technologies that change their generation level and for storage technologies that have a limited number of cycles like batteries.
20 April 2015
152 A report to The European Commission
Study on the effective integration of Distributed Energy Resources for providing flexibility to the electricity system
9
Key findings
The European Commission’s 2030 policy framework for climate and energy aims towards decarbonising the European energy system, and promotes increased shares of renewable energy. Furthermore, renewables are becoming increasingly competitive. In total, the share of variable renewable energy is expected to rise leading to an increasing need for system flexibility. The effective integration of DER for providing flexibility to the electricity system is important for the realisation of this goal. Flexibility should be sought at all system voltage levels. However, the increased penetration levels of DER expected in future systems necessitate the incorporation of flexibility from supply and demand as well as energy storage connected to the distribution grid level. Physical and/or institutional extensions of market areas and changes in market regulation are needed to open access to flexible distributed resources in both time and geography.
9.1
The power system changes
Demand for flexibility is strongly increasing at system and local level. On a system level (i.e. transmission), the residual demand analysis of the power systems of different European countries under scenarios of increasing VRES (Variable Renewable Energy Sources) shares highlights the growing global flexibility gap. Generation from VRES increases the residual demand variability and results to steeper ramp rates on different timeframes. On a local level (i.e. distribution), rising shares of DER connected to distribution grids lead to a transformation of distribution networks from passive to active systems. DSOs have to handle a series of operational issues (voltage problems, reverse power flows, congestions and increased losses) arising from the shift towards a decentralised power supply and a shift from a passive operation of distribution networks to a more active operation. Supply of flexibility via centralised power plants is becoming more complex and uncertain. VRES, with close to zero operational costs, replace generation from conventional power plants. This transformation of the generation structure depresses market prices due to oversupply. Central power plants with high variable costs (e.g. gas power plants) leave the market. In the long run, the number of programmable power generation units in the market decreases, in particular peaking plants that traditionally have provided a large part of the flexibility in the system. One solution to finance flexible central capacity is capacity payments, allowing financing additional investments and at the same time preventing price peaks. However, depending on their regulation, they could add distortions to the market. If the capacity payments lead to overcapacity, market price volatility is reduced. Therefore, the incentives for storage and demand flexibility are reduced. Making future markets provide sufficient incentives for peaking capacity and flexibility is a key challenge towards systems with higher VRES shares. Flexibility options should be considered in system planning as alternative of grid reinforcements. Grid reinforcements need time and cannot take the same pace as installation of new DER. Planning of necessary grid extensions requires forecasts of demand and supply. Especially in distribution grids, local developments of DER are hard to predict. In particular, planning reinforcements simply to meet peak demand is in many cases not the most cost-effective option, as the nominal capacity of the new grid assets is used only a few hours per year. Moreover, while the installation of additional generation capacity is a question of months, it can take several years to install additional 20 April 2015
153 A report to The European Commission
Study on the effective integration of Distributed Energy Resources for providing flexibility to the electricity system
grid lines. Contracting DER flexibility should be included among DSOs’ options in the planning phase as an alternative to grid reinforcements.
9.2
Distributed Energy Resources can provide flexibility
DER flexibility options are already available. Plenty of (theoretically) controllable demand, storage and generation units are connected to distribution grids. A key precondition for uncapping their flexibility potential is appropriate communication infrastructure, which in many cases is becoming available due to parallel developments (e.g. roll-out of smart meters). Numerous pilot projects are ongoing and their return of experience is expected to further reduce the implementation costs of DER flexibility. Technological evolutions are reducing the cost of DER flexibility. The Levelised Cost of Electricity (LCOE) from VRES and of distributed storage decreases constantly. Manufacturers increasingly provide built-in smart functionalities into power assets. Economies of scale are expected to drive down device costs (e.g. costs of electric vehicles; batteries etc.) and the on-going standardisation in Europe is expected to reduce transaction costs due to lack of interoperability. Cost-effectiveness of DER flexibility is on the rise overall. On-going evolutions in the electricity, transport and heat sectors are leading to the deployment of infrastructures which enable DER flexibility and reduce implementation costs: ■ ■ ■
The deployment of EVs and charging infrastructure (driven by transport policy incentives) provides part of the enabling infrastructure for activation of EV flexibility. The deployment of smart meters (driven by policy decisions), is laying the foundations of the enabling infrastructure for activation of demand flexibility.64 The deployment of smart home devices, mainly driven by domotics market developments and the internet of things (IOT) is supporting the activation of demand flexibility, particularly at residential level (e.g. via smart thermostats). 65
The potential value of DER flexibility is expected to increase as VRES penetration increases. The supply will become more volatile as VRES shares are increasing and conventional power generation is replaced. The more volatile supply will lead to larger price volatility strengthening the business case for provision of flexibility. The value of flexibility will vary both across time and space. In many markets the marginal value of flexibility is low since there are still significant amounts of relatively cheap central flexible resources available. In those markets it will be more difficult for flexible DER to be competitive. The value of flexibility changes for the different operational instances, depending on the instantaneous penetration levels of VRES. High instantaneous VRES levels often relate to a higher instantaneous value of flexibility. Further, the grid is a key enabler for the access to cheap flexibility. In case of grid bottlenecks, the value of flexibility is expected to variy geographically in each node. 64
It should also be recognized that not all types of demand flexibility will require smart meters. Some business models for flexibility are expected to build on appliances and equipment communicating via IOT communication infrastructure, even before the implementation of dedicated smart metering infrastructure. 65
20 April 2015
154 A report to The European Commission
Study on the effective integration of Distributed Energy Resources for providing flexibility to the electricity system
Electricity customers will be central for realizing DER flexibility. The electricity customers are in control over demand response, and by turning into prosumers they will also have access to generation. The institutional framework should set adequate incentives to activate their provision of flexibility. The aggregator role is crucial for enabling DER flexibility. Aggregators already play a key role to facilitate market integration of DER flexibility in aggregated portfolios. This allows creating economies of scale which reduce the costs of marketing DER. Moreover, aggregators are expected to play an increasingly important role in marketing distributed generation, especially as feed-in tariffs start fading away. A competitive regime and a place for independent aggregators in organized markets is needed. The market places and design should resolve solution of conflicts that may arise with other market participants (e.g. actions incurring imbalances on third party market participants, etc.).
9.3
There are still barriers for Distributed Energy Resources
The full potential of demand response will not be realized without further action from national policymakers, regulators and energy companies. The existing EU policy and regulatory framework makes flexibility from DER possible, but several barriers remain. The market value for flexibility (at system level) is currently low. The market value of flexibility is at present not always sufficient to cover needed investment and operational costs. However, the value at system level is expected to grow with the growth of VRES. Therefore, provided that there is an appropriate market design, a current low market value is not a reason to give DER specific support. Inadequate market design and price regulations distort price signals for the value of flexibility. A market model will always be a simplification of the real system. It is therefore necessary to strike a balance between an accurate representation of the system and a transparent market model. Examples for the geographical representation are the size of bid zones or use of nodal pricing. The temporal resolution comprises the length of imbalance settlement period. Changes in the market design could contribute to revealing the value of flexibility. The current market design has been built up based on the needs of central generators. Central generators have been, and still are, vital to the power system and markets have to a large extent been adapted to their needs. Examples include bid size, gate closure times and other product definitions. Regulatory changes to facilitate market inclusion of DER are however being pursued, for example through decreases in minimum bid sizes and bid increments and active measures from some TSOs to include DER in providing balancing services. Local needs for flexibility can only be resolved by local provision of flexibility. This indicates a need for local markets, or other local procurement mechanisms. Local markets may easily become highly concentrated creating challenges related to liquidity and market power. Individual resource providers could have a significant impact on the (shadow) value of flexibility, leading to situations where the market price ex-post is not sufficiently high. Energy storage schemes can be used to alleviate local grid congestions, and is already deployed in some regions (example with Italy and Enel can be found on page 40).
20 April 2015
155 A report to The European Commission
Study on the effective integration of Distributed Energy Resources for providing flexibility to the electricity system
Taxes and tariffs may constitute a barrier for DER flexibility. If charging of storage is regarded as consumption, energy taxes may be levied upon the charging, potentially undermining the business case. Storage may also need both a consumption and generation agreement with the network owner, again increasing the costs for storage. Where net metering is applied over a longer time period, e.g. a year, the prosumer’s net purchase is regarded as its total purchase. In this case, price signals are not taken into account which might hinder provision of flexibility. A balance should be achieved between deployment of net metering for the promotion of small-scale generation, and appropriate incentives for flexibility provision by market signals. The economic regulation of grid operators often lacks appropriate incentives for the use of DER flexibility, in particular an optimal choice between OPEX and CAPEX. DER flexibility can be used to replace current or future grid reinforcements (driving CAPEX), but may increase OPEX. This is particularly difficult to address when current OPEX increases in order to reduce future CAPEX. The value chains interact with each other and give rise to conflicting interests. Conflicts are anticipated in both the deregulated and regulated sectors of the power market. The conflicting interests relate sometimes to financial conflicts, but also to the need for coordination in order to avoid aggravated actions, for example in DSO and TSO real-time operation.66 The procurement of flexibility will vary in both planning horizon, and procurement mechanism. As different provisions of flexibility will be activated with different frequencies, and thus remunerated differently, the need for different trading horizons and products is needed. The same underlying flexibility provision could (theoretically) be procured for several different services, indicating the need for procurement coordination.
66
For example, in situations when the needs for flexibility at system and at local level are in opposite direction: e.g. downward regulation need at system level and upward regulation at local level. in this case an activation of local DER flexibility would serve conflicting needs of TSOs and DSOs 20 April 2015
156 A report to The European Commission
Study on the effective integration of Distributed Energy Resources for providing flexibility to the electricity system
10
Recommendations
10.1
Flexibility needs adequate markets and remunerations
The market model needs to adequately represent the system in geography. Market areas should be defined according to the physical operation of the grid and the available grid capacity. This is not necessarily congruent with national borders. In the future, local markets might be needed to uncap flexibility at distribution level. The market model needs to adequately represent the system in time. Many European markets have imbalance settlement periods of one hour. This might not be enough to reveal the value of flexibility services. The market model should capture all relevant flexibility products, and trade with an appropriate delivery (and planning) horizon. Markets need to be liquid. With smaller bidding zones (related to geographical aggregation of demand and supply) the risk for illiquid markets increases. Such a geographic partition combined to shortening of imbalance settlement periods may lead to increased administrative and computational burden on market participants and stakeholders, thus reducing the liquidity of certain products. For very local services it is unlikely that liquid markets can be developed, e.g. to solve network problems in a DSO network. In those cases it will rather be the DSO using direct procurement of certain services under regulatory oversight. Options include tendering and bilateral agreements, as well as technological requirements on equipment. These options do not reveal the market value for the services provided, and should not be used more than necessary. The actual market design will need to be carefully balanced between representation and complexity, and there is no one-fits-all model. Regulation based on TOTEX is recommended to provide appropriate incentives for the use of “smarter” solutions. The regulation should focus on total costs (TOTEX) rather than capital cost (CAPEX) and operational costs (OPEX) separately. The DSO would then be free to decide on approaches that could either affect CAPEX or OPEX, such as to use DER to solve network related problems rather than investing in additional network infrastructure. Capacity payments might be needed in some cases. If services are needed with relatively low frequency or that cannot be supplied by a liquid supply side, capacity payments might be needed. This is in particular likely to be the case when a service is indispensable and there are severe consequences if the service is not provided. DER should have access to those services on equal terms as other resources, without unjustified limitations. To solve problems that occur frequently and for which there is a liquid supply side, the need for holding reserves is limited and continuous energy payments should be sufficient. Regulators have to ensure neutrality and transparency. DSOs should be motivated to use more targeted approaches, e.g. different bilateral arrangements. DSOs should analyse the specific needs and conditions for different services in order to apply the appropriate procurement mechanism as well as to provide justification to regulators. One of the challenges is to formulate the DSO regulation such as to ensure that the profit from avoided costs is shared between DSOs and flexibility providers, while ensuring DSO neutrality. 20 April 2015
157 A report to The European Commission
Study on the effective integration of Distributed Energy Resources for providing flexibility to the electricity system
Network tariffs need to reflect the needs of the specific grid. The DSOs should be allowed flexibility in designing the tariffs in order to find the solutions that best meet the local needs and provide the proper incentives, subject to non-discriminatory rules. DSOs are likely to have better information than regulators on how tariffs can be optimally designed in individual networks. Optimal regulation would therefore imply that the regulation focuses on the overall revenue cap rather than individual prices/tariffs. We recommend regulators and policy makers not to regulate detailed tariffs, but limit this to a possibility of reviewing whether tariffs are non-discriminatory. Price pass-through is needed. Regulators and policy makers are recommended to avoid regulatory models that prevent price pass-through to market participants. A concrete example would be feed-in tariffs when the true marginal cost exceeds market prices, leading to a suboptimal operation of the system. Feed-in tariffs hide this negative margin as producers are not exposed to the true market prices but rather only to the feed-in tariff. In order to facilitate for flexibility provisions from prosumers it is recommended to include price signals in net metering. Net metering without flexibility price signals hide the value of flexibility, since the temporal variation in prices within the net metering period effectively is removed. While net metering may be an effective measure to support the deployment of distributed generation, it may at the same time remove incentives to provide flexibility. Net metering could be applied in different ways, e.g. over different time frames and covering different parts of the overall energy cost (grid, energy supply, taxes). In order to support provision of flexibility from distributed generation, regulators and policy makers should avoid regulatory models that prevent price pass-through to market participants. For instance, including price signals in the net summation could allow for activation of flexibility. The TSO should ensure that imbalance price signals are not distorted and market design allows all different kinds of providers to participate on the balancing market. For example, capacity payments for balancing resources should be reflected in the price of balancing energy (i.e. cost for imbalances) rather than socialized via the transmission tariff. TSOs should design cost allocation mechanisms in a way that ensures that capacity payments are reflected in the price of balancing energy. The cost allocation should be harmonized with the relevant imbalance settlement period to the largest extent possible. Market rules and product definitions are in many cases reflecting the needs and requirements of traditional centralized flexible resources, hindering the participation of DER. Some important examples are: ■
■
Minimum bid size and bid increments should facilitate balancing market access for DER. The recommendation towards TSOs is to work towards a goal of lowering minimum bid sizes and bid increments. Furthermore, we recommend that regulators should consider introducing regulatory requirements on the TSOs, in particular if this process is slow. Activation rules should facilitate demand side participation. Demand side participation is sensitive to activation rules such as activation time, duration and frequency. While such rules naturally need to reflect the system requirements, the rules could in many cases be adapted to facilitate market access for demand side resources. If longer activation periods (duration) or a higher frequency is needed than what might be suitable to demand side resources, the demand side resources could be divided in groups so that only a part of the available resources are activated each time. The unused resources could then be used to stretch the activation periods or increase activation frequency. The recommendation is that
20 April 2015
158 A report to The European Commission
Study on the effective integration of Distributed Energy Resources for providing flexibility to the electricity system
the TSOs should design activation rules in ways that facilitate demand side participation, e.g. avoid too long activation periods for individual demand side resources. The TSOs should be required to analyse the impact on demand side participation of participation rules in different markets, and ensure a level playing field.
10.2
Regulators have to establish a level playing field for all actors
In the transformation of the traditional power market the regulator needs to ensure a level playing field for both the existing and new market participants. The biggest changes compared to the traditional model are anticipated to be for aggregators, TSOs and DSOs. A level playing field ensures that the most competitive resource has access to relevant markets and products. Aggregators The aggregator role and responsibilities in many cases need to be further clarified. Aggregators are important in order to activate the full potential of DER, both on the demand side and for distributed generation. While facilitating market access for aggregators is important, all market participants need to be responsible for the consequences they have on the system. Any actions or transactions done by aggregators should not affect third party, both in terms of volumes and monetary terms. If a certain provision affects a third party it should be ensured that the affected party is informed, and if applicable any effect should be corrected for ex-post. The need for coordination between different market participants will differ depending on whether it relates to non-energy or energy resources supplied, as well as to whether it delivers services to the regulated or unregulated market. The TSO (or possibly DSO) should open for possibilities to revise the ex-post settlement process. In order to provide ancillary services (balancing or congestion management), the TSO/DSO needs to revise ex-post settlement processes in order not to financially penalize (or remunerate) third party market participants. This flexibility from end-consumers has already been deployed (Austrian frequency containment reserve and water heaters), indicating that balancing resources is in general simpler since they don’t affect third party market participants. Aggregators need balance responsibility for market participation. They can either be a BRP themselves or have an agreement with a BRP. This implies that if an aggregator is working with an end-user that has a third party supplier, it is necessary to either be able to separate the balances or that the aggregator obtains an agreement with the supplier/BRP of the customer. We recommend licensing of aggregators, similar to today’s licensing of balance responsible parties. It is important that the licensing or certification requirements of aggregators are kept at the minimum level, in order not to create unnecessary entry barriers. DSO & TSO It is necessary to develop an institutional arrangement that facilitates coordination between the DSO and TSO. This could possibly be a platform for bid exchange and activation. DSO grid operation is expected to become more complex, increasing the need for active operation similar to the transmission grid operation as per today. The DSO’s actions might affect the TSO’s operations, thus 20 April 2015
159 A report to The European Commission
Study on the effective integration of Distributed Energy Resources for providing flexibility to the electricity system
indicating the need for coordination between the DSO and TSO. Some services require actions from both TSO and DSO simultaneously. A potential conflict between the DSO and TSO will need to be resolved subject to physical constraints. To this end a clear regulatory framework should be designed to handle conflicting physical needs. It is important to distinguish between competition for the same flexibility provision, which should be resolved based on the willingness to pay (market-driven resolution of the conflict), and contradicting physical needs (resolution of the conflict according to what is optimal from a technical point of view). Energy storage schemes Tax exemptions should be extended to all energy storage consumption. Tax exemptions, similar as for e.g. large scale hydro pumped storage, would reduce the wedge and facilitate for distributed storage. We recommend policy makers/regulators to exempt distributed storage facilities from consumption tax on electricity, in order to avoid creating wedges undermining the profitability of storage solutions and ensuring a level playing field. Storage should not be double charged for consumption and generation subscription fees. Storage may also face barriers created by the design of network tariffs, by having to pay subscription fees both for consumption and generation. This could be the case both for large scale storage and distributed storage. While storage naturally should pay for the costs it causes to the network, it is counter-productive to charge double network fees. We recommend network operators (DSOs and TSOs) as well as regulators to avoid charging both consumption and generation subscription fees to storage, unless it can be clearly motivated what costs that the storage causes in the network. In the case where the DSO is using energy storage schemes for alleviating grid congestion there is need for a further development of the regulation, in order to ensure that a level playing field is maintained and to avoid any competition distortion.
10.3
The future is consumer centric
Traditional power markets are expected to be transformed into more consumer centric markets. The need for and willingness to pay for electricity originates from the consumers of electricity, thus the emphasis should be on consumers rather than central suppliers. The central suppliers of electricity will need to adapt to the needs and terms of the consumers. This will be further accelerated in a system where distributed energy resources are well-established participants, and the consumer’s role will grow stronger with the introduction of e.g. demand response. The customer must be in control of its metering data. Third party solution providers should have permission from the customer to access the data. There are different approaches to data handling (e.g. central data and service hubs, peer-to-peer etc.), which have their pros and cons. Whatever solution is chosen it is important that data access is easy for third party providers and that potentially discriminatory behaviours from incumbents are prevented. Grid operators should use existing communication infrastructure whenever possible. While advanced metering in general is important for settlements, there are other opportunities than using the official meters. Sensors, control and communication equipment e.g. using internet infrastructure can 20 April 2015
160 A report to The European Commission
Study on the effective integration of Distributed Energy Resources for providing flexibility to the electricity system
often be cost efficient, as long as they do not pose a threat to the system security. The recommendation to DSOs, TSOs and regulators is to use existing communication infrastructure and procedures whenever possible, and to be open to adapt processes in order to harvest the full potential from all providers of flexibility. Specific recommendations on which actor should decide whether a certain metering technique is eligible cannot be made, but depends on which flexibility provision and product that is delivered. The user of the flexibility provision is to determine whether the specific metering technology is sufficient and most efficient. The Austrian Frequency Containment Reserve example with the water heaters once again can be used as an example where cellular SMStechnology for communication and activation is used. Requirements on data handling have to be non-discriminatory. This implies that regulators must put up sufficiently stringent requirements ensuring that actors responsible for data management (e.g. DSOs, central data hubs, etc.) make necessary data available with high reliability. For instance, it should be possible to access data without delays, i.e. due to manual handling of requests, downtime of IT-systems or similar barriers.
20 April 2015
161 A report to The European Commission
Study on the effective integration of Distributed Energy Resources for providing flexibility to the electricity system
11
References
ACER/CEER (2013). Annual Report on the Results of Monitoring the Internal Electricity and Natural Gas Markets in 2012, Joint publication of ACER and CEER, November 2013 Ackerman, T., & Knyazkin, V. (2009). Interaction between distributed generation and the distribution network: Operation aspects. Yokohoma,Japan: IEEE Transmission and distribution conference and exhibition , Asian Pacific. Ackermann, T., Andersson, G., & Soeder, L. (2001). Distributed generation: a definition. Electric power systems research, 195-204. BDEW. (2013). Einschätzungen und Empfehlungen zu zukünftigen strommarktrelevanten Anforderungen an Flexibilität. Berlin: Bundesverband der Energie- und Wasserwirtschaft e.V. BET. (2013). Möglichkeiten zum Ausgleich fluktuierender Einspeisungen aus erneuerbaren Energien. Study for the German association for renewable energies (BEE). Bhatnagar, D., A. Currier, J. Hernandez, O. Ma and B. Kirby (2013), Market and Policy Barriers to Energy Storage Deployment, Sandia Report, Sandia National Laboratories, September 2013 Bundesministeriums der Justiz und für Verbraucherschutz und Juris GmbH. (2012, 12 28). Verordnung über Vereinbarungen zu abschaltbaren Lasten. Retrieved 7 10, 2014, from http://www.gesetze-im-internet.de: http://www.gesetze-im-internet.de/bundesrecht/ablav/gesamt.pdf Bundesverband Erneuerbare Energien, Arbeitsgemeinschaft Fernwärme. (2013). Flexibilitätsreserven aus dem Wärmemarkt. Coster, E. J. (2010). Distribution grid operation including distributed generation. Eindhoven: Eindhoven University of Technology. Damsgaard, N., M. Lindén, K. Yuen, J. Helbrink, M. Andersson, M. Einarsson, J. Munkhammar, P. Grahn (2014). Framtida krav på elnäten. Elforsk report 14:26 Deutsche Energie Agentur. (2012). Ausbau- und innovationsbedarf der Stromverteilnetze in Deutschland bis 2030. Berlin: DENA. ECOFYS. (2008). Study on the comparative merits of overhead electricity transmission lines versus underground cables. Study commissioned by the Department of Communications, Energy and Natural Resources of Ireland. Retrieved September 2011, from http://www.dcenr.gov.ie/NR/rdonlyres/89F75A41-0E32-4F70-B34E5477E936B4D2/0/Independentstudytransmissioninfrastructure.pdf ECOFYS. (2011). Lastfolgefähigkeit deutscher Kernkraftwerke, im Auftrag des Deutschen Bundestages. vorgelegt dem Büro für Technikfolgen-Abschätzung beim Deutschen Bundestag (TAB), nicht veröffentlicht. ECOFYS. (2012). Einspeisemanagement in Schleswig - Holstein. Retrieved 7 04, 2014, from http://www.schleswigholstein.de/Energie/DE/Energiewende/Kosten_Energiewende/einspeisemanagement_endbericht_pdf_ _blob=publicationFile.pdf ECOFYS. (2013). Heat pump implementation scenarios until 2030. Study for the European Heat Pump Association. ECOFYS. (2013). Incentives to improve energy efficiency in EU grids. Berlin: Ecofys. 20 April 2015
162 A report to The European Commission
Study on the effective integration of Distributed Energy Resources for providing flexibility to the electricity system
ECOFYS CPI Berlin, TU Wien. (2011). Network extension requirements for an enhanced RES deployment. RE-Shaping: Shaping an effective and efficient European renewable energy market. Authors Nabe, Christian; Neuhoff, Karsten; Boyd, Rodney; Papefthymiou, Georgios; Ortner, Andre, Kar. Retrieved from http://www.reshaping-res-policy.eu/downloads/ReShaping_D13_Network_extension_requirements_final.pdf ECOFYS; TU Dresden; Energy Brainpool. (2012). Preisauswirkungen der Erneuerbaren Energien auf den deutschen Strommarkt. Endbericht Konsortium 2. ECORYS. (2014). The roles of DSOs in a smart Grid enviroment. Amsterdam/Rotterdam: ECORYS. Ernst & Young. (2013). Kosten-Nutzen-Analyse für einen flächendeckenden Einsatz intelligenter Zähler. Study for the German Federal Ministry of Economic Affairs. Eurelectric. (2013). Active distribution system management : A key tool for the smooth integration of distributed generation. Retrieved 6 2, 2014, from http://www.eurelectric.org/media/74356/asm_full_report_discussion_paper_final-2013-030-0117-01e.pdf Eurelectric. (2014). Flexibility and aggregation. Retrieved 6 1, 2014, from http://www.eurelectric.org/media/115877/tf_bal-agr_report_final_je_as-2014-030-0026-01-e.pdf Eurostat (2014). Supply, transformation, consumption - electricity - annual data (nrg_105a) European Commission. (2013). Incorporing demand side flexibility, in particular demand response, in electricity markets. Commision staff working document, Brussels. European Commission (2014). Energy prices and costs report, Commission Staff Working Document SWD(2014) 20 final/2, 17 March 2014 Fraunhofer ISI. (2011). Energietechnologien 2050 - Schwerpunkte für Forschung und Entwicklung. Stuttgart: BMWi. Fraunhofer UMSICHT. (2009). Technologien und Kosten der Biogasaufbereitung und Einspeisung in das Erdgasnetz -Ergebnisse der Markterhebung 2007 – 2008. Fraunhofer-Institut für Umwelt-, Sicherheits- und Energietechnik UMSICHT Ergebnisse der Markterhebung 2007 – 2008. Fuchs, G., Lunz, B., Leuthold, M., & Sauer, D. (2012). Technology Overview on Electricity Storage: Overview on the potential and on the deployment perspectives of electricity storage technologies. On behalf of Smart Energy for Europe Platform GmbH (SEFEP). ISEA RWTH Aachen. Gerwent, R. v. (2006). Distribution generation and renewables : introduction. Leonardo Energy. Hirth, L., & Ziegenhagen, I. (2013). Control Power and Variable Renewables. FEEM Working paper. Holttinen, H., Tuohy, A., Milligan, M., Lannoye, E., Silva, V., Muller, S., & Soder, L. (2013, November/December ). The flexibility workout: Managing variable resources and assessing the need for power system modification. IEEE Power & Energy Magazine. Hundt, M., Barth, R., Sun, N., Wissel, S., & Alfred, V. (2009). Verträglichkeit von erneuerbaren Energien und Kernenergie im Erzeugungsportoflio, Technische und ökonomische Aspekte. Studie des IER im Auftrag von E.On. IEA. (2008). Empowering variable renewables - options for flexible electricity systems. International Energy Agency. Retrieved from http://www.iea.org/publications/freepublications/publication/name,3779,en.html 20 April 2015
163 A report to The European Commission
Study on the effective integration of Distributed Energy Resources for providing flexibility to the electricity system
IEC. (2011). Electrical Energy Storage. Fraunhofer ISE. Annex A features Overview technical data for EES. IRENA. (2012). Electricity Storage and Renewables for Island Power: A Guide for Decision Makers. s.l. : IRENA. Lannoye, Flynn and O'Malley. (2012). Evaluation of Power System Flexibility. IEEE Transactions on Power Systems, 27 (2):922-931. North American Electric Reliability Corporation. (2010). Flexibility requiements and potential metrics for variable: implications for system planning studies. NERC. Rocky Mountain Institute. (2014). The economics of grid defection when and where distributed solar generation plus storage competes with traditional utility service. Rocky Mountain Institute. Schill, W.-P. (2013). Systemintegration erneuerbarer Energien: Die Rolle von Speichern für die Energiewende. Vierteljahreshefte zur Wirtschaftsforschung DIW Berlin. SEDC (2014), Mapping Demand Response in Europe Today. Smart Energy Demand Coalition, April 2014 Seebach, D., Timpe, C., & Bauknecht, D. (2009). Cost and benefits of smart appliances in Europe. Öko-Institut e.V. Sioshansi, R., P. Denholm and T. Jenkin (2012). Market and Policy Barriers to Deployment of Energy Storage, Economics of Energy & Environmental Policy, Vol. 1, No. 2 Steffen, B. (2011). Prospects for Pumped-Hydro Storage in Germany, EWL Working Paper No. 07/2011, Universität Duisburg Essen SUFG. (2013). Utility Scale Energy Storage Systems. Benefits, applications and technologies. State Utility Forecasting Group. Troy, N., Flynn, D., Milligan, M., & O'Μalley, M. (2012). Unit commitment with dynamic cycling costs. IEEE Transactions on power systems, 2196-2205. WECC. (2011). Electricity Markets and Variable Generation Integration. Western Electricity Coordinating Council. Wieben, E., Kumm, T., Hohn, E., Rohr, M. Stadler, M. (2014). The 5% Approach as Building Block of an Energy System dominated by Renewables. Proceedings of the 28th EnviroInfo 2014 Conference, Oldenburg, Germany. Zhou, C., Qian, K., Allan, M., & Zhou, W. (2011). Modelling of the cost of EV battery wear due to V2G application in power systems. IEEE Transactions on Energy Conversion, 26(4), 1041-1050.
20 April 2015
164 A report to The European Commission
Study on the effective integration of Distributed Energy Resources for providing flexibility to the electricity system
APPENDIX
20 April 2015
165 A report to The European Commission
Study on the effective integration of Distributed Energy Resources for providing flexibility to the electricity system
Technological fact sheets DERs can provide different services to mitigate the local and the global flexibility gap depending on their specific techno-economic characteristics. The following factsheets allow a comprehensive overview and comparison of such key characteristics: ■
■
■
■
■ ■ ■ ■
■
Reaction time: Flexibility is needed on different timescales. While frequency control requires immediate reaction in milliseconds, adjustments on planning stage only require changes after several hours or even days. Reaction time describes how fast a technology can react to flexibility needs. Efficiency: is especially important in order to compare the cost-effectiveness of different flexibility options. The number describes the ratio between energy input and output of a flexibility source. Investment costs: All sources of flexibility require initial investments. The given numbers describe the investments that are needed to upgrade existing technologies so they can provide flexibility to the system. If the technology’s only purpose is the provision of flexibility, the full investment costs are taken into account. Variable costs: Variable costs give information about the costs of energy that can be provided to the system. In the case of demand technologies, these costs represent the opportunity costs of consumption. Installed capacity: Some of the flexibility options have already proven their services. The installed capacity gives an estimation of existing flexibility capacity in the EU-28. Lifetime: Most flexibility options require technical equipment which wears off. Lifetime describes the average lifetime under “normal” usage. Flexibility constraints: The maximum energy content, the maximum period of shifting and potential recreation times provides information about technical flexibility constraints. Maturity of technology: Many technical options have proven their flexibility, others are only used in pilot projects. Information about the maturity of the technology is given in this category. Environmental impacts: gives information about environmental issues that might accompany the usage of the flexibility option under consideration.
20 April 2015
166 A report to The European Commission
Study on the effective integration of Distributed Energy Resources for providing flexibility to the electricity system
Biogas power plants Efficiency
Investment costs
Electrical efficiency of motors: 33% to 40% Investment costs range from 3000 €/kW (big installations) to above 6000 €/kW for small installations Levelised costs of flexibility (investment in storage and extension of CHP engine and generator): 1.5 – 2.5 ct/kWhel,
Reaction time
On-off within seconds. Production cost biogas: 12 – 25 ct/kWhel
Variable costs
Cost for biogas upgrading to natural gas quality and biomethane injection: 1.5 – 2.5 ct/kWhel Installations: 20 years, Generator and engine are usually retrofitted after 12 years
Installed capacity
EU-27: ~ 22 GW in 2011
Flexibility constraints
Typical storage capacities of produced biogas are 3-6 hours. Storage can be enlarged to 12 hours. Additional capacity is possible but limited by volume and technology (low pressure storage). Biogas injection into the natural gas grid offers huge storage capacities.
Maturity of technology
The technology is well developed. About ten thousand biogas plants are in commercial operation in Europe. Biogas upgrading and grid injection is well developed with about 100 commercial plants in operation.
Lifetime
Very limited: methane is a potent greenhouse gas, H2S emissions can be toxic, accidents from digester leaks are very rare. Environmental effects
Ramps and part load operation might lead to higher emissions. An environmental advantage is avoided emission by manure treatment (manure emits methane during storage) Economic barriers: Biogas production is expensive compared to other electricity generation.
Barriers
Technical barriers: For flexible operation, additional storage capacity has to be installed Political barriers: Biogas needs governmental support systems because electricity production for some options is too expensive for competitive electricity wholesale markets. Also use of bio energy meets public opposition due to possible impacts to food prices.
Potential role
Biogas offers a renewable energy option with promising flexibility options for application on local and global level.
20 April 2015
167 A report to The European Commission
Study on the effective integration of Distributed Energy Resources for providing flexibility to the electricity system
Combined Heat and Power Warm start: 5 min (small installations) to 3 hours (CCGT)
Electric: 15% (micro CHP) – 46% (CCGT-CHP) Efficiency
Thermal: 81% (micro CHP) – 42% (CCGT-CHP)
Reaction time
Total: 96% (micro CHP) – 88.4% (CCGT-CHP)
Investment costs
Approximate investment costs for heat storage: 9,5 – 24 €/kW el per year
Variable costs
Installed capacity
EU-27: 134 GW CHP
Lifetime
Flexibility constraints
Maximum period of shifting: 4 – 12 hours
Maturity of technology
Established technology in most European markets
Environmenta l effects
No additional effects of flexibility provision
Barriers
Potential role
Cold start: 5 hours (CCGT) Hot start: 50 – 85 min (CCGT) Ramping costs: Micro CHP: 20 €/MWh Mini CHP: 28 €/MWh CCGT CHP: 3 €/MWh 20 – 40 years
Economic barriers: Reduced efficiency compared to electricity only plants, additional investment in heat storage, fluctuations in heat supply Technical barriers: higher abrasion due to ramps, electrical operation highly constraint because of thermal duties CHP is politically supported because of its high energy efficiency. Equipped with heat storage and the necessary control infrastructure, distributed CHP can provide the same services as central thermal power plants.
20 April 2015
168 A report to The European Commission
Study on the effective integration of Distributed Energy Resources for providing flexibility to the electricity system
Variable renewable energy sources
Efficiency
N/A
Investment costs
No technical upgrade needed, only control infrastructure
Variable costs
Installed capacity
EU-28: ~ 106 GW wind, ~ 69 GW solar PV in 2012 (Eurostat)
Lifetime
Flexibility constraints
Up-regulation only to the potential generation capability at the given time.
Maturity of technology
Established technology, further improvement expected
Environmental effects
“Wasted” energy might be replaced by other more environmentally harmful generation (e.g. thermal generation)
Barriers
Reaction time
100%/min Opportunity costs for selling electricity on wholesale markets Wind turbines: 20 – 25 years (EWEA), PV: 30 – 40 years (BSW Solar)
Economic barriers: opportunity costs due to lost production, depending on the payment for generation, curtailed installations have to be compensated, high technical and administrative effort for pooling small units Technical barriers: Specific technical equipment is needed to control installations remotely Political challenges: Lack of public acceptance (wasting “free” electricity) Due to marginal cost of zero, active power control can be used as a cost effective ancillary service like providing negative reserve control
Potential role
Reduction of peaks in production due to a small level of curtailment can decrease the need of additional grid capacity With high penetration levels, active power control can solve the problems in balancing the power system due to high feed in of VRES .
20 April 2015
169 A report to The European Commission
Study on the effective integration of Distributed Energy Resources for providing flexibility to the electricity system
Pumped Hydro Storage Efficiency
Full cycle: 70 – 85 %
Reaction time
40 – 100 %/min
Variable costs
Depending on efficiency and input price of electricity
Lifetime
>13000 15000 cycles >50 years
New installations: 1300 – 2000 €/kW extension of existing plants: 850 – 1300 €/kW Investment costs
Small Scale: 1875 - 3225 €/kW Investment costs for additional storage capacity: 104 – 323 €/kWh (Large small scale)
Installed capacity
World: 127 GW EU-27: 42,6 GW
Flexibility constraints
Maximum period of shifting: Hours to days; extension of storage capacity often not feasible because of geographical reasons
Maturity of technology
Pumped hydro storage is the most prevalent and mature energy storage technology.
Environmental effects
Reservoirs destroy natural habitat and ecosystems Economic barriers: Long return of investment (> 30 years)
Barriers
Technical barriers: low energy intensity, very specific siting requirements Political barriers: low public acceptance or support, high requirements in approval process
Potential role
The storage technology is mostly used as an energy management technology, ideal for load levelling and peak shaving (time shifting of demand and supply) on the global level. It is as well used for power quality measures, and emergency supply
20 April 2015
170 A report to The European Commission
Study on the effective integration of Distributed Energy Resources for providing flexibility to the electricity system
Compressed Air Energy Storage Cold start: 5-15 minutes Full cycle: Efficiency
CAES: 40 - 50%
Reaction time
AA-CAES: 60-75%
Discharging mode: 10% / 3 seconds Charging mode: 20% / min Depending on efficiency and input price of electricity
Investment costs
720 – 1000 €/kW
Variable costs
Installed capacity
Currently only 2 installations 321 MW in Germany110 MW in US
Lifetime
Flexibility constraints
Maximum energy content: 8 – 20 hours, maximum period of shifting: hours to days
Maturity of technology
Low - Only two CAES systems exist in commercial operation, second generation systems (advanced adiabatic) are under development. Smaller scale systems are also possible.
Environmental effects
Cavern must be pressure tight to prevent leakage.
Barriers
>10000 - 13000 cycles 20 – 40 years)
Technical barriers: Geographical barriers: salt caverns and aquifers are less capital intensive than aboveground solutions (e.g. tanks), but they require suitable sites. Economic barriers: High capital costs and long return on investment.
Potential role
So far a large-scale application for medium-term energy storage, time shifting, potential on distribution level not clear.
20 April 2015
171 A report to The European Commission
Study on the effective integration of Distributed Energy Resources for providing flexibility to the electricity system
Flywheels Efficiency
70-95%
Reaction time
Investment costs
1500 – 1650 €/kW
Variable costs
Installed capacity
0.002- 340 MW/unit
Lifetime
Flexibility constraints
Maximum period of shifting: 0.25 hours
Maturity of technology
Low
Environmental effects
“Waste” of energy by efficiency losses
Milliseconds Depending on efficiency and input price of electricity 15 – 20 years 20 000 – 70 000 000 cycles
Economic barriers: High investment cost Barriers
Potential role
Technical barriers: relatively high permanent ‘self-discharge’ losses, safety concerns (cracks occur due to dynamic loads, bearing failure on the supports), cooling system for superconducting bearings Flywheels are often used to provide inertia in island systems. Applied as short term storage with frequent and intensive cycling, often used for stabilisation for weak grids, i.e. inertia and frequency control, power quality
20 April 2015
172 A report to The European Commission
Study on the effective integration of Distributed Energy Resources for providing flexibility to the electricity system
Batteries
Efficiency
Full cycle: Li-ion: 85 – 98 % Redox flow: 60 – 75 % Lead Acid: 75 – 90% NaS: 70 – 85%
Reaction time
< seconds
Investment costs
Li-ion: 815 – 1165 €/kW (LCOE: 515-590 €/kWh) Lead Acid: 1275 – 3675 €/kW Redox flow: 1080 – 2775 €/kW
Variable costs
Depending on efficiency and input price of electricity
Lifetime
Lead Acid: < 3 – 15 years, 250 - 1500 cycles Advanced lead acid: 2200 – 4500 cycles Li-ion: 5 – 15 years, 500 – 10000 cycles NaS: 10 – 15 years, 2500 – 4500 cycles Redox flow: 5 – 20 years, 1000 - >10000 cycles
Installed capacity
Globally about 400 MW
Flexibility constraints
Maximum energy content: Lead acid: 4 – 5 hours, Redox flow: 5 hours; Maximum period of shifting: Minutes to weeks
Maturity of technology
NaS, and Ni-Cd batteries are all mature technologies with example applications for energy storage for grids. Li-ion is often used in portable applications, but on utility scale level, it is still in development
Environmental risks
Recycling of chemical components after decommissioning, thermally unstable metal oxide electrodes (Li-ion), acid could get out (Lead acid), explosion of hydrogen, poisonous lead
Barriers
Economic barriers: High investment costs with short lifetimes, some resources have been scarce, e.g. Lithium Technical barriers: Stability of some batteries are a concern, NaS: high temperature needed to keep salt molten (>300°C)
Potential role
Mainly small scale application at moderate level of VRES penetration. High potential for technical development and cost-reduction Could be used on distribution grid level, while pump storage and other “large scale” technologies work on the transportation grid level Li-ion: High energy density, Power quality, Network efficiency, OffGrid, time shifting, electric vehicle Lead Acid: Off-Grid, Emergency supply, time shifting, power quality
20 April 2015
173 A report to The European Commission
Study on the effective integration of Distributed Energy Resources for providing flexibility to the electricity system
Power to Gas
Efficiency
electricity to hydrogen: ~60% hydrogen to methane: ~83% methane to electricity: ~60% Full cycle: 30-40%
Reaction time
Seconds to minutes
Investment costs
Currently at 3600 €/kW, 1000 €/kW envisaged in 2022; no additional cost for storage in gas grid
Variable costs
Depending on efficiency and input price of electricity
Installed capacity
Few MW
Lifetime
10 – 30 years, 1000 – 10000 cycles
Flexibility constraints
Maximum period of shifting depends on the existing gas grid infrastructure, weeks to months
Maturity of technology
A first MW-scale plant is currently running in Werlte in Northern Germany.
Environmental risks
Direct incorporation of hydrogen into the gas grid can cause problems
Barriers
Potential role
Economic barriers: still high costs, technological innovation necessary Technical barriers: low efficiency, external source of CO2 necessary or extraction from the air (further reduction in efficiency) Seasonal storage, likely to be used in the transportation sector first. The technology raises the prospect of relying on 100% renewable resources by storing surplus electric power in the gas infrastructure and relying on natural gas power plants when VRES generation is low.
20 April 2015
174 A report to The European Commission
Study on the effective integration of Distributed Energy Resources for providing flexibility to the electricity system
Electric Vehicles Efficiency Investment costs
Installed capacity
Flexibility constraints
Maturity of technology Environmental effects
Barriers
Potential role
93%
Reaction time
100 %/min
Depending on efficiency and Variable costs N/A input price of electricity 5-15 (depending 6.5 kW/vehicle (Nissan on the technical Lifetime Aaltra) progress of batteries) Maximum energy content: 29 kWh/vehicle (Nissan Aaltra, depending on temperature), maximum shifting period: hours; flexibility depends on the behaviour and requirements of the car’s driver The maturity of batteries used in EVs is high. However, there is low experience with using fleets of EVs for flexibility provision. The risks are related to the risks from the specific batteries used in EVs Economic barriers: no business model (yet) Technical barriers: very few electric vehicles. Existence of sufficient charging infrastructure. Communication and control infrastructure. Battery technology (low driving ranges, high battery costs) Political barriers: low public acceptance for system use of EVs Provision of balancing and reserve power. Also for solution of more localised problems.
20 April 2015
175 A report to The European Commission
Study on the effective integration of Distributed Energy Resources for providing flexibility to the electricity system
Demand Response in industrial installations Efficiency
95 - 100%
Reaction time
20 – 100%/min
Investment costs
No additional investment costs – communication infrastructure is generally installed.
Variable costs
Depending on process, high value of lost load if production cannot be shifted, but is only reduced
Installed capacity
On average, nearly 120 GW of industrial consumption in EU-27
Lifetime
N/A
Flexibility constraints
Maximum period of shifting without losing production: 1 – 24 hours
Maturity of technology
High, some industrial customers already provide interruptible loads on balancing markets
Environmental effects
N/A Economic barriers: development of potential relies on electricity cost sensitivity and on price spreads in the electricity market. In most of the European markets, overcapacity prevents price peaks. In most of the industrial entities, the high organisational effort is not worth the cost savings by shifting demand to low price hours.
Barriers
Potential role
Technical barriers: potential barriers for specific implementations can be uncertain potential, quality losses in products, short period of shifting, structure of demand (efficient usage of production capacity). Political barriers: contradicting market incentives for constant demand, e.g. grid fees. Short-term and cost-efficient solution, additional potential for complete shut-down in minutes, but at much higher costs (value of lost load)
20 April 2015
176 A report to The European Commission
Study on the effective integration of Distributed Energy Resources for providing flexibility to the electricity system
Demand Response in commercial and domestic sector Efficiency
95 – 100%
Reaction time
100%/min
Investment costs
Costs for control infrastructure
Variable costs
Depending on process and customer
Installed capacity
On average about 92 GW residential demand, and additionally about 92 GW from the service sector
Lifetime
N/A
Flexibility constraints
Maximum period of shifting: 1 -24 hours, depending on process and customer
Maturity of technology
Low, major loads have not yet been equipped with IT-infrastructure
Environmental effects
N/A
Barriers
Economic barriers: Necessary investments in IT infrastructure and data processing, few real time pricing tariffs available and market prices not visible to retail level. Accessing kilowatt-level for pooling loads can be very labour intensive, may have relatively high initial costs, and can take substantial resources to maintain, depends on the primary use of the equipment, which is not designed for flexible operation Technical barriers: uncertain potential, missing communication infrastructure
Potential role
Political barriers: Lack of acceptance or support, data security issues, coordinating utility interests and consumer interests can be a challenging paradigm shift. Demand management might turn out to be the game changer in electricity markets, when flexible demand sets the marginal price in wholesale markets.
20 April 2015
177 A report to The European Commission
Study on the effective integration of Distributed Energy Resources for providing flexibility to the electricity system
Power to Heat
Efficiency
Resistance Heating transfers 1 kWh of electricity to 1 kWh of heat. Efficient heat pumps with ground storage are up to 5 times more efficient.
Reaction time
100%/m in
Investment costs
Costs for control infrastructure
Variable costs
very low
Installed capacity
N/A
Flexibility constraints Maturity of technology Environmental effects
15 – 20 years Maximum period of shifting depends on the isolation of the building. It can be up to 24 hours. In general storage facilities are designed for about two hours. Lifetime
High
Economic barriers: high costs for electricity if extracted from grid, especially for resistance heating (taxes and levies, grid fees). Efficiency of heat pumps a driver for their implementation Barriers
Technical barriers: constrained due to primary operation (temperature limits), efficiency dependent on ambient air temperatures, use limited to specific period of the year Political barriers: fees, taxes, levies
Potential role
The electrification of the heat sector shifts demand from the heat to the power sector, and can simultaneously add significant flexibility to the system. Combining thermal storage with electric heat has the potential to vastly increase the flexibility of the power grid, builds an optional place to put temporary surpluses of power from VRES, and reduce carbon by displacing fossil-fuel heat sources.
20 April 2015
178 A report to The European Commission
Study on the effective integration of Distributed Energy Resources for providing flexibility to the electricity system
About Sweco Sweco’s experts are working together to develop total solutions that contribute to the creation of a sustainable society. We call it sustainable engineering and design. We make it possible for our clients to carry out their projects not only with high quality and good economy but also with the best possible conditions for sustainable development. With around 9,000 employees, Sweco is among the largest players in Europe and a leader in several market segments in the Nordic region and Central and Eastern Europe. Sweco Energy Markets delivers value to our clients through deep insights on energy markets. We work with market design, regulation and market analysis. We support a continuous development of the market and help our clients to effectively participate on the energy markets.
Insights. Delivered.
Sweco Gjörwellsgatan 22 P.O. Box 34044 SE-100 26 Stockholm, Sweden Telephone +46 8 695 60 00 Fax +46 8 695 60 90 www.sweco.se
Sweco Energuide AB Reg. No. 556007-5573 Stockholm Member of the Sweco group
20 April 2015
179 A report to The European Commission


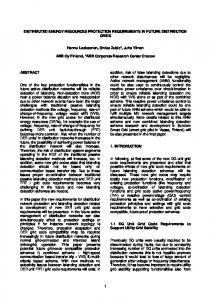

![Business Models for Distributed Energy Resources: [PDF]](https://m.moam.info/img/260x300/business-models-for-distributed-energy-resources-p_64cccb73098a9edc5a8b469b.jpg)


