Studying Task Allocation Decisions of Novice Agile Teams with Data from Agile Project Management Tools 1
1
Jun Lin1,2 , Han Yu1 , Zhiqi Shen1 , and Chunyan Miao1 School of Computer Engineering, Nanyang Technological University, Singapore 2 School of Software, Beihang University, Beijing, China
{jlin7, han.yu, zqshen, ascymiao}@ntu.edu.sg, 2
[email protected]
ABSTRACT Task allocation decisions are critical for the success of Agile teams yet not well understood. Traditional survey/interview based methods limit the scale and level of details of data collection. As agile project management (APM) tools are increasingly adopted, they offer a mechanism for unobtrusively collecting behavior data to support research. In this paper, we demonstrate the advantage of APM tool based method of studying task allocation decision-making in agile software engineering compared to survey/interview based methods. Through the proposed HASE online APM tool, we conducted a study involving 20 novice Agile teams consisting of 119 undergraduate software engineering students over an 8 week period. Analysis of the collected data provides insight into the effects of novice Agile team members’ competence and the difficulty of the tasks assigned on them on their workload variation, their confidence, and the timeliness of completion of these tasks. These findings can be useful in designing situation-aware task allocation decision support systems to serve Agile teams.
Categories and Subject Descriptors D.2.8 [Software Engineering]: Metrics—performance measures
Keywords Agile project management tool; unobtrusive data collection; task allocation decision-making
1.
INTRODUCTION
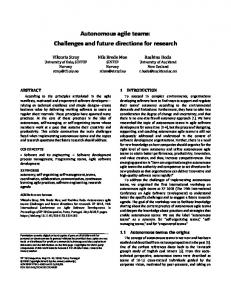
In recent years, Agile software development (ASD) is starting to be used not only by small development teams, but also large software companies [2]. Among the ASD methodologies, Scrum and its variants are the most widely used (adopted by over 70% of agile teams [1]). Scrum is an iterative and incremental ASD methodology. It consists of six phases as shown in Figure 1: 1) conceptualizaPermission to make digital or hard copies of all or part of this work for personal or classroom use is granted without fee provided that copies are not made or distributed for profit or commercial advantage and that copies bear this notice and the full citation on the first page. Copyrights for components of this work owned by others than ACM must be honored. Abstracting with credit is permitted. To copy otherwise, or republish, to post on servers or to redistribute to lists, requires prior specific permission and/or a fee. Request permissions from
[email protected]. ASE’14, September 15-19, 2014, Vasteras, Sweden. Copyright 2014 ACM 978-1-4503-3013-8/14/09 ...$15.00. http://dx.doi.org/10.1145/2642937.2642959.
tion defines the high level deliverables and project roadmap; 2)release planning assigns deliverables into different releases; 3) sprint planning breaks down selected deliverables into technical tasks; 4) in each sprint (e.g., a 7 day period), software development tasks are to be completed by ASD team members; 5) in sprint review/retrospective, team members demonstrate the product increments and reflect on experience gained from the last sprint; and 6) during release the working software is delivered to the customers [3]. The sprint planning phase is crucial for the success of a project. Task need to be allocated to team members while taking into account task precedence, balancing team members’ workload, and ensuring quality. Compared to traditional methods of software development, decision making by ASD teams often exhibit different characteristics. In [7, 8], the advantages for providing automated decision support to ASD teams during the sprint planning phase to help them make effective workload-quality trade-offs when allocating tasks have been illustrated. These systems can be especially beneficial for novice teams who are new to the agile practice. In order to bring such decision support systems into practice, understanding the decisions making tendencies exhibited by agile teams is important. Recently, a number of studies have been conducted to investigate the decision-making process of ASD teams [4, 5, 11]. However, these studies mostly gather data through interviews and survyes. This often limits the scale of the study and lack detailed data reflecting the ASD teams’ task alloca-
Conceptualization
Release Planning
Release
Sprint Planning
Sprint Review/ Retrospective
Sprint Figure 1: The Scrum agile software development process.
tion decision tendencies. Nevertheless, one recent trend ASD project management has laid the foundation to significantly improve researchers’ understanding of the task allocation decision tendencies of ASD teams. An increasing percentage of ASD teams are using agile project management (APM) tools [1] such as Scrumwise 1 . These software tools provide intuitive interfaces for decisions regarding each phase of the ASD process be easily expressed by team members. The decisions, together with their effects on ASD team performance, can be recorded in detail to facilitate data-driven understanding of task allocation decision-making. In order to investigate how useful data from such tools can be for for studying the ASD process, we designed an online APM tool - the Human-centred Agile Software Engineering (HASE ) platform2 . It helps ASD teams manage their projects while unobtrusively tracking data generated during the ASD process to support research in this domain. To understand how valuable data collected from APM tools can be to studying ASD task allocation decision tendencies, we used the HASE platform to conduct a study involving 20 novice ASD teams consisting of 119 undergraduate software engineering students over a period of 8 weeks. To the best of our knowledge, this study is the first large scale study of task allocation behaviors exhibited by novice ASD teams. By analyzing task allocation decisions made for over 700 software engineering tasks by the participants through the Exploratory Data Analysis (EDA) approach [9], we demonstrate the scientific research potential of APM tools by identifying three significant tendencies exhibited by novice ASD teams when allocating tasks.
2.
RELATED WORK
Studies about the decision-making process of ASD teams started to emerge in recent years. In [11], the authors investigated decisions related to software designs. They employed content analysis and explanation building to extract qualitative and quantitative results from interviews with 25 software designers. The study finds that the structure of the design problem determines the designers choice between rational and naturalistic decision making. The study in [4] focused on decision-making by ASD teams. It examined decisions made across the four stages of the sprint cycle: sprint planning, sprint execution, sprint review and sprint retrospective. The authors employed the technique of focus group study with 43 Agile developers and managers to determine what decisions were made at different points of the sprint cycle. In another publication by the same research group [5], interviews with an additional 18 professional Agile practitioners from one global consulting organization, one multinational communications company, two multinational software development companies, and one large museum organization were analyze to identify six key obstacles facing decision making in Agile teams. Nevertheless, the techniques used by existing studies mainly involve interviews and surveys. This limited the scale of the study as well as the level of details of the collected data. As a result, the form of findings from such studies tend to be qualitative in nature. For instance, in [4], some obstacles facing agile teams during sprint decision-making can “people are unwilling to commit to a decision”, “lack of 1 2
https://www.scrumwise.com/ http://www.linjun.net.cn/hase/
ownership” and “lack of empowerment”. There is a lack of quantitative results indicating the extent of each obstacle facing agile team members with different competence levels. Furthermore, existing studies focused on ASD teams who are already proficient in applying agile development methods. They did not provide insight into the decision-making tendencies exhibited by novice ASD teams who are more in need of automated decision support.
3.
THE HASE PLATFORM
HASE is an online APM tool. It provides five main features to support agile project management which cover the sprint planning, sprint, and sprint retrospective phases shown in Figure 1: 1. Registration: In order to build user profiles, HASE requires registrants to specify their self-assessed competence levels in different areas of expertise such as familiarity with specific programming languages, system design methodologies, and user interface (UI) design tools, etc. 2. Team and Role Management: HASE supports the creation of teams, the selection of product owners and stakeholders into the teams, and the assignment of different roles within a team (e.g., programmers and UI designers). 3. Task Management: Task information including task description, skills required for the task, under which deliverable each task belongs to, and the person who proposed each task is displayed for all team members to view. The difficulty value (Dif fτ ) of each task τ , is recorded using an 11-point Likert scale [6] (with 0 denoting “extremely easy” and 10 denoting “extremely hard”). Team members can determine the difficulty value of each task together and input the value into the HASE platform. 4. Sprint Planning: HASE records the teams’ decisions on which tasks are assigned to which team member. Once assigned, the status of the task becomes “Assigned”. The assignee i inputs his/her confidence value (Confτi ) for each task τ on an 11-point Likert scale (with 0 denoting “not confident at all” and 10 denoting “extremely confident”). The assignees also record the estimated required time (Tτest ) to complete each task (in number of days). 5. Sprint Retrospective: Once a task is completed, the assignee changes its status in the HASE platform to “Completed”. This action will trigger HASE to record the actual number of days (Tτact ) used to complete this task. HASE also provides functions for team members to peer review the quality (Qualτ ) of each completed task τ . The quality of a completed task is recorded in the platform as either 0 (“unsatisfactory”) or 1 (“satisfactory”). The input data to the HASE platform required from ASD teams are generated as a result of their activities following the Scrum methodology. In this way, users of HASE can behave as if they are using any APM tool without expending additional effort. Thus, the data collection process remains unobtrusive to the ASD team members. Over time, the
user profile information, task information, task allocation decisions, and the timeliness and quality of completed tasks can reveal insight into ASD teams’ behavior patterns that is useful for building automated task allocation decision support systems.
4.
It is computed using the BRSEXT method [10] as follows: Compi =
αi + 1 (αi + 1) + (βi + 1)
(1)
where αi and βi are calculated as: X
αi =
RESEARCH DESIGN
1[T act −T est ≤0 and τ τ
(2)
Qualτ =1]
τ ∈φ(i)
In order to demonstrate the potential for APM tools in providing new insight into the behavior patterns of ASD teams, we conducted a study involving 119 undergraduate software engineering students in the Beihang University (BUAA), China in 2013 using the HASE platform. As part of their curriculum, they were required to complete a software engineering project using the Scrum agile development methodology over a period of 8 weeks. The students were introduced to the concept of agile software engineering during lecture sessions of the same course. They had no hands-on experience with the Scrum methodology before the coursework project. The students were asked to form into teams of five to seven persons each by their own choice. Each team was required to produce a working software system at the end of the project. The project proposals were reviewed and approved by the course instructor to ensure that they were of similar scale and complexity across all teams. The project was divided into 8 sprints. Each sprint lasted 7 days. During a sprint, each team analyzed their own proposed project to identify tasks that need to be completed in order to produce the required software. Tasks were divided among the team members at the beginning of each sprint based on discussions within each team. Each participant may be assigned 0, 1, or multiple tasks during each sprint. A total of 732 tasks were proposed by all the teams during this study. The percentage of all tasks being rated as each of the 11 difficulty values are shown in Figure 2. Tasks with difficulty values from 5 to 8 forms the majority of all tasks (i.e. 57.87%). Apart from these contextual data, we use the task quality evaluation data and the task completion time data obtained from the sprint retrospective phase to compute an estimator for each team member’s competence. This estimator is referred to as a team member’s competence score (Compi ).
βi =
X
1[Tτact −Tτest >0 or
(3)
Qualτ =0]
τ ∈φ(i)
1[condition] equals to 1 if “condition” is true. Otherwise, 1[condition] equals to 0. In essence, αi represents the total number of tasks that have been completed on time with satisfactory quality by a team member i, whereas βi represents the total number of tasks that have not been completed on time or with unsatisfactory quality by the team member i. In this way, Compi can be interpreted as the probability of i completing a given task on time with satisfactory quality. Compi ∈ (0, 1) where 0 indicates that i is completely incompetent, and 1 indicates that i is completely competent. During initialization when i has no past record (i.e. αi = βi = 0), Compi equals to 0.5 indicating that i’s competence is uncertain.
5.
RESULTS AND DISCUSSIONS
With the dataset on participants’ task allocation decisions collected, we adopt the Exploratory Data Analysis (EDA) approach [9] to understand whether new insight into novice agile teams’ task allocation behavior can be derived. EDA is an approach to summarize the main characteristics of a dataset. Specifically, we investigate three aspects of task allocation decision-making which traditional interview/survey based studies have difficulty investigating. They are: 1) how team members’ competence influences their workload; 2) how team members’ competence influences their confidence on tasks with various difficulty values; and 3) how team members’ competence influences the timeliness of completing tasks with different difficulty values. In this section, we discuss the analysis results. 25 Teams adopting CA Teams adopting EA
20 18
20
16 % of Population
% of All Tasks
14 12 10
15
10
8 6
5
4 2 0
0 0
1
2
3
4
5 6 Task Difficulty
7
8
9
10
Figure 2: The distribution of task difficulty values.
0
0.1
0.2
0.3
0.4 0.5 0.6 Competence Score
0.7
0.8
0.9
1
Figure 3: The distribution of team members’ competence scores.
35 Average No. of Tasks per Person
Total Number of Tasks Assigned to Each Team Member
40
30 25 20 15 10
2
1.5
1
0.5
0 1 8
0.8
5
6
0.6 0
4 0.4
0
0.1
0.2
0.3 0.4 0.5 0.6 0.7 Team Member Competence Scores
0.8
0.9
1
2
Competence
(a) Total workload distribution under CA
Week
(b) Workload distribution under CA by week
35 Average No. of Tasks per Person
Total Number of Tasks Assigned to Each Team Member
40
30 25 20 15 10
2
1.5
1
0.5
0 1 8
0.8
5
6 0.6
0
0
0.1
0.2
0.3 0.4 0.5 0.6 0.7 Team Member Competence Scores
0.8
0.9
1
(c) Total workload distribution under EA
Competence
4 0.4
2 Week
(d) Workload distribution under EA
Figure 4: Results reflecting relationships between ASD team members’ competence scores and their workload.
5.1
Competence and Workload
At the end of the study, participants were asked to state the approaches adopted by their teams when determining how to distribute tasks among team members. The teams can be divided into those who adopted a Competence-based Approach (CA), and those who adopted an Equality-based Approach (EA). Teams who reported that they allocated tasks evenly among team members are classified under the EA group, while those who reported that they attempted to allocate more tasks to more capable team members are classified under the CA group. Since the team members’ competence scores were computed after the study was finished, participants in the CA group did not have access to this information and relied on their own experience to determine each others’ competence. The CA group consists of 58 people while the EA group consists of 61 people. The percentage distributions of participants with different competence scores for the CA and the EA groups are illustrated in Figure 3. It can be observed that the two groups consist of members with similar competence score distributions. The CA and EA approaches allow the teams to make relatively simple trade-offs between team members’ competence and the fairness of task distribution. This helped the teams to
simplify their discussions about task allocation during sprint planning meetings. Figure 4(a) and Figure 4(c) illustrate the total workload over the 8 weeks for team members in the CA and EA group respectively against their competence scores. The total workload is measured by the number of tasks allocated to each individual. The Pearson Correlation Coefficient (PCC) between team members’ total workload values and competence scores under CA is 0.343 indicating that more competent members tend to be assigned more task; while that under EA is only 0.077 indicating almost no correlation between team members’ competence and their workload. The average number of tasks per individual with different competence scores during each week of the coursework under CA and EA are plotted in Figure 4(b) and Figure 4(d) respectively. It can be observed from Figure 4(b) that initially in Week 1 and Week 2, there were two prominent peaks coinciding with participants with competence scores around 0.8 and 0.5. At this time when the team members were not yet familiar with each other, they relied on team members’ self-reported competence to direct task allocation decisions. As the team members became more familiar with each other over the weeks, especially with the help of sprint retrospective meetings during which team members’ perfor-
mance were assessed, more workload was being assigned to team members with higher competence. As participants did not use any systematic method to keep track of their competence scores, the workload distributions are not monotonically increasing with competence scores. From Figure 4(d), it can be seen that for EA teams, the task distributions remain relatively unchanged over the eight week period of the study. The average number of tasks per person under EA is 0.998 with a standard deviation value of 0.051.
5.2
Competence, Difficulty and Timeliness
Figure 5(a) shows the relationship between participants’ competence scores, the normalized difficulty values of the tasks assigned to them, and their estimated time required to complete the given tasks (in number of days). In this figi . In the dataset, ure, the x-axis represents the value of Comp Dif fτ no task was rated by participants as having a difficulty value i i ∈ (0, 10). If Comp > 1, it means that of 0. Thus, Comp Dif fτ Dif fτ an ASD team member i is assigned a task τ with a normalized difficulty value lower than i’s competence score. In this case, i is more likely to be able to complete this task on time
7
Estimated Time Required (Days)
6
5
4
i ≤ 1, i is assigned a task with satisfactory quality. If Comp Dif fτ τ with a normalized difficulty value higher than or equal to i’s competence score. In this case, i is less likely to be able to complete this task on time with satisfactory quality. i From Figure 5(a), it can be observed that when Comp > 1, Dif fτ the PCC value between the estimated required time and Compi is −0.477, which indicates a significant negative corDif fτ relation. The average estimated required time is 3.91 days. i , the shorter the estimated The higher the value of Comp Dif fτ i required time. However, when Comp ≤ 1, the PCC value Dif fτ i is reduced between the estimated required time and Comp Dif fτ significant to −0.146. The average estimated required time also increases significantly to 5.64 days. i To investigate the effect of the Comp value on the timeDif fτ liness of completing tasks (i.e. whether tasks are completed before the estimated required time), we use another metric - the early completion days. It is the difference between the estimated number of days required and the actual number of days used to complete a given task (i.e. Tτest − Tτact ). If Tτest − Tτact = 0, the task τ is completed “on time”; if Tτest − Tτact > 0, τ is said to be completed “ahead of time”; otherwise, τ is said to be “overdue”. From Figure 5(b), in i > 1, more than 50% of the tasks were cases where Comp Dif fτ i completed on time, whereas when Comp ≤ 1, less than 30% Dif fτ of the tasks were completed on time. The average early comi pletion days for cases where Comp > 1 is 0.47 days whereas Dif fτ Compi in the cases where Dif fτ ≤ 1, it is -0.09 days.
5.3
3
2
1
0 0
10 Team Member Competence Scores / Normalized Task Difficulty
1
10
(a) Estimated time required v.s. competence scores and normalized task difficulty values
Competence, Difficulty and Confidence
Figure 6 shows the participants’ self-reported confidence for the tasks assigned to them. They reported the highest level of confidence (i.e., 10) for over 50% of all tasks during the study. Intuitively, the more competent a participant is, and the less difficult the task assigned to him/her, the more confident he/she should be about the assigned task. To test this intuition, we normalized the self-reported confidence by all participants into the range of [0,1] and plotted them against their competence scores for tasks with different difficulty values in Figure 7. The tasks are divided into three groups based on their difficulty values as assessed by
100 90
Competence Score/Task Difficulty 1.0 100 90
70 80 60 70 50 % of All Tasks
% of All Tasks in Each Sub−group
80
40 30
60 50 40
20 30 10 20 0 −6
−4 −2 0 2 4 (Estimated Required Time − Actual Time Taken) (Days)
6
(b) Timeliness v.s. competence scores and normalized task difficulty values Figure 5: Results reflecting novice Agile team members’ behavior in estimating required time.
10 0
0
0.1
0.2
0.3 0.4 0.5 0.6 0.7 0.8 Normalized Self−Reported Confidence
0.9
1
Figure 6: The distribution of team members’ selfreported confidence values for all tasks.
1 0.9
0.8
0.8
0.8
0.7 0.6 0.5 0.4 0.3 0.2 0.1 0
Normalized Self−reported Confidence
1 0.9 Normalized Self−reported Confidence
Normalized Self−reported Confidence
1 0.9
0.7 0.6 0.5 0.4 0.3 0.2 0.1
0
0.1
0.2
0.3 0.4 0.5 0.6 0.7 Team Member Competence Scores
0.8
0.9
(a) For Tasks with Easy Difficulty
1
0
0.7 0.6 0.5 0.4 0.3 0.2 0.1
0
0.1
0.2
0.3 0.4 0.5 0.6 0.7 Team Member Competence Scores
0.8
0.9
1
(b) For Tasks with Medium Difficulty
0
0
0.1
0.2
0.3 0.4 0.5 0.6 0.7 Team Member Competence Scores
0.8
0.9
1
(c) For Tasks with Hard Difficulty
Figure 7: Results reflecting novice Agile team members’ behavior in estimating risk. the teams: 1) easy tasks (0 ≤ Dif fτ ≤ 3); 2) medium tasks (4 ≤ Dif fτ ≤ 7); and 3) hard tasks (8 ≤ Dif fτ ≤ 10). The relationship between team members’ competence scores and their normalized confidence for easy, medium, and hard tasks are illustrated in Figures 7(a), 7(b), and 7(c) respectively. For easy tasks, the PPC value between normalized confidence and team members’ competence scores is 0.667, which indicates a strong positive correlation (i.e. the more competent a team member is, the more confident he/she is about an easy task assigned to him/her). This correlation becomes only weakly positive (i.e. PPC = 0.159) with regard to medium tasks. When assigned hard tasks, the correlation becomes weakly negative (i.e. PPC = −0.179). In this case, team members with high competence scores became more reserved and reported lower confidence values. In contrast, team members with low competence scores tend to be over confident when assigned tasks with medium or hard difficulty values.
6.
CONCLUSIONS AND FUTURE WORK
As APM tools are increasingly adopted by ASD teams, they offer researchers a new source of unobtrusively collected behavior data that provide insight into the characteristics and effects of decision-making which cannot be extracted from traditional survey and interview based study methods. Through a study involving 119 student participants over 8 weeks with the proposed HASE APM tool, we demonstrate the scientific research potential of APM tools. This manner of data collection occurs during normal usage of the APM tool and does not introduce additional overhead to the ASD teams. In addition, as team members are not put into a formal situation in which they know they are being studied, the behavior patterns captured by such data is more likely to reflect their real behavior. Through this study, we discovered effects of novice ASD team members’ competence and the difficulty of the tasks assigned to them on their workload variation, their confidence, and the timeliness of completion of these tasks. The findings based on unobtrusively collected behavior data from APM tools are quantitative in nature and can help future research construct computational task allocation decision models useful for building automated ASD task allocation decision support systems. In future, we plan to enhance the HASE Platform to enable more detailed and larger scale studies about other important aspects of the ASD process to be effectively carried out. With more in-depth understanding of the characteristics and dynamics of task allocation decision-making in ASE, we aim to design situation-aware decision support system-
s to help ASD teams make more efficiently task allocation decisions with global consideration.
7.
ACKNOWLEDGMENTS
This research is supported in part by Interactive and Digital Media Programme Office, National Research Foundation hosted at Media Development Authority of Singapore (Grant No.: MDA/IDM/2012/8/8-2 VOL 01).
8.
REFERENCES
[1] 8th annual state of agile survey. Technical report, VersionOne, Inc., 2013. [2] A. W. Brown, S. Ambler, and W. Royce. Agility at scale: Economic governance, measured improvement, and disciplined delivery. In Proceedings of the 35th International Conference on Software Engineering (ICSE’13), pages 873–881, 2013. [3] T. Chow and D. B. Cao. A survey study of critical success factors in agile software projects. Journal of System and Software, 81:961–971, 2008. [4] M. Drury, K. Conboy, and K. Power. Decision making in agile development: A focus group study of decisions and obstacles. In Proceedings of the Agile Conference (AGILE’11), 2011. [5] M. Drury, K. Conboy, and K. Power. Obstacles to decision making in agile software development teams. Journal of Systems Software, 85(6):1239–1254, 2012. [6] R. Likert. A technique for the measurement of attitudes. Archives of Psychology, 22(140), 1932. [7] J. Lin. Context-aware task allocation for distributed agile team. In Proceedings of the 28th IEEE/ACM International Conference on Automated Software Engineering (ASE’13), pages 758–761, 2013. [8] A. Szoke. Decision support for iteration scheduling in agile environments. In Proceedings of the 10th International Conference on Product Focused Software Process Improvement (PROFES’09), pages 156–170, 2009. [9] J. W. Tukey. Exploratory Data Analysis. Addison-Wesley, 1977. [10] H. Yu, Z. Shen, C. Leung, C. Miao, and V. R. Lesser. A survey of multi-agent trust management systems. IEEE Access, 1(1):35–50, 2013. [11] C. Zanniera, M. Chiassonb, and F. Maurer. A model of design decision making based on empirical results of interviews with software designers. Information and Software Technology, 49(6):637–653, 2007.