Sub-optimization of Bank Queuing System by Qualitative and Quantitative Analysis Azmat Ullah
Xiao-dong Zhang
Department of management science and engineering Dongling School of economics and management University of science and technology Beijing 100083 Beijing, PR China
[email protected]
Department of Management Science and Engineering Dongling School of economics and management University of science and technology Beijing 100083 Beijing, PR China
[email protected]
Khalid Iqbal
Muhammad Ayat
School of computer and communication engineering Department of computer science and technology University of science and technology Beijing 100083 Beijing, PR China
Department of Industrial Engineering Sabanci University Istanbul Orhanli, 34956, Istanbul Turkey
[email protected]
[email protected]
Abstract—This paper is a study of staff issues at the bank, ICBC China. Due to extra and imbalanced staff, the system was idle most of the time. By using the qualitative approach, M/M/s queuing model and discrete event simulation, the staff was suboptimized. First, observation of the system was conducted and recorded using the existing operations system used by the bank. Arrival time of customers, service time, and the waiting time customers are willing to wait are all included in the data collection. Second, we analyzed the inter arrival time and service time by using the quantitative method and forecast the improvement in the system. We find out that the utilization of the system was very ineffective. Next, we suggested qualitative approach in the designing of queuing system of the bank. Finally, building and validation of a computer simulation model of a bank queuing system was conducted by using POM-QM software. ‘A quantitative analysis and simulation was conducted and sub-optimized the system. The resulting design has a fewer number of service representatives, higher utilization and a waiting time within the limit of the customer’s expected time. Keywords—queuing theory; simulation; customer perception; ssub-optimization.
I. INTRODUCTION Many service systems including banks are trying to provide quick service to customers. To provide quick service in a bank system, many counters are provided to customers. Most of the time having many counters significantly increases the cost of the system. To optimize the system and decrease the extra cost of counters, queuing theory and simulation has been used in quantitative analysis of the bank.
Queuing model is very applicable in making decisions about the level of staff, building layout, resource allocation, and new policies implementation. Also by using simulation, it permits you to experiment your designs without requiring acquisition of resources. The use of queuing analysis and simulation has been widely discussed in literature by [1-7, 9, 11]. By quantitative method the system is facing the issue of opportunity cost. For waiting time minimization, extra resources are required in the system which causes an addition of cost to the system. By studying literature such as [13,16,1820], we found that customer’s satisfaction is not only based on minimum waiting time but also involved perception of waiting time in the system. I used the term “opportunity cost” because in the system, there is no need for zero waiting time in the system. Hence the system has the opportunity to save this cost by involving customer’s perception in the designing phase of the system that what actually customer’s need in the system. Customer perception means the experience of customers in a system which results in the customer’s satisfaction. To save the opportunity cost also, this study used a qualitative approach with quantitative analysis of the queuing system. Nevertheless, there seems to be a lack of research to design a model where the customer’s perception is considered as a constraint about how much time the customers are willing to wait in the system. In previous research, system optimization and improving efficiency has been studied but no one tried to design a system by considering clearly both the requirements of customers as the system. In this study, we have designed the queuing system in the bank of ICBC China. We have considered both qualitative and
quantitative approaches. By using the qualitative approach, we supposed that some basic waiting time must be spent by a customer in the system. We suggested the 8 principles of Maister [13], as in Table. 1, must be followed with waiting time. To involve the customer’s perceptions about waiting time in the system we found that customers can wait in the system for some time and there is no need for zero waiting time. On the basis of that time (customer willing time) we sub-optimized the system by using quantitative approach (queuing theory) and simulation. The resulting system has a fewer number of service representatives, higher utilization, low idle time and a waiting time that is less than or equal to the amount of time customers are mentally prepared and willing to spend II. LITERATURE REVIEW Averill stated that the collection of facility or process is called a system [1]. We have to make assumptions if we want to scientifically study how a system works. These assumptions are in the form of a logical or mathematical relationship. We setup a model that gives information on how the system behaves. If the model is simple and sufficient then we use the mathematical method (calculus, algebra, or probability theory) to acquire precise information on questions of concern. This is called an analytical solution. However, in the real world most systems are too complex and do not allow for a realistic model of analytical evaluations. Simulation is used to study these types of models. Computers are used to evaluate a model numerically. In order to evaluate the preferred true characteristics of the model, data are gathered. Vasumathi et al [2], stated that to overcome traffic congestion, the queuing model is used. This model is mostly used in circumstances where customers are involved, hence when the simulation is being combined with the queuing model it comes to be very productive in relation to solving problems involving customers. So with the bank waiting line problem, these two models are used for analyzing the system and finding alternative solutions. A waiting line in any organization is a main reason for customer’s loss. Igor et al [4], states that supporting the decision such as level staffing, resource allocation, building layout, and new policies implementation, queuing model is very essential. Huimin et al [3] showed that bank efficiency can be improved by three ways. First by making optimization model of queuing system. Second by improving business environment and third to find optimal counters to improve the efficiency of operations. It should also show that in the system of first come first serve, one waiting line is better than several lines. Bhavin et al [5], used M/M/1 queuing model and Little theorem for the case study of ATM machines and analyzed that service time provided is not sufficient and they also suggested how to make the optimum system. They also confirmed the analytical result of their model by simulation. Mathias et al [6], used queuing theory for studying the queuing system in Sushi Tai restaurant in Sanayan City, Jakarta. The aim of the paper is to indicate that when queuing theory is tested in real-case situations, it satisfies the model. They got the data and derived the waiting in queue, arrival rate,
utilization, service rate, and the probability of customers to wait in the system by using M/M/1 queuing model and Little’s theorem. Dhar et al [7], used the queuing model for customers in a bank with Exponential service times and Poisson arrival time. The system was a multiple-channel queue. After computation of different characteristics, they proved that in creating stability between the opportunity costs for optimization of service cost and waiting costs, queuing models are very helpful. Nicholas et al [8], proclaims that recently the system which provides quick service to customers and tending zero waiting time is attending great concentration of management. First, in highly developed countries, where the Customer’s time is more valuable and standard of life is very high, as a result customers are not willing to wait more for getting service. Secondly, to make the customers loyal, the organization treats their customers in good way. Firms are able to offer customers quicker service due to development in technology, such as the internet and computers. There are many advantages of simulation such as Bank, discussed it as to diagnose problems, identify constraints, develop understanding of real systems rather than indicating individual prediction about the system, visualize the plan, prepare for change the existing system and specify requirements [9]. By using the bank example, he introduced modeling concepts in simulation. Averill suggested a procedure of an effective computer simulation study [1]. Following steps are included in this procedure: • Formulation of problem. • Collection of data and the design of model. • Model validation. • The creations representation.
of
the
model
with
computer
• Model verification. • Experiment of the model to expose the problem. • Running of computer model. • After getting the data from production run, do Statistical analysis. • The analysis of the results. Many researchers have done work on qualitatively analysis of waiting line and queuing psychology. Ger et al [12], did survey on some academic research on telephone call center. The survey research has its origin in, or related to queuing theory. They measure service quality along two dimensions: 1) Qualitative (Psychological such as am I satisfied with the answer, is the agent friendly) 2) Quantitative (Operation, such as relate more to service accessibility. i.e. how long did I have to wait for service) Model in support of qualitative aspects of service quality are typically empirical, originality in social service or marketing.
Model in support of quantitative management are typically analytical that originate in operation research (OR) and queuing theory. In fact it is strongly recommend by our experience that, having analytical model is one’s resource, even the scope is limited, develop intensely one’s use of simulation. They suggest that manager can use queuing as indicator for control and improvement. Itamar et al [14], say that now a day, in consumer’s research the emotions or affect are strongly being considered. Casado et al [20], mentioned that the emotion of uncertainty and anger is gives rise because of waiting. Laurette et al [15], study in his experiment that people get more upset when the delay happened before the ordered of the meal than when it happened in the mid time of dining experience. Ad et al [16], did a survey, by visiting a polyclinic and asked men and women about their experience waiting in the waiting area. He found that they experienced annoyance, irritation, stress and boredom while waiting. According to Robert [17], evidence confirmed that in case of satisfaction affective appraisal/emotional plays an important role. Jihong et al [18], mentions that in many instances, reneging occurred because of the customer’s perception about the service environment rather than the real reason for the delay. These issues are dealt with by using psychological solutions. For managing reneging, other approaches rather than managing capacity by using quantitative approach is more valuable. Norman, suggested solutions to the waiting line problem, but the people involved are only one group, expectations and behavior are determined for an enormous number of societal, social and cultural reasons [19]. Different types of culture behave differently and have different expectations. As a result cultural sensitivity must be considered in solutions. He also added that waiting lines have been studied in operation management on the basis of mathematical modeling but it misses the human elements. Because of the mathematical solution, we have a horrible emphasis today. In mathematical solution, efficiency and cost are only critical metrics while equity, fairness, expectation, experience and perception of customers are ignored. For the survival of a business, experience and perceptions are more essential than efficiency. III. SPECIFIC FEATURES OF THE BANK OF ICBC The subject of our study is the bank ICBC in the Haidian district of Beijing, providing the services of personal banking and corporate banking. The bank’s hours for personal banking are from 9 AM to 5 PM with no breaks for lunch and no weekends. Corporate banking hours are from 9 AM to 12 AM with one hour lunch break and then from 1 PM to 5 PM. The bank has a two storeys building. The ground floor is for personal banking while the second floor is for corporate banking. The ground floor layout contains 12 service counters, in which 8 counters are for cash service, two counters for exchanging money and two counters are for E-banking service. The second floor has 16 counters, in which 4 counters are for non-cash service, 8 counters are for corporate service and 4 counters are for VIP service which they named as Elite club. Our main focus of study is the ground floor personal banking section, where the E-banking section is not included in
this study. When a customer enters the bank, they take a number token from the token machine and start waiting in the waiting area. IV. EVALUATION OF CUSTOMERS FLOW IN BANK In the first phase of the study, field observation of customer’s arrival and service process of the bank was inspected. The purpose of observation was to document the current process and server utilization, to determine the distribution of waiting time. We also wanted to develop recommendation for staffing and layout modification of the system to optimize the waiting time of customers and server’s utilization. Data of customer’s arrival into the bank and service time of the counters were recorded. The average number of customer’s arrival into the system was 390 per day. The average number of customers getting service from different counters is shown in Table 1. Our main focus of this study is the cash service and exchange service counters. Average time of the customer in the system, number of servers, average time of customer in the queue, and server utilization are shown in the Table 3, Fig. 1. TABLE I.
CUSTOMERS FLOW EVALUATION
Average No of Customer getting service from Cash counters Average No of Customer getting service from Exchange counters Average No of Customer getting service from Non Cash counters TOTAL
No of customers
%
344
88.2
26
6.67
20
5.14
390
100
V. QUALITATIVE APPROACH FOR WAITING IN BANK Our observation revealed that the server’s utilization is low and has a higher idle time because the service counters are not optimum. To achieve customer’s expectations, the current system provided extra counters which were the cause of extra cost and an idle system. Which we named as opportunity cost. Here the opportunity cost means that there is no need to spend money on waiting time minimization which is not necessary for customer’s satisfaction. The opportunity cost in this study is in the form of low utilization and higher idle time of service counters as shown in Fig. 1. By using quantitative method the basic aim of the system is to minimize the waiting time as much as possible for customer’s satisfaction. By ignoring customer’s expectations we can also achieve customer’s satisfaction by making pleasant the perception of customers. The basic aim of any system is to gain customer satisfaction. According to Maister [13],
S =P-E
1)
Here, 'S' stands for satisfaction, 'P' stands for perception and 'E' stands for expectation in this formula.
Hence prove that customer’s satisfaction can be possible by involving customer’s perceptions in the designing of the system. Customer’s expectation is always zero waiting time in the system. But zero waiting time is only possible in an ideal world. In the practical world there must be a gap between customer’s perception and customer’s expectations. If there is some reasonable waiting time, customers can still be satisfied if the perception about the waiting time is better. The perception will be better about waiting time if we consider numerous principles of waiting Maister, for enhancing the pleasantness of time in the waiting line as shown in Table 2. Hence, the firm needs to make that waiting time pleasant. When customers enter into a bank, they are already mentally prepared for some basic waiting time in the system. In this study we suggested that the basic need of the customer is to get the service in the least possible time. TABLE II. No
Principle Keep people busy
2
Make sure the system is fair
3
Remove confusion
4 5 6 7
8
Waiting time need to be appropriate People need to get started Customers are willing to wait for valuable service Waiting in group feels shorter than solo. Waiting time seems longer due to anxiety
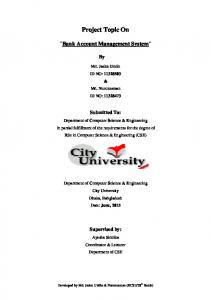
Since in our model, we have a fluctuating demand, as the number of customers arrival change over the day. But in M/M/s model the arrival rate are assumed constant over time. Hence we used the SIPP (stationary independent period by period) approach in our model to meet the changing demand by varying staff of the system. The day is divided in to staffing periods in SIPP approach then for each period an individual M/M/s model is constructed. Then each period is analyzed individually for optimal number of servers to gain the required service requirements [23]. In our study, the day was divided into 9 periods: each is a one hour period. In Table 3, the division is shown. Queuing analysis discovered that during each period of the day, the servers have higher idle time for both (Cash and Exchange) types of servers, mentioned in Fig. 1. Even the customers are willing to wait for our suggested time as in (2), but we have so many counters that there is almost zero waiting time in queue as shown in Fig. 2. We have the flexibility of increasing the waiting time as mentioned in the Table 3 and Fig. 3. To model the line, for each period queuing simulation was done. For simulation, we used POM-QM software. POMQM software is the most user friendly windows software. It is widely used in quality management, decision making and operation management problems. It was found that the system utilization was very low and even at some periods there were zero customers in the system or waiting line and not acceptable server utilization as shown in Table 3 and Fig. 1.
MAISTER’S PRINCIPLES OF WAITING LINE
1
channel queue and proved that a single channel queue is more efficient than a multi-channel queue. Customer’s arrival according to poison distribution with a constant rate and the service duration has an exponential distribution.
Explanation Occupied time passes more quickly than unoccupied time Waiting time feel longer in unfair system than in equitable system Make available a conceptual model, an explanations and feedback. Finite wait or known wait are shorter than uncertain wait. In-process waits feel shorter than pre-process. Waiting is intolerable for service of little value. To make the wait tolerable, the feeling of group waiting environment is better than individual. People always think that they have selected the wrong waiting line and wait get intolerable due to anxiety
TABLE III. Current M odel
9:00- 10:00 10:00 - 11:00 11:00 - 12:00 12:00 - 13:00
Customers can wait in the system, less than or equal to 15 minutes (min) for cash service and less than or equal to 20 minutes (min) for exchange service as given by (2).
13:00 - 14:00 14:00 - 15:00 15:00 - 16:00 16:00 - 17:00
Cash Win
The target of this study was to improve the system utilization with the constraint of target customer waiting time. But the target waiting time must be in the environment designed according to the 8 principles as mentioned earlier in Table 2. VI. QUEUING STUDY AND COMPUTER SIMULATION MODEL OF CUSTOMERS FLOW IN BANK
M/M/s queuing model was used in this study. The M/M/s model undertakes a single queue that feeds into “S” identical servers. Laifu et al [10] and Song et al [11], used computer simulation techniques for multi-channel queue and single
OUTPUTS:
Arrival Rate M ean Number of Utilization (customers/ Service Servers of servers hour) Time (min) 8
67
4.67
Idle time of servers
Average Time in Sy stem
Average Time in Queue
Average Number in Queue
36%
4.92
0.31
0.35
64%
Average Number in System 5.5
Exchange win
2
5
10
42%
58%
12.1
2.1
0.18
1.01
Cash Win
8
61
4.67
59%
41%
4.79
0.18
0.18
4.87
58%
2.1
0.18
Exchange win
2
5
10
42%
Cash Win
8
39
4.67
12.1
1.01
38%
62%
4.63
0.01
0.01
Exchange win
2
3
10
25%
75%
10.67
0.67
0.03
0.53
Cash Win
8
31
4.67
30%
70%
4.62
0
0
2.39
0.01
0.34
Exchange win
2
2
10
Cash Win
8
35
4.67
3.01
17%
83%
10.29
0.29
34%
66%
4.62
0.01
0
2.7
Exchange win
2
3
10
25%
75%
10.67
0.67
0.03
0.53
Cash Win
8
40
4.67
38%
62%
4.63
0.01
0.01
3.09
Exchange win
2
3
10
25%
75%
10.67
0.67
0.03
0.53
Cash Win
8
37
4.67
36%
64%
4.62
0.01
0.01
Exchange win
2
3
10
25%
75%
10.67
0.67
0.03
0.53
Cash Win
8
33
4.67
32%
68%
4.62
0
0
2.54
Exchange win
2
2
10
17%
83%
10.29
0.29
0.01
0.34
Cash windows
(2)
Utilization
⎧12 min for cash service Target Cutsomer WaitingTime in System ≤ ⎨ ⎩20 min for Exchange service
QUEUING ANALYSIS OF CURRENT SYSTEM INPUTS:
64% 42%
9:0010:00
Exchange windows
59% 42% 38% 38% 36% 34% 32% 25% 30% 25% 25% 25% 17% 17%
10:00 11:00
11:00 12:00
12:00 13:00
13:00 14:00
Hour
Fig. 1. Current system utilization of servers
14:00 15:00
15:00 16:00
16:00 17:00
2.85
Cash windows
Time (min)
2.1
the system has saving of staff salary by reduction in number of staff.
Exchange windows
2.1
0.31 9:0010:00
0.18
10:00 11:00
11:00 12:00
0.67
0.29
0.67
0.67
Utilization
86% 0.67
0.29
0.01 0.01 0.01 0.01 0 0 12:00 - 13:00 - 14:00 - 15:00 - 16:00 13:00 14:00 15:00 16:00 17:00
78% 42%
9:0010:00
Hours
79%
75% 50%
42%
10:00 11:00
77%
67% 50%
79%
71% 50%
50%
33%
11:00 12:00
12:00 13:00
33%
13:00 14:00
14:00 15:00
15:00 16:00
16:00 17:00
Hours
Fig. 2. Current average waiting time in queue
Cash Windows 12.1
10.67
Exchange Windows 10.67
10.29
10.67
Exchange windows
Fig. 4. Revised system utilization of servers
10.67
10.29 Cash Windows
4.92 9:0010:00
4.79
10:00 11:00
4.63
11:00 12:00
4.62
12:00 13:00
4.62
13:00 14:00
4.63
14:00 15:00
4.62
15:00 16:00
Exchange Windows
4.62
16:00 17:00
20
Time (min)
Time (min)
12.1
Cash windows
Hours
Fig. 3. Current average waiting time in system
12.1 8.13 9:0010:00
15
20
20
20
5.98
7.33
6.4
15
12.1 6.32
10:00 11:00
11:00 12:00
9.41
6.97 12:00 13:00
13:00 14:00
14:00 15:00
15:00 16:00
9.4
16:00 17:00
Hours
VII. SUB-OBTIMIZATION OF THE SYSTEM As from our current system analysis, it was clear that the system has higher server’s idle time which can cause higher cost to the system. There are several ways of sub-optimization of the system. Which include (a) increasing the arrival of customers (b) managing the number of servers (c) optimizing the service rate. However increasing the arrival of customers is not an urgent way. The bank can gradually attract more customers by marketing and providing the best services to customers. The optimization of all variables as discussed above is the most effective way to improvement. By considering both customer’s expectations and optimum system, the number of servers should be sub-optimum as mentioned in Table. 4. The impact of this change on server utilization and waiting time of the customer in the system has been shown in Table 4, Fig. 4 and Fig. 5. TABLE IV.
QUEUING ANALYSIS OF PROPOSED MODEL INPUTS
Prop osed M odel
9:00- 10:00 10:00 - 11:00 11:00 - 12:00 12:00 - 13:00 13:00 - 14:00 14:00 - 15:00 15:00 - 16:00 16:00 - 17:00
Cash Win
6
Exchange win
67
VIII. CONCLUSION From the study it was clear that there were extra service representatives, adding an extra cost to the system which was sub-optimized. The first approach is to understand the customer perceptions, which lead to satisfaction. The basic data for achieving customer satisfaction and sub-optimization of the system are the time the customer is willing to wait in the system. This study has evaluated the performance of a single queuing system and sub-optimized the system by leveling the service staff. In our final design system we were able to compute the customers expected waiting time and make sure their time spent waiting in line was less than or equal to that. IX. POSSIBLE FURTHER STUDY
OUTPUTS
Arrival Rate M ean Number of (customers/ Service Servers hour) Time (min)
Fig. 5. Revised system average waiting time
Utilization of servers
Idle time of servers
Average Time in Sy stem
Average Time in Queue
Average Number in Queue
Average Number in Sy stem
4.67
86%
14%
8.13
3.51
3.92
9.08
2
5
10
42%
58%
12.1
2.1
0.18
1.01
Cash Win
6
61
4.67
78%
22%
6.32
1.7
1.73
6.42
Exchange win
2
5
10
42%
58%
12.1
2.1
0.18
1.01 4.53
Cash Win
4
39
4.67
75%
25%
6.97
2.35
1.53
Exchange win
1
3
10
50%
50%
20
10
0.5
1
Cash Win
3
31
4.67
79%
21%
9.41
4.79
2.48
4.86
Exchange win
1
2
10
33%
67%
15
5
0.17
0.5
35
5.98
1.37
0.8
3.49
Cash Win
4
4.67
67%
33%
Exchange win
1
3
10
50%
50%
20
10
0.5
1
Cash Win
4
40
4.67
77%
33%
7.33
2.71
1.81
4.88
Exchange win
1
3
10
50%
50%
20
10
0.5
1
Cash Win
4
37
4.67
71%
29%
6.4
1.79
1.1
3.95
Exchange win
1
3
10
50%
50%
20
10
0.5
1
Cash Win
3
31
4.67
79%
21%
9.41
4.79
2.48
4.86
Exchange win
1
2
10
33%
67%
15
5
0.17
0.5
From this revised model as Table 4, and Fig. 5, it is clear that the customer’s waiting time is in the range of target waiting time of customer’s as we suggest above in (2). Also
In this study we tried for sub-optimization of the system by changing the number of service counters. We can also increase the efficiency and effectiveness of the system by decreasing the service providing time. It can be possible by modifying the business operations. As we supposed in our study the customer’s expected waiting time, for which they are willing. This idea provides the concept for further studies to make questionnaires and take feedback from different types of customers. This will help in the designing of a completely optimum system. During the designing phase, with quantitative analysis we can effectively utilized the Voice-of-Customer (VOC) management system and reflected VOC in performance target.
ACKNOWLEDGMENT
This paper is based upon research work supported by the National Natural Science Foundation of China No. 71171019 and No. 71231001. Research Fund for the Doctoral Program of Higher Education of China 20120006110034, Special Support for China Postdoctoral Science Foundation 2013T60064 and Higher Education Commission Pakistan are also acknowledged. REFERENCES [1] [2]
[3]
[4]
[5]
[6]
[7]
[8] [9]
[10]
[11]
[12] [13] [14]
[15]
[16]
[17] [18]
[19] [20]
L. Averill, “Simulation Modeling and Analysis,” 4th Edition, 2007. A. Vasumathi and P. Dhanavanthan, “Application of simulation technique in queuing model for ATM facility,” international journal of applied engineering research, Dindigual Volume 1, No. 3, 2010. X. Huimin and G. Zhang, "The queuing theory application in bank service optimization," Logistics systems and intielligent management, International conference on. Vol. 2, IEEE, 2010, pp. 1097-1100. G. Igor, Z. Georgievskaya, W. Pinney and D. McWilliams, "Using queuing analysis and computer simulation modeling to reduce waiting time in the hospital admitting department," 2011. P. Bhavin and P. Bhathawala, “Case study for bank ATM queuing model,” International Journal of Engineering Research and applications (IJERA), ISSN: 2248-9622 www.ijera.com Vol.2, pp1278-1284, Issue 5 September-October 2012. D. Mathias and E. Adi, “Case study for restaurant queuing model,” International Conference on Management and Artificial Intelligence IPEDR © (2011) IACSIT Press, Bali, Indonesia, Vol. 6, 2011. S. K. Dhar and T. Rahman, “Case study for bank ATM queuing model,” IOSR Journal of Mathematics (IOSR-JM), e-ISSN: 2278-5728, p-ISSN: 2319-765. Vol.7, pp-22-29, Issue 1, May - Jun. 2013. A. Nicholas, R. B. Chase and M. M. Davis, “Fundamentals of operations management,” Homewood Irwin, 1991. J. Bank, "Introduction to simulation," In Proceedings of the 31st conference on Winter simulation: Simulation---a bridge to the future, Vol. 1, 1999, pp. 7-13. J. Z. Laifu, N. W. W. J. Louis and T. S. Chuan, "Discrete–event simulation of queuing systems," In Sixth Youth Science Conference, 2000, pp. 1-5. H. Song and D. Zhenwei, "Simulation of banks queuing system based on WITNESS," In Computer Application and System Modeling (ICCASM), International Conference on, Vol. 15, 2010, IEEE, pp. V15402. K. Ger and A. Mandelbaum, "Queuing models of call centers: An introduction," Annals of Operations Research 113, no. 1-4, 2002. D. H. Maister, “The Psychology of waiting lines,” 1980, pp. 71-78. S. Itamar, Z. Carmon, R. Dhar, A. Drolet and S. M. Nowlis, "Consumer research: In search of identity," Annual review of psychology52, no. 1 : 249-275, 2011. D. Laurette, B. H. Schmitt and F. Leclerc, "Consumers' reactions to waiting: When delays affect the perception of service quality,” advances in consumer research 16, no. 1, 1989. P. Ad and A. Smidt, "Effects of waiting on the satisfaction with the service: beyond objective time measures," International Journal of Research in Marketing 15, no.4:321-334, 1998. W. A. Robert, "Product/consumption-based affective responses and post purchase processes," Journal of marketing research: 258-270, 1987. O. Jihong and B. M. Rao, "Benefits of providing amenities to impatient waiting customers," Computers & Operations Research 30, no. 14 : 2211-2225, 2003. D. A. Norman, "The psychology of waiting lines," Excerpt of 2008. D. A. B. Casado and F. J. M. Ruiz, "The consumer’s reaction to delays in service," International Journal of Service Industry Management 13, no. 2: 118-140, 2002.
[21] W. R. Hall, “Queuing methods: For services and manufacturing,” Vol. 1. Englewood Cliffs, NJ: Prentice Hall, 1991. [22] R. N. Adrian, J. W. Fowler and T. Wu, "Design of centralized ambulance diversion policies using simulation-optimization," In Proceedings of the Winter Simulation Conference,. Winter Simulation Conference, 2011, pp. 1251-1262. [23] L. V. Green, J. Soares, J. F. Giglio, and R. A. Green, "Using queueing theory to increase the effectiveness of emergency department provider staffing," Academic Emergency Medicine 13, no. 1, 2006.