Subjective perception versus objective indicators of overcrowding and housing affordability
Authors:
Petr Sunega Institute of Sociology, Czech Academy of Sciences Jilska 1 110 00 Prague 1
[email protected] Phone: +420 222 221 655 Martin Lux Institute of Sociology, Czech Academy of Sciences Jilska 1 110 00 Prague 1
[email protected] Phone: +420 222 221 655
Article published in Journal of Housing and the Built Environment (2016) DOI 10.1007/s10901-016-9496-3. Full version of the article available from: http://link.springer.com/article/10.1007/s10901-016-9496-3
Acknowledgment:
This article has received financial support from the ‘Centre of Excellence’ project entitled 'The Dynamics of Change in Czech Society' which is funded by the Czech Science Foundation (Grant Agency of the Czech Republic, GACR, grant no. 1436154G).
Keywords:
housing – indicators – overcrowding – housing affordability
1
Subjective perception versus objective indicators of overcrowding and housing affordability Abstract: This article seeks to evaluate indicators of overcrowding and housing affordability used by Eurostat and to propose alternatives that may better reflect the specific contexts of individual EU states while preserving the possibility of valuable international comparison. The alternatives are assessed on the basis of the distance between the results produced by objective measures and the subjective evaluations of the problem reported by households, using one and the same data source: EU-SILC. The results show that alternative threshold definitions may decrease the current discrepancy between subjective perceptions and objective indicators of housing affordability and overcrowding. They also have the potential to lead to more effective targeting of public subsidies so that they are directed towards housing programmes that not only have an objective goal but also a subjectively identified legitimacy.
2
Introduction This article seeks to make an evaluation of the indicators of housing affordability and overcrowding used by Eurostat, and to propose alternatives that might better reflect the specific contexts of individual EU Member States while ensuring their objective international comparability. Our attempt to formulate more contextual methodology for calculating housing indicators is based on a comparison of the subjective perception of selected housing issues and their objective measurement. There has long been a gap between the subjective perception of overcrowding and housing affordability in different EU Member States and their objective measurement by Eurostat indicators. One of the most commonly cited definitions of housing affordability is the following: ‘Affordability is concerned with securing some given standard of housing (or different standards) at a price or rent which does not impose, in the eyes of some third party (usually government), an unreasonable burden on household incomes.’ (Maclennan, Williams, 1990: 9). There are different methodological approaches that can be used to calculate objective indicators of housing affordability. Garnett (2000), for example, defines the indicator and the residual method. The indicator method measures the housing expenses to income ratio, which means the share of household income that goes to housing expenditures. The residual method is based on calculating residual income, which is total household income minus expenditures on housing. Abeysinghe and Gu 2011, p. 1875) distinguished between long-term and short-term affordability: ‘Households with long-term affordability problems are those who, in their lifetime, are unlikely to have sufficient income to pay for a house. Short-term affordability problems concern households who may have lifetime incomes sufficient for a house purchase, but face short-term restrictions in financing it.’ Haffner and Heylen (2011, p. 607) argue that these ‘two concepts of affordability should be used together in order to outline a more comprehensive picture of affordability.’ Despite of large literature on objective measuring of housing affordability published during the last decade, there are, however, almost no studies comparing objective and subjective
3
affordability measures (partial exception being Li 2014). Overcrowding is commonly measured as the number of rooms in relation to household size. For objective indicators, normative thresholds are used to identify households that may be at risk of housing unaffordability and overcrowding - for example, the maximum housing expenses ratio, minimal residual income, or maximum number of members per given dwelling size. This article aims to show that the thresholds that Eurostat uses do not adequately reflect cultural and institutional differences between countries: the resulting country rankings in international comparisons are inconsistent with rankings of the same countries made according to the subjective evaluations of housing affordability and overcrowding that citizens give themselves. This article therefore compares the appropriateness of current thresholds with alternative versions. The method for calculating indicators of housing affordability and overcrowding remain the same, and only the way the thresholds are determined is altered. The criterion for evaluating the appropriateness of alternatives is the difference between the objectively measured results and the subjective perception of the problem by respondent households, while using one and the same data source: EUSILC. A methodological difference to Eurostat is that households instead of individuals are used as the units of analysis (see below). OECD (2013a, p. 36) states that ‘measures of subjective well-being can bring additional information not captured by standard objective measures; can help better understand the drivers of subjective well-being; can support policy evaluation and cost-benefit analysis; and can help in identifying potential policy problems’. Significant disparities between objective and subjective indicators that cannot be explained by the money illusion or human psychology may result in the ineffective allocation of public resources and in some countries (e.g. the UK) weakening trust in official statistics (Stiglitz et al. 2009). Constructing objective indicators to take into account the subjective perception of housing problems may provide a more accurate way of measuring housing needs in a way that reflects different institutional contexts between countries and may enable the more effective targeting of public 4
resources, including ERDF allocations, for use in programmes that not only have an objective goal but also a subjectively identified legitimacy. The next section contains a brief discussion of current arguments in scientific discourse on the relationship between subjective and objective indicators. This is followed by a section describing the methods and data used in this analysis and how the alternative thresholds are formulated. The fourth section presents findings from an analysis of housing affordability and overcrowding. The conclusions discuss our main findings. Review of previous research Objective social indicators are statistics which describe ‘the environments within which people live and work’, subjective social indicators are ‘intended to describe the ways people perceive and evaluate conditions existing around them’ (Lee and Marans 1978, p. 47). Stiglitz et al. (2009, p. 16) have highlighted the relevance of both objective and subjective indicators of well-being: ‘Research has shown that it is possible to collect meaningful and reliable data on subjective as well as objective wellbeing.’ Governments in some countries (France, the UK, Germany) and international organisations (OECD, UN) are thus increasingly turning their attention to concepts that measure ‘living conditions’ or ‘quality of life’ using subjective indicators (e.g. Randall et al. 2014; OECD 2013a). There was a boom in empirical research on subjective well-being that responded to the so-called Easterlin paradox, which refers to the finding that within one country wealthier people have a better sense of well-being than poorer people, but this is not true of the difference between wealthier and poorer countries (Easterlin 1995). Although this paradox has since been challenged by a number of empirical studies (e.g. Di Tella et al. 2003; Stevenson and Wolfers 2008; Helliwell 2003; Alesina et al. 2004), it served as an important catalyser for research on the relationship between objective and subjective factors of ‘quality of life’. Hayo and Seifert (2003) studied the trend in subjective economic well-being in selected Eastern European countries between 1991 and 1995 and they argue that ‘policy makers should note, especially in times of economic turbulence, that objective and subjective evaluations of economic well-being can 5
differ considerably, and it is prudent to look at both before making a decision’ (Hayo and Seifert 2003: p. 346). Kahneman and Krueger (2006) note that a subjective evaluation of well-being is an important supplement to traditional welfare analysis: for example they argue that this combined approach itself suggests that those who seek to maximise social well-being ought to focus on policies designed to increase social contacts rather than policies directed at increasing consumption opportunities. Liao (2009) cites two theories relevant for development of indicators: the needs theory and the comparison theory. The needs theory, based on Maslow’s hierarchy of basic human needs, presumes that the greater the degree to which basic human needs are satisfied in a given society, the better the subjective evaluation of quality of life will be in that society. This theory fails to explain why the subjective evaluation of quality of life in less economically advanced societies is not necessarily lower than in economically more advanced societies (Lewis and Lyo 1986; Schuessler and Fisher 1985). By contrast, the comparison theory assumes that people evaluate their quality of life ‘relatively’, in relation to some reference group or historical experience, and the degree to which basic needs are satisfied only indirectly influences the subjective evaluation of quality of life. The current method used to measure overcrowding and housing affordability by Eurostat corresponds to the needs theory; consequently, to propose alternative thresholds for indicators measuring housing quality and affordability we take our inspiration from the comparison theory. This theory is moreover already implicitly present in social indicators used in other areas – for instance, in measures of poverty, where relative rather than universal thresholds are used. Allardt (1976) notes some of the reasons why objective indicators are favoured over subjective ones in current research. The main reason, in his view, is the generally shared belief that political decisions cannot be founded solely on the wishes and opinions of the population. Another reason is that subjective indicators are relatively unsteady over time. However, the instability of subjective perception of housing problems has not been subjected to any empirical long-term testing. Večerník (2012) also indicates that objective and subjective indicators are incompatible with respect to
6
population coverage. Subjective indicators are drawn from studies that are limited in terms of their frequency and sample size. This limitation is also apparent in housing: while objective indicators are surveyed in population censuses or large-scale representative studies, often narrower, quota-based studies of a smaller sample of the population are used to survey subjective evaluations of housing satisfaction. The exception now, however, is the EU-SILC survey, in which subjective opinions on current housing are examined together with objective indicators on a large and representative sample of households. The existence of this unique survey offers an opportunity to at least partly compensate for the aforementioned methodological limitations. In housing research subjective indicators are occasionally used to supplement objective indicators (Dewilde and De Decker 2014) or as predictors influencing real estate prices (Chasco and Le Gallo 2012). Given that research in other areas of well-being have clearly demonstrated the utility of subjective indicators in international comparisons and policy formation, it is remarkable that housing research has only devoted a marginal amount of attention to formulating an alternative measures of housing affordability and overcrowding that would better correspond to subjective perceptions of the problems. Data and methods This analysis employs data from the EU-SILC surveys. The objective of this survey is to obtain representative data on income distribution, quality and affordability of housing, the durable goods the household is equipped with, and on the employment, material, and health conditions of adult persons living in the household. The EU-SILC is a representative sample survey (households and individuals
7
were slected using a several-stage random sampling method). In our analysis, we employ crosssectional data from the EU-SILC for 2005, 2007, 2009 and 2011.1 The housing cost overburden rate is defined by Eurostat as ‘the percentage of the population living in households where the total housing costs (net of housing allowances) represent more than 40% of disposable income (net of housing allowances)’2 (Eurostat, 2014a). For homeowners, total housing costs include: mortgage interest payments (net of any tax relief), structural insurance, mandatory services and charges (sewage removal, refuse removal, etc.), regular maintenance and repairs, taxes, and the cost of utilities (water, electricity, gas and heating), net of housing allowance.3 For tenants, they include: rent payments, structural insurance (if paid by the tenants), services and charges (sewage removal, refuse removal, etc., if paid by tenants), taxes on dwelling (if applicable), regular maintenance and repairs and the cost of utilities (water, electricity, gas and heating), net of housing allowance. Disposable income is defined as after tax disposable household income. Unlike the official Eurostat definition we chose the household as the unit of analysis rather than individual persons. The reason for this is that members of a household share the housing expense burden and decide jointly about their level of housing consumption. Moreover, the well-being of individual household members is significantly affected by shared household characteristics (e. g.
1
We used the following datasets: EUSILC UDB 2005 – version 5 of August 2009, EUSILC UDB 2007 – version 5 of
March 2011, EUSILC UDB 2009 – version 6 of March 2014 and EUSILC UDB 2011 – version 4 of August 2014. The EU-SILC datasets were made available on the basis of contract no. EU-SILC/2007/16 between the European Commission, Eurostat, and the Institute of Sociology, Czech Academy of Sciences. 2
‘Net of housing allowance’ means that the amount of housing allowance is deducted from both housing cost
and disposable household income. 3
According to the description of EU-SILC variables the housing benefits are included in total housing cost of
homeowners only since 2010. For the preceding years reported in following analysis were therefore housing benefits added to the total housing cost of homeowners, who received housing benefits.
8
marital status, number of household members, presence of dependent children in the households etc.). The subjective perception of housing affordability and overcrowding are also reported for households, and not for individuals. Eurostat defines the threshold for the housing expense overburden globally for all countries at 40% housing expense ratio. Despite of the fact that the differences in housing expense ratio reflect also income inequalities traditionally measured and compared using relative thresholds, Eurostat applies a flat threshold of 40% of housing expense ratio for assessment of housing affordability. There is also the question of whether a global threshold is not too rigid considering that the average housing expense ratio varies significantly between countries. While the average housing expense ratio in 2011 was just 12% in Malta, in Denmark it was 36%. Logically, the share of households with a housing expense ratio above the 40% threshold will be greater in Denmark than in Malta. In reference to the comparison theory mentioned in the Introduction (which has already been reflected in indicators of income inequality and poverty), we set the alternative threshold at 167% of the median4 housing expense ratio in a given country. This threshold level was inspired by the method used in the EU to define the threshold of income poverty. According to the Eurostat definition, a person is defined as poor if their income is less than 60% of the median equivalised (converted to a consumption unit) income in the given country. While in the case of the poverty the aim is to identify individuals or households that fall below a certain income threshold, in the case of the housing affordability the objective is by contrast to identify individuals or households whose housing expense ratio is greater than this threshold. Unlike the poverty threshold it was not set below the median but
4
The median rather than the average housing cost ratio was chosen because medians are generally less sensitive
to the existence of extreme values. While the median housing cost ratio remained basically unchanged by the methodological adjustment taking households with a negative ratio or a ratio above 100% into account (see the section devoted to methodology and data), the averages for the housing cost ratio differed significantly before and after the adjustment.
9
as a certain multiple of the median housing expense ratio. If the poverty threshold is 60% of the median equivalised income, the threshold for the housing expense ratio is set at the level of inverse value of 60%, i.e. at 167% of the median housing expense ratio in the given country. On top of this we tested an alternative setting for a global flat threshold at 35%. Formally, the housing expense ratio was computed as follows: HCR = (12 * HC – HA) / (Y – HA), where HCR
- is the housing expense ratio; i.e. the share of total housing expenses out of household
disposable income in %; HC
- is total monthly housing expenses;
Y
- is total disposable household income in the income reference year;
HA
- is housing allowances received by the household in the same period.
From a methodological perspective it was necessary to provide for situations where the housing expense ratio was negative or greater than 100%. In conformity with Özdemir and Ward (2009) the housing expense ratio was adjusted as follows: HCR = 100 if (12*HC – HA) ≥ Y-HA HCR = missing if Y-HA ≤ 0 & (12*HC - HA) > 0 HCR = 0 if (12*HC – HA) ≤ 0 HCR = missing if HC=missing or Y=missing or HA=missing The overcrowding rate is defined by Eurostat as the percentage of the population living in an overcrowded household. A person is considered as living in an overcrowded household if the
10
household does not have at its disposal a minimum number of rooms5 equal to: one room for the household; one room per couple in the household; one room for each single person aged 18 or more; one room per pair of single people of the same gender between 12 and 17 years of age; one room for each single person between 12 and 17 years of age and not included in the previous category; one room per pair of children under 12 years of age. As we decided to use a household as a unit of analysis instead of an individual, the overcrowding rate was re-defined as the percentage of households living in an overcrowded dwelling. As with the housing expense ratio, for the overcrowding threshold we formulated two alternative definitions to the one used by Eurostat. The first (hereinafter the ‘simple definition’) is a universal one, like the current Eurostat definition, but is much simpler: it deems that a household should have as many rooms as there are members of the household. The second definition (hereinafter the ‘national definition’) sets the overcrowding threshold relative to the average level of housing usage intensity in individual countries: if the number of persons per room in a given household is greater than 1.5 times the average of this indicator in the given country, the household lives in an overcrowded dwelling.
5
A room is defined as a space in a housing unit that is at least 4 square metres in size, and includes normal
bedrooms, dining rooms, living rooms and habitable cellars and attics with a ceiling height of over 2 metres and accessible from inside the unit. Kitchens are not counted unless the cooking facilities are in a room used for other purposes; only exclude it if the space is used only for cooking. Thus, for example, a kitchen-cum-dining room is included as one room in the count of rooms. The following space does not count as rooms: bathrooms, toilets, corridors, utility rooms and lobbies. Verandas, lounges and conservatories count only if they are used year-round. A room used solely for business use is excluded, but is included if shared between private and business use. If the dwelling is shared by more than one household all rooms are counted as belonging to the owner/tenant except those exclusively used by the other households.
11
Both the current and the alternative definitions of thresholds are normative. None of them can be simply considered inappropriate. It would be possible to create dozens of other alternative thresholds. Therefore, the question is: how can we determine which definition is superior to other(s) for the purpose of international comparison? One possible answer is to let people determine the definition by themselves. Since 2005, respondents of the EU-SILC survey are regularly asked the following question: ‘Please think about your total housing costs including mortgage repayment (instalment and interest) or rent, insurance and service charges (sewage removal, refuse removal, regular maintenance, repairs and other charges). To what extent are these costs a financial burden to you?’ The possible answers are: a) a heavy burden, b) a slight burden, and c) no burden at all. Similarly, in the 2007 EU-SILC respondents were asked about whether they felt they had a shortage of space. We evaluate to what extent the respondent’s subjective perception conforms to objective measurement using both existing and new thresholds. The assumption is that the closer the objective rate is to its subjective assessment, while following logic, purpose and theory of measurement of objective rate, the more appropriate the definition is. The distance between objective and subjective indicators will be measured as a Euclidian distance between the percentage of the population at risk of housing expense overburden (or living in an overcrowded dwelling, respectively) and the percentage of the population perceiving total housing costs (space respectively) to be a problem for the household. Formally:
distance
n
w h h
2
i 1
i
1
2
, where
distance
- Euclidian distance between measures;
n
- number of countries;
wi
- weights for individual countries (i) based on the population size; 12
h1
- share of households above the threshold for housing expense ratio (or, respectively, living in overcrowded housing) according to the selected definition;
h2
- share of households perceiving that total housing costs (dwelling space respectively) is a problem for the household.
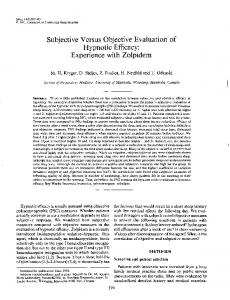
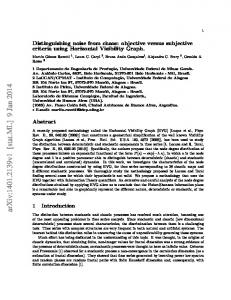
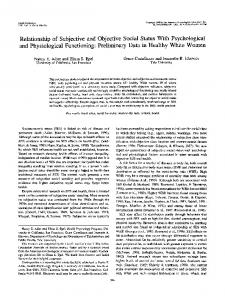
Findings Figure 1 compares the shares of households that perceive housing costs as a heavy burden (i.e. a subjective indicator) and the shares of households with a housing expense ratio above 40% (i.e. an objective indicator with Eurostat threshold) in selected European countries in 2011. Figure 1: Percentage of households that perceive housing costs as a heavy burden and percentage of households with a total housing expense ratio above 40%
13
Source: EUSILC UDB 2011 – version 4 of August 2014, authors’ calculations.
The countries in Figure 1 were selected with a view to the volatility of the median housing expense ratio and to the volatility of the share of households with a ratio above 40% in 2005, 2007, 2009 and 2011. In other words, the housing expense ratio and the shares of households with a ratio greater than 40% were examined for all four years and the figures were compared for individual countries over time. We then excluded those countries in which there were significant year to year fluctuations in the median ratio and/or share of households with a ratio greater than 40%. Instability over time was likely
14
caused by a methodological problem in data collection rather than being a reflection of reality.6 Another reason could be a change in the regulations attached to the housing allowance in the given country or changes in the methodology of the EU-SILC survey. Özdemir and Ward (2009) noted the problem of changes to regulations governing the housing allowance in Germany (for 2007), where the housing allowances began especially to be part of minimum income payments. As a consequence, the housing expense ratio for Germany was considerably overvalued and the authors excluded the country from their international comparison. In most of the countries listed in Figure 1, the share of households that perceive their total housing costs as a heavy burden is greater than the share of households with a total housing expense ratio above 40%, i.e. in most countries the housing cost burden is perceived rather more negatively than what would correspond to the objective housing expense ratio threshold. There are only a few countries (Denmark, Sweden and the Netherlands) where the opposite is true. The biggest difference between the subjective and objective indicators was observed among post-socialist and SouthEuropean countries.
6
The following countries were excluded from the analysis: Bulgaria (the median housing cost ratio in 2007 was
nine percentages point above the ratio in 2009 and the share of households with ratio above the 40% threshold was almost three times higher in 2007 than in 2009), Germany (the median ratio in 2007 and 2009 was approximately five percentage points higher than in 2005 and 2011, and the share of household with ratio above the 40% threshold was more 10 percentage points higher in the same years), Croatia (joined the survey in 2011, so nothing can be inferred about the volatility of its ratio), Lithuania (the median ratio in 2007 and 2009 was approximately five percentage points lower in 2005 and 2009 than in the other years, and the same applied for the share of households with ratio above the 40% threshold, Norway (the median ratio in 2005 was half what it was in the years after that), Romania (the median ratio in 2011 was less than half what it was in 2007 and 2009) and Slovakia (in 2007 the median ratio was seven percentage points higher than in 2011).
15
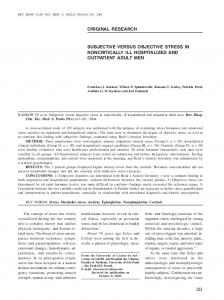
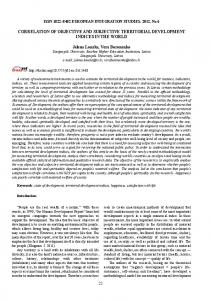
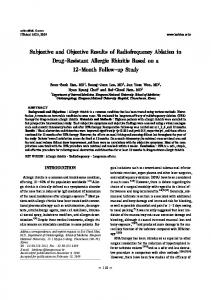
In reference to comparison theory, it is likely that the greater the inequality in the housing expense ratio in society (country), the greater is the share of households that perceive housing costs as a heavy burden. In order to test this hypothesis, we calculated the coefficient of variation of the housing expense ratio for each of the countries studied and then the correlation between it and the share of households that considered their housing costs as a heavy burden. The correlation coefficient (Pearson cor. = 0.46)7 confirmed that the share of households that feel their housing costs to be a heavy burden correlates positively and significantly with the coefficient of variation of the housing expense ratio. It would also be possible to expect there would be a large share of households that perceive their housing burden as heavy in countries where there was a significant increase in the housing expense ratio over the observed period (2005-2011) – given the instability of the average ratio in some countries over time, however, it was not possible to reliably test this hypothesis. Finally, it is likely that the greater the inequality in the income distribution in society (country), the greater is the share of households that perceive housing expenses as a heavy burden. The correlation coefficient (Pearson cor. = 0.53)8 confirmed that the share of households that feel their housing expenses to be a heavy burden correlates positively and significantly with the income decile ratio.9 Gan and Hill (2009) pointed out that focusing on single quantile (e.g. median value) may provide biased estimates of affordability of the whole population since it does not reflect differences in housing affordability for different income quantiles. In this paper, however, we follow official Eurostat median statistics and try to incorporate inequalities into single figure indicator. The shares of households with a ratio above the alternative thresholds and the share of households that perceive their housing costs as a heavy burden are depicted in Figure 2. A comparison of Figure 1 and Figure 2 clearly shows that in the case of both alternatives the share of households above the
7
Correlation is significant at the 0.05 level (2-tailed). Correlation is significant at the 0.01 level (2-tailed). 9 The correlation between the share of households that feel their housing costs to be a heavy burden and income quintile ratio was somewhat weaker (0.40), but still significant at the 0.05 level. The correlation between the share of households that feel their housing costs to be a heavy burden and coefficient of variation in incomes was close to zero (0.032) and thus it was not statistically significant. 8
16
threshold is closer to the share of households that subjectively perceive their housing costs as a heavy burden than what the Eurostat threshold results in.
Figure 2: Percentage of households that perceive housing cost as a heavy burden and percentage of households with a total housing expense ratio above 35% and above 167% of country median ratio
Source: EUSILC UDB 2011 – version 4, of August 2014, authors’ calculations.
The visual comparison in Figure 2 is accompanied by a comparison of the Euclidian distances between subjective and objective rates (Table 4). The last four columns in Table 4 show the Euclidian distance (after weighting by population size) between the share of households with a housing expense ratio above 40% (Eurostat threshold) and the subjective overburden rate (Distance 1), between the share of households with a housing expense ratio above 35% and the subjective overburden rate (Distance 2), and between the share of households with a housing expense ratio above 167% of the country median and the subjective overburden rate (Distance 3). The values in parentheses for Distance 2 and Distance 3 are marginal differences from Distance 1. Since the results for countries do not necessarily
17
follow the same pattern, country-specific distances were weighted (by population size weights) and summed up for all the countries (last row of Table 1). Given the lower value of the total distance, the alternative thresholds are ‘on average’ closer to the subjective perception than the Eurostat threshold is. The definition based on the median housing expense ratio proved to be much closer to the subjective housing expense overburden rate than any globally fixed ratio. The distances between the subjective and objective rates for the years 2005, 2007 and 2009 are not reported here due to limited space, but they show the same patterns as for the year 2011.
18
Table 1: Euclidian distances between objective and subjective overburden rates (EU-SILC 2011) Share of households perceiving housing costs as a heavy Country burden (%) AT 14.8 BE 29.8 CY 69.3 CZ 27.0 DK 8.3 EE 29.9 ES 50.3 FI 19.6 FR 25.4 HU 40.2 CH 23.5 IE 31.2 IS 31.6 IT 52.5 LU 36.4 LV 44.7 MT 50.4 NL 12.3 PL 60.3 PT 29.3 SE 9.1 SI 39.5 UK 26.2 Total
Share of households with a housing expense ratio above 40% 7.6 14.8 4.5 13.3 28.3 9.2 13.8 6.3 7.5 15.0 17.8 6.7 13.9 9.4 6.2 15.8 4.2 19.0 14.3 7.6 12.8 7.4 20.8
Share of households with a housing expense ratio above 35% 10.9 20.1 6.0 18.6 38.2 12.5 16.8 9.9 10.6 21.6 24.3 8.4 18.4 12.2 9.9 21.0 5.7 30.0 19.4 9.4 18.3 10.5 26.3
Share of households with a housing expense ratio above 167% of the country median (%) Population Weights Distance 1 Distance 2 Distance 3 20.8 8 375 164 0.0220 1.1 0.3 (-0.7) 0.8 (-0.3) 22.9 11 000 638 0.0290 6.5 2.7 (-3.8) 1.4 (-5.1) 29.7 839 751 0.0022 9.3 8.9 (-0.4) 3.5 (-5.8) 19.7 10 486 731 0.0276 5.2 1.9 (-3.3) 1.5 (-3.7) 16.6 5 560 628 0.0146 5.9 13.1 (7.2) 1.0 (-4.8) 21.9 1 329 660 0.0035 1.5 1.1 (-0.4) 0.2 (-1.3) 27.1 46 667 174 0.1228 163.6 137.8 (-25.8) 66.1 (-97.5) 25.1 5 375 276 0.0141 2.5 1.3 (-1.2) 0.4 (-2.1) 28.1 64 978 721 0.1710 54.8 37.5 (-17.3) 1.2 (-53.5) 15.8 9 985 722 0.0263 16.7 9.1 (-7.6) 15.6 (-1.0) 17.7 7 870 134 0.0207 0.7 0.0 (-0.7) 0.7 (0.0) 27.6 4 570 881 0.0120 7.2 6.3 (-0.9) 0.2 (-7.0) 21.9 318 452 0.0008 0.3 0.1 (-0.2) 0.1 (-0.2) 27.3 59 364 690 0.1562 290.2 253.7 (-36.5) 99.2 (-191.0) 36.1 511 840 0.0013 1.2 0.9 (-0.3) 0.0 (-1.2) 24.6 2 074 605 0.0055 4.6 3.1 (-1.5) 2.2 (-2.4) 26.9 414 989 0.0011 2.3 2.2 (-0.1) 0.6 (-1.7) 10.8 16 655 799 0.0438 2.0 13.7 (11.7) 0.1 (-1.9) 20.7 38 529 866 0.1014 214.6 169.6 (-45.0) 159.0 (-55.6) 26.0 10 572 721 0.0278 13.1 11.0 (-2.1) 0.3 (-12.8) 20.3 9 415 570 0.0248 0.3 2.1 (1.8) 3.1 (2.8) 23.8 2 050 189 0.0054 5.6 4.5 (-1.1) 1.3 (-4.2) 22.7 63 022 532 0.1659 4.8 0.0 (-4.8) 2.0 (-2.8) 379 971 733 1.0 28.5 26.1 (-2.4) 19.0 (-9.5)
Distance 1 = weighted distance between the share of households with a total housing expense ratio above 40% (‘objective’ overburden rate based on the Eurostat definition) and the share of households perceiving housing costs as a heavy burden (i.e. ‘subjective’ overburden rate). Distance 2 = weighted distance between the share of households with a total housing expense ratio above 35% and the ‘subjective’ overburden rate. Distance 3 = weighted distance between the share of households with a total housing expense ratio above 167% of the country median and the ‘subjective’ overburden rate. Source: EUSILC UDB 2011 – version 4 of August 2014, authors’ calculations.
19
Analyses of housing affordability often take into account housing overconsumption (Thalmann 1999; Lux and Sunega 2006), i.e. the fact that many households live in dwellings that are ‘too large’ for them. ‘Some households deliberately spend a large part of their income for the enjoyment of residential comfort. … Conversely, the conventional affordability index does not detect households in difficulty, who spend less than the limit share of their income on rent.’ (Thalmann 1999: p. 1933) So in order to more accurately determine the share of households at risk of housing unaffordability, we attempted to take into account the rate of overcrowding. For the purposes of this paper we chose a simple approach using one coefficient, through which there was an increase in the share of households exceeding the housing expense ratio threshold in countries with a high overcrowding rate and conversely a decrease in the share of households exceeding the housing expense ratio threshold in countries with a high under-occupation rate. We used the Eurostat threshold for overcrowding that is described in the methodological section. For all countries we determined the ratio of number of over-consuming households to number of under-consuming households, and standardised these ratios on a scale from zero to one. Countries with a ratio close to zero typically had a small share of housing overconsumption, while countries with a ratio close to one typically had a large share of housing overconsumption. Given the fact that for countries with a smaller share of households over-consuming than under-consuming housing, the ratio ranged from zero to one, while for countries with a higher share of housing over-consumption than under-consumption the ratio was much higher (in double rather than single digits), standardisation was conducted separately for the two groups of countries. The resulting overcrowding coefficient was set as the difference between the value of one and the value of the standardised ratio for countries with a larger share of over-consuming than under-consuming households, and as a sum of one and the value of the standardised coefficient for countries with a larger share of under-consuming than overconsuming households. The share of households in a given country with a housing expense ratio above thresholds was adjusted by the value of this coefficient. Formally:
20
k = 1 – p if p > 1 k = 1 + p if p 1 p = 1 – [(xi – xmin1) / (xmax1 – xmin1)] for xi 1);
xmax
- maximum of the ratio of the share of households over-consuming housing to underconsuming housing in countries with a larger share of over-consumption than underconsumption (i.e. xi > 1);
xmin1
- minimum of the ratio the share of households over-consuming housing to under-consuming housing in countries with a larger share of under-consumption than over-consumption (i.e. xi