22nd Color and Imaging Conference Final Program and Proceedings and 2nd Congress of the International Academy of Digital Pathology ...
Subspace-Clustering-Based Multispectral Image Compression Farnaz Agahian and Brian Funt; Simon Fraser University; Vancouver, British Columbia, Canada
Abstract This paper describes a subspace clustering strategy for the spectral compression of multispectral images. Unlike standard PCA, this approach finds clusters in different subspaces of different dimension. Consequently, instead of representing all spectra in a single low-dimensional subspace of a fixed dimension, spectral data are assigned to multiple subspaces having a range of dimensions from one to eight. For a given compression ratio, this tradeoff reduces the maximum reconstruction error dramatically. In the case of compressing multispectral images, this initial compression step is followed by lossless JPEG2000 compression in order to remove the spatial redundancy in the data as well.
Introduction Over the past few decades, the acquisition of highdimensional data has become increasingly common in many application fields and consequently significant effort has been made to compress, store, and transmit such datasets. Many of these developments have been based on the fact that the intrinsic dimension of a high-dimensional dataset is often much smaller than the dimension of the original space. Relying on this observation, multivariate statistical tools such as Principal Component Analysis (PCA) can be utilized to determine the dimension of the smallest subspace that represents the data without considerable loss of information. In standard PCA, it is assumed that that data is drawn from a single low-dimensional subspace and therefore the number of dimensions of this subspace is the only parameter that needs to be determined. Nonetheless, in practical situations the data may be drawn from various subspaces [1]. This means it seems reasonable to consider extending traditional data reduction techniques so as to discover clusters of data in several subspaces of the same dataset. The dimensions of these subspaces may be different. This strategy is called Subspace Clustering and has had various applications in computer vision and image processing [2-4]. The main goal of subspace clustering is to find the number of subspaces, their dimensions and a basis for each subspace. When the number of subspaces is equal to 1, this problem reduces to standard Principal Component Analysis [1]. A complex image generally will contain collections of pixels having similar spectra. Clearly, similar spectra are more likely to be modeled well with a fewer principal components than very dissimilar spectra. Hence subspace clustering will be useful for the spectral compression of multispectral images, since instead of representing all the image’s spectra in a single low-dimensional subspace of fixed dimension as standard PCA does, the spectral data can be distributed into multiple subspaces with dimensions ranging from 1 to D, where D is specified in advance. This strategy, which we call MS-PCA (Multiple-Subspace PCA), allows us to devote more resources to the spectra that differ significantly from the majority of spectra in a given dataset and
fewer resources to those that can be modeled using fewer dimensions.
Multiple-Subspace PCA (MS-PCA) As discussed above, subspace clustering can be thought of as a generalization of PCA in which data points are partitioned into multiple subspaces whose principal axes are computed individually. More formally, assume we are given N M-dimensional T vectors x i [ x1 , x 2 , , x M ] aligned in a data matrix X . Each vector represents the spectrum of a single image pixel. The set of N spectra x i i 1 can be considered to be drawn from an unknown union of n 1 linear subspaces S1 S2 Sn . Each subspace Si
of
dimension d i ,
0 di M contains
Ni
spectra,
n
and N
N
i
.
i 1
If the spectra were already classified, we could easily apply standard PCA to fit an optimal subspace to each cluster. On the other hand, if the subspaces were known one could assign each spectrum to the subspace that models it better than the others. However, in practice we neither have a priori information about the subspace partitioning nor about which spectrum comes from which subspace. Therefore, the problem is to concurrently partition the space into subspaces with associated PCA bases, and assign each spectrum to the subspace in which it is best modelled in terms of the subspace’s basis. The following describes the details of the proposed MS-PCA algorithm, which performs these two tasks simultaneously. Algorithm: Multiple-Subspace PCA (MS-PCA) Input: The number of subspaces, k, a dataset (a collection of spectral data) and thresholds, Ti, i=1…k-1, on the acceptable NRMS in the representation within each subspace. Output: A set of k subspaces for which the NRMS (Eq. 1) of each subspace is less than its specified threshold. 1. 2. 3.
4. 5.
Set the number of dimensions, D, to 1. Repeat steps 3, 4 and 5 until the number of dimensions D reaches k. Apply standard PCA on the dataset and fit a subspace of dimension D (D=1 in the first iteration, D=2 in the second and so on). Assign any spectrum whose NRMS is less than Ti to this cluster and remove it from the initial dataset. Increment D by one.
The MS-PCA algorithm clusters high-dimensional data and assigns each spectrum to the lowest-dimensional subspace that is
22nd Color and Imaging Conference Final Program and Proceedings and 2nd Congress of the International Academy of Digital Pathology
77
able to represent it within the specified NRMS error tolerance. The NRMS (normalized root mean squared) fit is defined as:
1/ 2
R R e
2
(1) 1/ 2 R meanR e 2 where mean() indicates the mean value of the vector spectrum and R e is the elements, R is the original estimated spectrum over 400 700 . We use the Matlab implementation of NRMS (i.e., goodnessOfFit function with the NMRSE parameter) [5]. The number of subspaces was set to 8; however, it can be increased for greater accuracy but at the expense of increased storage space. Experimentally, the choice of 8 works well since the spectral reflectances of non-fluorescent objects tend to be relatively smooth [6]. NRMS 1
Testing on Multispectral Images To evaluate the performance of the proposed MS-PCA method for spectral compression of multispectral images, we test them on 10 multispectral images from the database of Hordley et al. [7]. All the spectra represent reflectances sampled in 10nm steps from 400-700nm. The accuracy of the spectral representation at a given compression ratio in terms of the NRMS (Eq. 1) and goodness of fit (GFC) error measures was assessed. The GFC was proposed by Hernandez-Andres [8] and is defined as:
R ( ) R ( ) e
GFC
R()
2
1/ 2
R e
1/ 2
(2)
2
The value of GFC ranges from 0 to 1, where 1 indicates a perfect spectral match. For GFC>0.995, the reconstruction will be considered acceptable, while very good and excellent (almost exact fit) reconstructions require GFC>0.9990 and GFC>0.9999. NRMS varies between -∞ (no fit) to 1 (perfect fit). In addition to the average NRMS, the percentage of spectra reconstructed with NRMS > 0.95 (very good fit) and those with NRMS < 0 (very poor fit) are both reported.
The storage required for the compressed image is the sum of the bits required to encode the eigenvectors, along with the principal component coefficients and the mean vector. Since the eigenvectors differ in importance, the resources needed for encoding them differ too. Based on preliminary tests, the results reported below are based on using 8, 7 and 5 bits for the first to third components, respectively.
Evaluation in terms of Spectral Accuracy As the results in Table 1 show, as the compression ratio increases, the differences between the performance of classic PCA and MSPCA become even more pronounced. This demonstrates the effectiveness of the strategy of distributing spectra into different subspaces of dimension varying from 1 to 8. If a given spectrum is not well represented using the first few principal components, there is still a good chance that it will be in a subspace of slightly higher dimension. If it is a particularly unusual spectrum it will eventually be represented in an 8-dimensional subspace, where in most cases it will be modeled accurately. This contrasts with standard PCA, which represents all spectra using a fixed number of principal components, and is unable to detect and then encode outliers more accurately. When the PCA dimension is low, MSPCA has the most opportunity to be effective (last group in Table 1). However, as the dimension is increased the PCA representation improves to the point at which it is able to encode the spectra with sufficient accuracy, and as a result the performance difference between these two strategies becomes smaller (1st group in Table 1). Table 1 compares the performance of these two spectral compression approaches in terms of the number of spectra that are recovered very well (i.e., NRMS>0.95) and those recovered very poorly (NRMS0.999) is always higher than the percent of samples compressed with standard PCA at the corresponding compression ratio.
Spectral Recovery Results
Analyzing MS-PCA versus Standard PCA
Table 1 lists the average spectral recovery error for 4 different compression ratios for standard PCA and MS-PCA. Based on a preliminary experiment, we found that when the dimension of the spectra is reduced from 31 to 3, 4, 5 and 6 using the standard PCA, the corresponding average compression ratios were 11.8, 9.5, 8.0 and 7.0, respectively. In order to make a fair comparison between methods the thresholds of MS-PCA were adjusted so as to result in similar compression ratios to these.
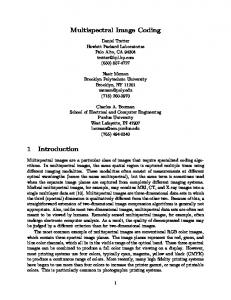
Standard PCA represents all spectra in terms of a single subspace of fixed dimension. MS-PCA on the other hand represents spectra in different subspaces of varying dimension. As an example of how this works in practice, we applied PCA and MS-PCA to the Kellogg’s multispectral image and randomly selected one spectrum from each subspace. Fig. 1 shows the reconstructed spectra. A 5-dimensional basis was used for standard PCA, while MS-PCA used multiple bases varying in dimension from 1 to 8.
78
© 2014 Society for Imaging Science and Technology
Table 1. Error in spectral recovery for 10 multispectral images, compressed by standard PCA and multiple-subspace PCA at four different compression ratios (CR). Standard PCA was performed using a 6, 5, 4, and 3-dimensional basis corresponding to CR equal to 7, 8, 9.5 and 11.8.
Normalized RMS % of samples Mean >0.95 0.995 >0.999
CR=7.0 PCA MS-PCA
0.78 0.84
10.29 2.25
1.40 0.10
92.31 97.73
60.98 61.76
CR=8.0 PCA MS-PCA
0.73 0.82
5.52 0.96
3.08 0.08
87.81 91.82
45.19 48.80
CR=9.5 PCA MS-PCA
0.65 0.78
2.98 0.68
7.30 0.11
83.00 86.53
30.41 35.94
CR=11.8 PCA MS-PCA
0.56 0.72
2.23 0.58
11.02 0.09
74.11 72.19
18.36 25.75
To make a fair comparison across the methods, we adjusted the methods’ parameters so that each resulted in the same spectral accuracy as measured in terms of mean NRMS. In particular, the accuracy was fixed at mean NRMS = 0.82 based on initial tests with MS-PCA, and the parameters of the other methods were then adjusted to match this accuracy. In the case of standard PCA, this accuracy was achieved at dimension 7, so the spectrum at each pixel is represented by a vector of 7 weights. The weights for all pixels constitute a 7-channel image, which is then compressed using lossless JPEG2000 to remove the spatial redundancy between the weights. Lossless compression increases the overall compression ratio of 7D-PCA from 6.3 to 11.
PCA 0.82 MS-PCA 0.76
PCA 0.86 MS-PCA 0.77
For the spectra falling in low-dimensional subspaces (i.e. 1and 2-dimensional), it is clear that the fit for the 5-dimensional standard PCA is better than that for MS-PCA, but that the fit for MS-PCA is, nonetheless, still reasonably good (Figs. 1(a) and 1(b)). Of course, if it were not reasonably good then MS-PCA would not have sorted that particular spectrum into that lowdimensional subspace in the first place. MS-PCA uses higherdimensional representations to encode those samples that are not recovered well in lower dimensions. As can be seen in Figs 1(d) and 1(e), for the spectra falling in subspaces of dimension 7 and 8 MS-PCA provides a much better fit than standard PCA. Interestingly, even at 5-dimensions (Fig 1(c)), MS-PCA outperforms 5-dimensional PCA on these examples, particularly in the reconstruction of the short wavelength region. In the other words, using the same dimensionality, MS-PCA provides a better approximation to the original reflectance than standard PCA. The likely reason for this is that the 5-dimensional PCA basis needs to account for the entire dataset whereas, the 5-dimensional MS-PCA basis only needs to account for those spectra that were not accounted for in the other lower-dimensional subspaces, and hence can be more specialized.
Adding Spatial Compression Our focus has been on representing datasets of spectra, and multispectral images are a good source of such spectra. Of course, multispectral images include a high degree of spatial correlation in addition to the spectral correlation discussed above. Standard image compression techniques can be combined with standard PCA and MS-PCA in order to obtain additional data compression. As an example, we applied lossless JPEG2000 to the ‘image’ of weighting coefficients from each of the two spectral compression methods. Note that JPEG2000 compresses each channel of a given image independently.
(b)
(a)
PCA 0.68 MS-PCA 0.89 (c)
PCA 0.72 MS-PCA 0.88 (d)
PCA 0.62 MS-PCA 0.90 (e) Figure 1 Examples of the fit to the original spectra (solid black) of the reconstructed spectra using the fixed 5-dimensional PCA subspace (dashed blue) versus the MS-PCA subspaces (red circles) of different dimension. Plots (a) to (e) illustrate subspaces of dimension 1, 2, 5, 7 and 8, respectively. Subspaces of dimension 3, 4, and 6 are also used but are not included in the figure. Fits for the 1- and 2-dimensional MS-PCA subspace ((a) and (b)) are reasonable but not as good as those of 5-dimensional. Fits for the 5dimensional MS-PCA subspace (c) begin to be better than those for PCA. Fits for dimensions 7 and 8 ((d) and (e)) are clearly superior. The NRMS of each fit is given under each plot.
22nd Color and Imaging Conference Final Program and Proceedings and 2nd Congress of the International Academy of Digital Pathology
79
For comparison to a standard compression technique, we applied lossy JPEG2000 directly to the multispectral images without any pre-processing. The compression ratio in this case is 8. Since MS-PCA uses subspaces of varying dimension, the resulting number of weights varies as well. To make the number of weights equal for all pixels, zero weights are added. The resulting 8-channel image is then compressed using lossless JPEG2000. Applying spatial compression increases the MS-PCA compression ratio from 8.0 to 13. Clearly, combining spectral and spatial compression leads to higher compression ratios than either spectral or spatial compression alone. On the test dataset, MS-PCA combined with lossless JPEG2000 is 62% more effective than lossy JPEG2000.
Conclusion A new spectral compression method, Multiple-Subspace PCA (MS-PCA) has been presented and shown to work well when tested on a dataset of 10 multispectral images. In contrast to standard PCA, which represents data in a single low-dimensional subspace of a fixed dimension, the key idea used in the proposed approaches is to represent the data in multiple subspaces of different dimension. Each spectrum is distributed to the subspace of lowest dimension in which it can be represented within a given error tolerance. Those spectra that can be represented well using only a few principal components will be allocated to very lowdimensional subspaces, while those requiring more principal components for accurate reconstruction will be placed in subspaces of higher dimension. Allocating the resources in this way means that for a fixed compression ratio the spectra can be represented more accurately. In the case of multispectral images, for which spatial correlations can be expected between the spectra, using lossless JPEG2000 to compress the subspace weighting coefficients further improves the results.
80
References [1] R. Vidal, “A Tutorial on Subspace Clustering,” IEEE Signal Processing Magazine, 28, 52 (2011). [2] A. Yang, J. Ma Y. Wright, and S. Sastry, “Unsupervised Segmentation of Natural images via Lossy Data Compression,” Computer Vision and Image Understanding, 110, 212 (2008). [3] J. Ho, M. H. Yang, J. Lim, K. C. Lee, and D. Kriegman, “Clustering Appearances of Objects under Varying Illumination Conditions,” Proc. IEEE on Computer Vision and Pattern Recognition, pg. 11. (2003). [4] W. Hong, J. Wright, K. Huang, and Y. Ma. “Multi-scale Hybrid Linear Models for Lossy Image Representation,” IEEE Trans. on Image Processing, 15, 3655 (2006). [5] MATLAB and System Identification Toolbox, Release 2013a, The MathWorks, Inc., Natick, Massachusetts, United States. [6] J. P. S. Parkkinen, J. Hallikainen, and T. Jaaskelainen, “Characteristic Spectra of Munsell Colors,” J. Opt. Soc. Am. A., 6, 318 (1989). [7] S. Hordley, G. Finlayson, P. A. Morovic, “Multi-Spectral Image Database and an Application to Image Rendering across Illumination,” Proc. of the Third International Conference on Image and Graphics, pg. 394 (2004). [8] J. Hernandez-Andres, J. Romero. A. García-Beltrán, and J. L. Nieves “Testing Linear Models on Spectral Daylight Measurements,” Appl. Opt. 37, 971 (1998).
Author Biography Farnaz Agahian is a doctoral student in the department of Computing Science, Simon Fraser University, having already received the PhD degree in Color Science from Tehran Polytechnic in 2009. Brian Funt obtained his Ph.D. in Computer Science from the University of British Columbia in 1976. He has been a Professor of Computing Science at Simon Fraser University since 1980. He has participated in 20 of the previous 21 CIC conferences.
© 2014 Society for Imaging Science and Technology