KENNETH A. MARX *, JAMES R. ALLEN ** and JOHN E. HEARST ***. Department of Chemistry, University of California, Berkeley, Calif. 94720 (U.S.A.).
129
Biochimica et Biophysica Acta, 4 2 5 ( 1 9 7 6 ) 1 2 9 - - 1 4 7 © E l s e v i e r S c i e n t i f i c P u b l i s h i n g C o m p a n y , A m s t e r d a m - - P r i n t e d in T h e N e t h e r l a n d s
BBA 98525
C H A R A C T E R I Z A T I O N OF THE REPETITIOUS HUMAN DNA FAMILIES
KENNETH
A. M A R X
*, J A M E S R. A L L E N ** and J O H N E. H E A R S T
***
Department of Chemistry, University of California, Berkeley, Calif.94720 (U.S.A.) (Received April 25th, 1975) (Revised manuscript received October 27th, 1975)
Summary Human DNA isolated from HeLa cells or human placental tissue has been fractionated on hydroxyapatite at Cot 1.0. The 25% of total DNA isolated at Cot 1.0 is composed of 3% foldback DNA and 22% which renatures by secondorder kinetics and can be resolved into five renatured DNA families banding at distinct densities in CsC1 gradients. The individual renatured DNA families were isolated and their physical properties including reassociation kinetics determined. A t w o - c o m p o n e n t kinetic analysis was used to resolve kinetic heterogeneity. The three lightest density DNA families possess satellite DNA-like properties. The two heaviest density DNA families w e r e shown to contain reassociated highly repetitious DNA as well as single-stranded, middle-repetitious DNA sequences, suggesting interspersion. The middle repetitious DNA sequences are thought to be related in these two DNA families.
Introduction
Reassociation kinetic studies of the DNA of higher organisms have played a crucial role in the evolution of our concepts of the information content and organization o f higher-organism DNA. Considerable portions of the genomes of eukaryotic organisms are known to be comprised of simple-sequence, highly repetitious DNAs [1,2].. Furthermore, many studies have emphasized the extreme molecular heterogeneity of the repetitious DNA classes of eukaryotic organisms [2,3,4,5]. A prerequisite then to a knowledge of the organization of eukaryotic genomes is the isolation and characterization of individual DNA sequences fami* Present address: Institute of Animal Genetics, University of Edinburgh, Edinburgh EH9 3JN, U.K. * * Present address: Department of Zoology Oregon State University, Corvallis, Oregonl U.S.A. *** To w h o m requests for reprints should be addressed.
130 lies. The technique of Ag ÷ or Hg 2÷ binding in Cs~SO4 gradients has permitted the isolation of a number of .human DNA families [3,6,7]. However, this technique is limited [8] to DNAs having unusual, satellite-like properties. An alternate method of fractionation using hydroxyapatite utilizes DNA complexity, a property of primary interest, to effect separation. Although hydroxyapatite discriminates kinetic classes of human DNA [9,10,11], preliminary evidence by Hearst et al. [10] indicates the presence of many DNA families within a single kinetic class. Clearly, further fractionation of kinetic classes into DNA families is necessary. In this study the highly repetitious Cot 0--1.0 class of human D N A is fractionated into molecular families, which are then characterized individually• Materials and Methods
DNA preparation HeLa $3 cells were grown in RPMI-1640 medium supplemented with 5% fetal calf serum and 1% pen-streptomycin and 1% aureomycin at 37°C (Grand Island Biological). DNA was 3H-labelled and extracted from HeLa cells and human placenta essentially as described in Cech et a]. [12] with the following modifications. Human placentae were homogenized in 0°C hypotonic medium in a Virtis " 2 3 " homogenizer with macroblades at highest speed. After decanting the hemolysate the tissue was resuspended in 0°C nuclear buffer and homogenized similarly until light microscopy revealed nuclei with no adherent cytoplasm. Before continuing the isolation the homogenate was filtered through cheesecloth which trapped the anucleated tissue clumps. Simultaneously with the ribonuclease treatment, 0.2 mg/ml a-amylase (Sankyo) was added. The final DNA extraction mixture used was 24 : 1 chloroform/iso-octanol.
DNA molecular weight determination The DNA used in the experiments below was routinely sheared by sonication as described in Cech et al. [12] • s pH 1a.o values in 0.9 M NaC1, 0.1 M NaOH 20,w were determined by boundary sedimentation. Molecular weights were calculated according to Studier [13].
Isolation of rapidly renaturing sequences DNA at a concentration of Co (mol phosphate • 1-~) in 0.05 M sodium phosphate buffer pH 6.8 was denatured with 1 M NaOH at room temperature. The solution was brought to 60°C and an appropriate volume of 60°C 2 M NaH2PO4 solution was added to effect a final concentration of 0.12 M phosphate buffer (0.18 M Na +) pH 6.8. Upon renaturation at 60°C to the desired Cot the solution was thoroughly mixed with a slurry of hydroxyapatite in 0.12 M phosphate buffer pH 6.8 at 65°C. Stepwise elutions continued at 65°C with a series of 0.12 M, 0.16 M and 0.45 M phosphate buffer pH 6.8 wash solutions. At each step the slurry pellet was resuspended in the buffer and equilibrated for 1 min at 65°C before pelleting in a clinical centrifuge at 65°C and decanting o f f the supernatant. The yields in the phosphate buffer wash fractions were determined optically (A26onm) unless small 3H-labelled amounts were used, in which case the radioactivity was measured by counting a
131 small aliquot in 1 ml water plus 10 ml scintillation solution (1 part Triton X-100 to 2 parts Amersham-Searle PPO-POPOP fluor in toluene).
Equilibrium density gradient centrifugation Equilibrium density gradient centrifugation was carried o u t in a Beckman Model E Analytical Ultracentrifuge with photoelectric scanner optics. Doublesector titanium center pieces were used [14]. Harshaw optical grade CsC1 was used and gradients were run to equilibrium in 3 days at 35 000 rev./min at 25 ° C. Buoyant densities were measured relative to Micrococcus lysodeikticus DNA, which has a density of 1.733 g/ml relative to Escherichia coli, P0 = 1.710 g/ml. Density differences relative to the marker were calculated from the density gradient ( ~ p / ~ r ) b o u y a n c y 9.35 • 10 -1 °¢o2~ according to Schmid and Hearst [15]. Preparative centrifugation was performed at 35 000 rev./min at 25°C in equilibrium CsC1 gradients (3 days) in the Spinco fixed angle 60 Ti rotor. Polyallomer tubes were used with 10 /~1 of 20% sarkosyl added to decrease adsorption of renatured DNA. By using large amounts of starting DNA and rebanding impure fractions up to five times, pure renatured DNA families were obtained. The criterion of purity was the analytical ultracentrifuge CsCl density profile. =
Reassociation kinetics Reassociation kinetics were determined and analysed as described in Marx [16] and Marx and Hearst [17]. All samples were studied in 0.12 M phosphate buffer pH 6.8 (0.18 M Na ÷) at 60°C. Reassociation curves for all DNA samples were determined twice, the curves being superimposable. Each sample returned to the original denatured absorbance after any period of renaturation.
Determination of melting spectra Thermal denaturation spectra of DNA samples were obtained in 0.12 M phosphate buffer (0.18 M Na ÷) pH 6.8. A Beckman DU spectrophotometer fitted to a Gilford Multiple Sample Absorbance Recorder with automatic slit adjustment was used. A HAAKE Thermostatic bath programmed at a temperature increase of 15 ° C/h heated the jacketed cuvette. Results
Reassociation of total nuclear DNA Fig. 1 shows a plot of the optical reassociation * of sonicated ** human nuclear DNA. It can be seen that renaturation occurs over many decades in log Cot. This suggests considerable heterogeneity in the complexity and/or degree o f repetition of ~ e renaturing DNA families, a finding consistent with that of most mammalian DNAs studied, Although no CsC1 density satellites were * A l l D N A samples w e r e studied in varying c o n c e n t r a t i o n s o f e q u i m o l a r ( N a 2 H P O 4 • 7 H 2 0 / N a H 2 P O 4 • H 2 0 ) p h o s p h a t e b u f f e r m i x t u r e s p H 6 . 8 . T h e r e f o r e , the [ N a +] is 1 . 6 - t i m e s t h e s t a t e d
phosphate buffer concentration. * * A l l o f the D N A samples in this s t u d y w e r e sonlcated t o a weight average m o l e c u l a r weight o f
3 0 0 - - 4 5 0 n u c l e o t i d e s / s i n ~ l e strand.
132 1.0
r
' i
r
I
J
1
~0.5 g 1.0)
134 is allowed to continue renaturation at 68°C in 0.12 M phosphate buffer pH 6.8 for 20 h (stringent conditions), the density profile appears as in Fig. 3b. The very high molecular weight aggregates band at distinct and characteristic densities. This p h e n o m e n o n must be due to the reassociation of the 40% singlestranded regions in Cot 1.0 DNA during the stringent renaturation to Cot 10. The stringent conditions select for renatured aggregates containing DNA sequence regions of good homology and allow the unequivocal identification of five distinct renatured DNA families in isolated Cot 1.0 DNA. Each individual renatured DNA family is designated by its renatured CsC1 density *. From preparation to preparation the densities and percentages of each renatured DNA family in the Fig. 3b distribution are invariant following the stringent renaturation. It was found that a Cot 1.0 DNA concentration of at least 1.0 A t2 6cm is required for high molecular weight aggregate formation under strinOhm gent conditions. This is perhaps due to the fact that at higher DNA concentrations bimolecular aggregation is able to compete much more effectively with intramolecular aggregate cyclization.
(iii) Foldback DNA Foldback DNA is t h o u g h t to renature by an extremely rapid intramolecular process due to the presence of sequence inversions [21]. When foldback DNA is isolated from total nuclear DNA at Cot 10 -4 about 3% of total human DNA binds to h y d r o x y a p a t i t e , in good agreement with the 3% estimated from optical data [21] and the 5% isolated on h y d r o x y a p a t i t e [22] at slightly higher molecular weight (600 nucleotide/single strand). As expected, the isolated Cot 10-4--1.0 DNA fraction comprises 22% of the total human genome DNA. The foldback DNA (Cot 10 -4) percentage of an isolated 3H-labelled Cot 1.0 DNA sample was found to be 10%. This can be seen to represent 2.5% of total human DNA. To demonstrate that the foldback DNA fraction is not simply the product of a fast second-order reaction or adventitious binding the optical reassociation kinetics are shown in Fig. 1. The initial renaturation has occurred by Cot < 10 -s, which is below the low complexity limit of second-order DNA renaturation. This demonstrable A260nm loss within the foldback DNA fraction occurs at Cot values where only first-order intramolecular reassociation is possible. The fact that 80% of foldback DNA remains single stranded at Cot 10 -3 is not inconsistent with its presence in the Cot 10 -4 fraction. It is known [12,21] that foldback DNA binds weakly to hydroxyapatite. Cech et al. [12] consider one probable cause of this instability to be single strand nicking. The isolated foldback DNA sequences, subsequently nicked, now renature with secondorder kinetics, which accounts for only 20% renaturation of foldback DNA at Cot 10 -3 in Fig. 1. As expected from the nicking of foldback DNA only 30% of the input foldback DNA bound to h y d r o x y a p a t i t e after rechromatography to a Cot o f 5" 10 -s. Cech et al. [12] have noted a variable 40--90% of mouse
* The more compact nomenclature used here supercedes that used in a [ 1 0 ] . F o r e x a m p l e , h . a . r . r . D N A 1 . 6 8 7 is n o w r e f e r r e d t o as 1 . 6 8 7 D N A . t h i s s t u d y s.re c a l c u l a t e d u s i n g a ( b p / ~ r ) B [ 1 5 ] s o m e w h a t d i f f e r e n t f r o m [ 2 6 ] in t h e literature. T h e r e f o r e , t h e e q u i v a l e n t d e n s i t i e s axe p r e s e n t e d in
previous communication T h e b u o y a n t d e n s i t i e s in t h a t u s e d in m o s t s t u d i e s Table II.
135 foldback DNA b o u n d to hydroxyapatite u p o n rechromatography, somewhat higher than the value determined here. The CsC1 density profiles of the isolated Cot 10 -4 foldback DNA and Cot 10-4--1.0 DNA are shown in Fig. 3c and d following stringent renaturation. The Cot 10 -4 foldback DNA density profile shows a broad featureless distribution while the relative percentage of each renatured DNA family in Cot 10-4--1.0 DNA remains about the same as its percentage in total Cot 1.0 DNA. (The 1.687 DNA position is not evident in this gradient.) Therefore, human foldback DNA does not seem to be enriched in particular Cot 1.0 DNA families in the molecular weight range of 1 . 5 , 1 0 s.
Characterization of the isolated Cot 1.0 DNA families The data obtained in this section describe the sequence properties of individual DNA families rather than the properties of multi-family kinetic classes of DNA [9,11]. The final criterion of purity was the CsC1 gradient density profile in the analytical ultracentrifuge. In all cases, no discernible bands could be found at any of the contaminating density positions. Melting spectra and optical reassociation kinetics of the purified renatured DNA families are presented in Figs. 4 and 5. The kinetic heterogeneity of these DNA families (Fig. 7) is resolved into kinetic components by the method of Marx and Hearst [17] and is summarized in Table I. (i) 1.687 DNA. The presence of this DNA family was overlooked for some time, due in part no d o u b t to its low percentage (1--2%) in the Cot 1.0 DNA and to its preferential extraction into the phenol phase during DNA purification (use of phenol has since been discontinued). It has not been determined whether the 1.687 DNA is completely extracted into the phenol phase, a
1.0C
0,90
~: 0.80
0.70 40
I
50
I
60
I
I
70 80 Temperolure ('=C)
I
90
I00
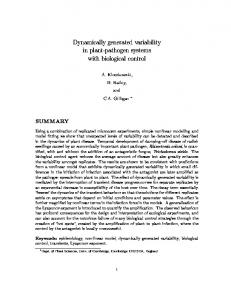
Fig. 4. OPtical m e l t i n g curves o f purified r e n a t u r e d h u m a n D N A families in 0 . 1 8 M Na+: ( e =) 1 . 6 8 7 D N A ; (~ ~) 1 , 7 0 0 D N A ; (o .. o) 1 , 7 0 8 D N A ; (o o) 1 . 7 1 4 D N A . T h e m e l t i n g s p e c t r a w e r e d e t e r m i n e d at D N A c o n c e n t r a t i o n s c o r x e s p o n d l n g t o native a b s o r b a n c e s in t h e range f r o m 0 . 0 8 t o 0 . 1 3 A l2e6m0 n m " P r i o r to m e l t i n g , all D N A s a m p l e s w e r e d e n a t u r e d and r e n a t u r e d for 2 h in 0 . 1 8 M N a + a t 6 8 ° C . T h e r e f o r e , all o f t h e s a m p l e s s.re at a b o u t t h e s a m e C0L value o f 0.1. T h e c u r v e s h a v e b e e n c o r r e c t e d f o r t h e r m a l e x p a n s i o n a n d are n o r m a l i z e d to t h e high t e m p e r a t u r e a b s o r b a n c e for d i r e c t c o m p a r i s o n .
136 property which could identify it as poly [d(A,T)] -like [24] or simply an A • T rich satellite DNA [23]. It was noted that the percentage of 1.687 DNA in the total Cot 1.0 DNA varied from tissues of mixed sex. It is entirely missing from HeLa cell Cot 1.0 DNA, present to a slight extent in uterine muscle Cot 1.0 DNA and more a b u n d a n t in WI-38 Cot 1.0 DNA (female embryonic lung cell line). Though the reasons for its absence in HeLa DNA are not understood, satellite DNA polymorphism is a possibility [25]. The melting spectrum of the 1.687 DNA in Fig. 4 has a Tm of 72°C and a very sharp melting transition, very different than the other renatured DNA families. The sharp melting transition indicates well matched renatured duplexes and therefore a DNA family with little sequence divergence. The reassociation curve for the 1.687 DNA, presented in Fig. 5, has a Cot112 of about 1.1 • 10 -3. Any kinetic heterogeneity in this apparently homogeneous DNA family can be resolved by the two c o m p o n e n t kinetic analysis of Marx and Hearst [17] into two second-order renaturing DNA classes. The results in Table I, obtained from the replotted kinetic data in Fig. 6(a), indicate the presence of DNA sequences considerably lower in complexity than expected on the basis of conventional estimates (60 base pairs (f) c o m p o n e n t compared with 620 base pairs estimated from Cotl/2 = 1.1 • 10-3). Since there is no unambiguous way of assigning the kinetic heterogeneity present in DNA reassociation data to a specific number of components, we may think o f the (f) and (s) c o m p o n e n t result as a convenient way of characterizing those sub-populations of sequences which renature respectively the fastest and slowest. (ii) 1.696 DNA. This particular renatured DNA family, comprising 2% of the h u m a n genome, was not characterized due to a lack of material. However, from
1.0
~
I
I
i
I i0 -I
I0
Io
o~
0 10-4
] 10-3
I 10-2
I00
Cot (tool xsec/liter) Fig. 5. O p t i c a l r e a s s o c i a t i o n o f t h e p u r i f i e d r e n a t u r e d h u m a n D N A f a m i l i e s at s o n i c a t e d m o l e c u l a r w e i g h t a n d at t h e 0 . 1 8 M Na + r a t e : (~ @) 1 . 6 8 7 D N A m e a s u r e d in 0 . 1 8 M Na+; (Q D) 1 . 7 0 0 D N A m e a s u r e d in 0 . 1 8 M Na +. T h e 1 . 7 0 3 D N A (= s ) w a s m e a s u r e d in 0 . 1 8 M N a + a n d (o o) in 1.02 M Na + c o r r e c t e d t o t h e 0 . 1 8 M N a ÷ rate. T h e 1 . 7 1 4 D N A (4 A ) w a s m e a s u r e d in 0 . 1 8 M Na* a n d (~ ~) in 0.81 M N a +. D N A c o n c e n t r a t i o n s r a n g e d f r o m 0 . 0 5 7 - - 0 . 1 0 ~A216 0e nmm n a t i v e a h s o r h a n c e . C o r r e c t i o n s t o t h e 0 . 1 8 M N a + rate a n d t h e d e t e r m i n a t i o n s o f A 0 a n d Aoo w e r e m a d e as s t a t e d in t h e l e g e n d o f Fig. 1. T h e lines are n o t t h e o r e t i c a l b u t m e r e l y c o n n e c t t h e set o f p o i n t s .
137
(b)
700
600
300
500'
?
"
400,
80-
q