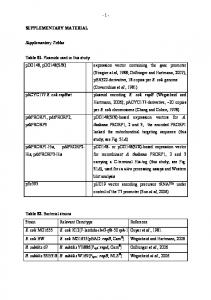
Reverse: GTAACTATTCGGTGCGTTGGG. CDKN2C. Forward: GGGGACCTAGAGCAACTTACT. Reverse: CAGCGCAGTCCTTCCAAAT. CDKN2D. Forward: ...
1
Epigenetic silencing of JMJD5 promotes the proliferation of hepatocellular
carcinoma
cells
by
down-regulating
the
transcription of CDKN1A
Supplementary Material
Supplemental Figure 1. The expression patterns of JmjC family members show
2
JMJD5 downregulation in HCC specimens. (A) The expression patterns of JmjC family members in HCC specimens were drawn based on two public databases (GSE25097 and GSE14520). The y-axis indicates the ratio of the mRNA level of a given gene in HCC to that in the adjacent, non-cancerous liver tissue. + and represent up-regulation or down-regulation, respectively, of a gene in HCC compared with the adjacent, non-cancerous liver tissue. (B) A total of 63 paired HCC and adjacent, non-cancerous liver samples were used to detect the mRNA expression of JMJD5 by RT-PCR (top). JMJD5 intensity was measured and normalized by β-actin, and the ratio of HCC and non-cancer liver was calculated and transformed by log2 (bottom). β-actin served as an internal control. N, adjacent, non-cancerous livers; C, HCC samples. (C) The expression of JMJD5 in HCC cell lines and normal liver was evaluated by semi-quantitative RT-PCR (left), and the relative quantification of bands was performed by gray scanning (right). The value of JMJD5/β-actin in adult liver was normalized 1. β-actin served as an internal control.
3
Supplemental Figure 2. JMJD5 downregulation in HCC is caused by an epigenetic mechanism. (A) RT-PCR was used to test the mRNA expression of JMJD5 in five HCC cell lines after treatment with TSA or DAC. DMSO treatment served as a control, and β-actin was used as an internal control. (B) ChIP with anti-histone modification antibodies, followed by PCR, was used to detect enrichment for histone modifications (H3K9 acetylation and H3K27 trimethylation) on the JMJD5 promoter in HCC samples. IgG served as a negative control. N, adjacent, non-cancerous livers; C, HCC samples.
4
Supplemental Figure 3. JMJD5 knockdown promotes HCC cell growth and tumorigenicity. (A) Hep3B cells were transfected with plasmids containing shRNAs against JMJD5 (sh402 and sh1182), and colonies were subsequently selected with
5
G418. Colony formation is shown with representative dishes (left), and the number of colonies was statistically analyzed (right). The experiment was repeated three times. (B) SK-hep1 and YY-8103 HCC cells with stable JMJD5 knockdown were subcutaneously inoculated into nude mice, and mice with xenograft tumors are shown. (C) Tumor volume was measured for five weeks after the inoculation of YY-8103 cells expressing irrelative shRNA (lenti-NC) or shRNA against JMJD5 (lenti-1182), JMJD5 knockdown efficiency was detected by real-time qPCR (upper). (D) At 5 weeks, euthanasia was carried out, the tumour was removed (upper) and weighed (lower). Two-tailed t-tests were used to calculate significant differences. *, P< 0.05; ***, P < 0.001.
6
Supplemental Figure 4. JMJD5 overexpression inhibits HCC cell growth and tumorigenicity. (A) HCC-LM6 HCC cells stably expressing JMJD5 were subcutaneously inoculated into nude mice, and mice with xenograft tumors are shown. (B) HCC-LM3 HCC cells were transfected with JMJD5, and soft agar colony formation was analyzed. Soft agar colony formation is shown with representative dishes (left), and the colony numbers were statistically analyzed (right). All experiments were repeated at least three times, and a vector containing the reverse JMJD5 sequence was used as a negative control. A two-tailed t-test was used to calculate significant differences. *, P < 0.05.
7
Supplemental Figure 5. JMJD5 regulates the G1-S transition of the cell cycle. (A) Gene set enrichment analysis was performed in HCC tissues with lower JMJD5 expression versus higher JMJD5 expression based on the gene sets of cell cycle progression. NES, normalized enrichment score. Flow cytometry was utilized to analyze the cell cycle of HCC cells transfected with siRNAs against JMJD5 (B) or plasmids expressing ectopic JMJD5 (C); irrelevant siNC or plasmids containing the reverse JMJD5 sequence were used as negative controls. (D) Immunofluorescence
8
images showing YY-8103 (200X) and L02 (100X) cells with BrdU incorporation after JMJD5 knockdown. The percentage of cells with BrdU incorporation was statistically analyzed (right). All experiments were repeated at least three times. **, P < 0.01; ***, P < 0.001.
Supplemental Figure 6. JMJD5 affects HCC cell proliferation by regulating CDKN1A transcription. (A) CDKN1A premature mRNA was analyzed by real-time RT-PCR in MHCC-97H, YY-8103, SK-hep1 and Hep3B cells after JMJD5 knockdown. (B) MHCC-97H and Hep3B cells were transfected with siRNAs against JMJD5, and the expression of CDKN1A pre-mRNA (Pre- CDKN1A), as well as CDKN1A and TP53 mRNA, was detected by RT-PCR. GAPDH pre-mRNA
9
(Pre-GAPDH) and β-actin were used as internal controls. (C) MHCC-97H cells were co-transfected with siRNAs and plasmids encoding ectopic JMJD5, and then the mRNA expression of CDKN1A and TP53 was evaluated by RT-PCR. siNC and a plasmid containing the reverse JMJD5 sequence served as negative controls, and β-actin was used as an internal control. (D) Western blot showed that ectopic JMJD5 increased
the
CDKN1A
protein
level
and
also
rescued
the
JMJD5
knockdown-mediated decrease in CDKN1A protein. (E) MHCC-97H cells were transfected with siRNA against JMJD5 or plasmid expressing JMJD5 after CDKN1A knockdown, western blotting was utilized to detect CDKN1A expression. (F) MHCC-97H cells were co-transfected with shRNA against CDKN1A and plasmid expressing JMJD5, anchorage-independent growth was detected by soft agar colony formation. The representative dishes were shown (left) and colonies number was calculated (right). *, P