Supplementary materials: Application and Validation of Activity ... - MDPI
Recommend Documents
Figure S1. PCR amplification of the mouse Omi/HtrA2 gene promoter. Omi/HtrA2 promoter fragments were amplified using F1âF5 as upstream primers and R as ...
The relationship between experimentally observed pKas and the log Pexp ... Table S1. The relationships between the independent variables (pKa, MV and log ...
Supplementary Materials: Enhanced Electrocatalytic. Activity for Water Splitting on NiO/Ni/Carbon. Fiber Paper. Ruoyu Zhang, Hehe Wei, Wenjie Si, Gang Ou, ...
Stability Enhancement for Ag3PO4 Photocatalyst after Calcination. Pengyu Dong, Guihua Hou, Chao Liu, Xinjiang Zhang, Hao Tian, Fenghua Xu, Xinguo Xi.
Variations of fluorescence intensity of HNA (10 µM) at 513 nm in aqueous solution with. (bottom) ... Job's plots according to the method for continuous variations.
Not Energy. Y. Y. Neutral. Tobias et al. 2012 [33] ..... read English, delivered at specified hospitals. Exclusion: ... spoke/read English, to deliver at either of 2 study.
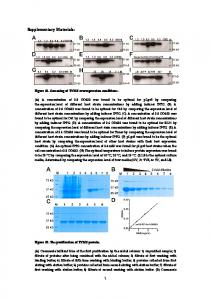
concentration of 0.8 OD600 was found to be optimal for C43 by comparing the expression level of different host strain concentrations by adding inducer IPTG.
Pre-testing step: RT-qPCR analyses with the LightCycler 480 . .... 4364343) and nuclease-free water (5Prime ... Cq values were generated by the SDS software v2.3 and were exported for further calculations. ...... Remove the cartridge from the Droplet
Have you ever used an e-cigarette or other vaping device, even one or two times? 0 = No. 1 = Yes. Past month e-cigarette use. In the last 4 weeks, on how many ...
Mixed Gas Diffusion in the Polymer of Intrinsic Microporosity PIM-SBF-1. 21. (a). (b). SI Figure 4. Comparison of the increasing feed pressure as a function of time ...
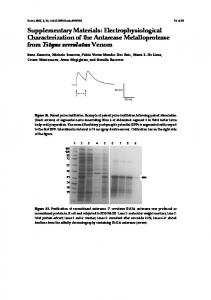
Cesare Montecucco, Aram Megighian, and Ornella Rossetto. Figure S1. Paired pulse facilitation. Example of paired pulse facilitation following paired stimulation.
My knowledge about healthy eating comes from: (check all that apply). â¡ Nutrition education programs at school. â¡ From what I see on TV. â¡ Nutrition ...
Indole-Trimethoxyphenyl Conjugates. Michael M. Cahill, Kevin D. O'Shea, Larry T. Pierce,Hannah J. Winfield, Kevin S. Eccles, Simon E. Lawrence and Florence ...
loadings for all the intermediates of the catalyst synthesis. .... Bond, G.C. Heterogeneous Catalysis, Principles and Applications, 2nd ed.; Oxford University.
UV-Vis Spectroscopy. UV-Vis spectra of AgNWs dissolved in ethanol (PVP) and chloroform (C8-C18) have been recorded using a Shimadzu UV-2401PC ...
Nucleotide sequence of 16S RNA of Citrobacter freundii. TGCAAGTCGAACGGTAGCACAGAGGAGCTTGCTCCTTGGGTGACGAGTGGCGGACGG.
Aldrich) and stored at â80 °C until sequencing. Pyrosequencing .... Edgar, R.C. MUSCLE: Multiple sequence alignment with high accuracy and high throughput.
The mean registration error of the inspections of SB is slightly higher (around 0.25 ... geometric mean is slightly ahead of harmonic mean and product, in SB the ...
Figure S2. Distribution of various geometries of the inosineâuracil (IâU) base pair observed in the single IâU systems as a result of correlation between ...
Supplementary materials: Application and Validation of Activity ... - MDPI
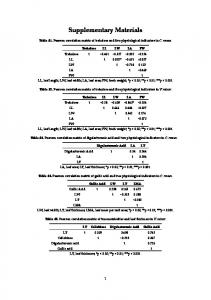
Supplementary materials: Application and Validation of Activity Monitors’ Epoch Lengths and Placement Sites for Physical Activity Assessment in Exergaming Table S1. Time spent on sedentary and physical activity intensity levels in epochs.
Troiano
Sedentary, min Light, min Moderate, min Vigorous, min
Sasaki
Sedentary, min Light, min Moderate, min Vigorous, min
Troiano
Sedentary, min Light, min Moderate, min Vigorous, min
Sasaki
Sedentary, min Light, min Moderate, min Vigorous, min
† indicates a non-significant difference (P > 0.05) between an epoch and the HR. whereas * denotes a significant difference (P < 0.001) between an epoch with the HR.
Table S3. Sedentary and physical activity levels between heart rate and activity counts in epochs with two activity cut-point sets and two activity monitors. Epoch Sasaki
† indicates a non-significant difference (P > 0.05) between an epoch and the HR. Whereas * denotes a significant difference (P < 0.001) between an epoch with the HR.