Supplementary Table 1. Ranking of these genes in total samples according to their stability value using NormFinder. Note: R: Rank; SV: Stability Value. ACT3.
123 A. J. Hughes and B. A. Biggs. Intern Med J, 32, 11, 541 .... 175 I. D. Robertson, et al. ... Zoonotic infections in communities of the James Bay Cree territory: An ...
Detailed list of the applied inclusion and exclusion criteria for 11 randomized clinical trials ..... Hypertension (SBP >190 mm Hg and/or DBP >100 mm Hg).
Page 1. Supplementary Table 1. Complete list of the top KEGG Pathways that overlapped significantly with the predicted Steiner Forest Network. Pathway name.
Supplementary Table 1: Primers used for qrT-PCr. Gene name. Forward primer 5â²-3â². Reverse primer 5â²-3â². ZEB1. GACAGTGTTACCAGGGAGGAGCA.
Supplementary Table 1. Pearson's correlation coefficients (r) between nonmetric multidimensional scaling ordination axes and species of Sebastes visually ...
Antiglycemic drugs (%). 230 (52%). 430 (63%). Patient characteristics at follow up of participants in the Danish arm of Anglo-Danish-Dutch. Study of Intensive ...
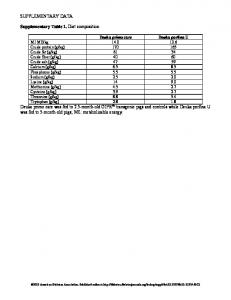
Deuka primo care was fed to 2.5-month-old GIPRdn transgenic pigs and controls while Deuka porfina U was fed to 5-month-old pigs; ME: metabolizable energy.
Elektra Papadopoulos. Food and Drug Administration. Indira Hills ... Jeremy Hobart. Plymouth Hospital. Adam Jacobs ... Gary Cutter. University of Alabama ...
Overall Signal/Curvefit Quality (High >70% of peptides fit on average across three models, Low < 50%. [fit defined as R2 > 0.8]). 631030521A1 Primary Tumor ...
Barcode Array
Experimental Variable
Overall Signal/Curvefit Quality (High >70% of peptides fit on average across three models, Low < 50%. [fit defined as R 2 > 0.8])
631030521A1 Primary Tumor
basal
High
631030521A2 Primary Tumor
20nM erlotinib
High
631030521A3 Primary Tumor
500nM erlotinib
High
631030521A4 Primary Tumor
20uM erlotinib
High
631030522A1 Primary Tumor
basal
High
631030522A2 Primary Tumor
20nM crizotinib
High
631030522A3 Primary Tumor
500nM crizotinib High
631030522A4 Primary Tumor
20uM crizotinib
Medium
631030523A1 Primary Tumor
basal
High
631030523A2 Primary Tumor
20nM lapatinib
High
631030523A3 Primary Tumor
500nM lapatinib
High
631030523A4 Primary Tumor
20uM lapatinib
High
Cell Description
631030701A1 Cultured Human Collection time 0 Low tissue 631030701A2 Cultured Human Collection time 1 Low tissue 631030701A3 Cultured Human Collection time 2 Medium tissue 631030701A4 Cultured Human Collection time 3 Low tissue 631030703A1 Cultured Human Collection time 0 Medium tissue 631030703A2 Cultured Human Collection time 1 Low tissue 631030703A3 Cultured Human Collection time 2 Medium tissue 631030703A4 Cultured Human Collection time 3 Low tissue 631030704A1 Cultured Human Collection time 0 Medium tissue 631030704A2 Cultured Human Collection time 1 Low tissue 631030704A3 Cultured Human Collection time 2 Medium tissue 631030704A4 Cultured Human Collection time 3 Low tissue 631207418A1 Primary Tumor
tumor1
Medium
631207418A2 Primary Tumor
tumor2
Medium
631207418A3 Primary Tumor
tumor3
Low
631207418A4 Primary Tumor
tumor4
Low
631207419A1 Primary Tumor
tumor5
Medium
631207419A2 Primary Tumor
tumor6
Low
631207419A3 Primary Tumor
tumor7
Medium
631207419A4 Primary Tumor
tumor8
Low
631207420A1 Primary Tumor
tumor9
Medium
631207420A2 Primary Tumor
tumor10
High
631207420A3 Primary Tumor
tumor11
Medium
631207420A4 Primary Tumor
tumor12
Low
Supplementary Table 1: List of the samples from which the global analysis was performed.
Supplementary Figure 1: Analysis of different methods of model filtering. Panel A shows the distribution of residual distance when selecting fits across all three purposed models for the 36 PTK experiments analyzed.