Support for Question-Answering in Interactive Information Retrieval: Rutgers’ TREC-9 Interactive Track Experience. N.J. Belkin, A. Keller, D. Kelly, J. Perez-Carballo, C. Sikora*, Y. Sun School of Communication, Information & Library Studies Rutgers University 4 Huntington Street New Brunswick NJ 08901-1071
[email protected] [amkeller | dianekel | carballo | ysun]@scils.rutgers.edu
[email protected] Abstract We compared two different interfaces to the InQuery IR system with respect to their support for the TREC-9 Interactive Track Question-Answering task. One interface presented search results as a ranked list of document titles (displayed ten at one time), with the text of one document (the first, or any selected one) displayed in a scrollable window. The other presented search results as a ranked series of scrollable windows of the texts of the retrieved documents, displayed six documents at a time, each document display beginning at the system-computed “best passage”. Our hypotheses were that: multiple-text, best passage display would have an overall advantage for question answering; single-text, multiple title display would have an advantage for the listoriented question types; and that multiple-text, best passage display would have an advantage for the comparison-oriented question types. The two interfaces were compared on effectiveness, usability and preference measures for sixteen subjects. Results were equivocal. 1
Introduction
The TREC-9 Interactive Track (IT) changed the searching task from the instance/aspectual recall task used in the previous three TRECs, to a question-answering task. This new task, although drawing upon the same database as that of the Question-Answering (Q-A) Track, differed substantially from the Q-A Track task, in that the questions that the subjects were to answer were designed to require more than one document in order to be correctly answered. Furthermore, questions were constructed as two types: one which asked for a list of items as an answer (e.g. what are three national parks in which one can find redwood trees?), the other which required comparison of items for an answer (e.g. is Denmark larger than Norway in population?). At Rutgers, we decided to investigate the support of people trying to answer questions of these two types through interface design. We supposed that an interface which allowed viewing of more than one document text at time would be beneficial for comparison-type questions, since that might make it easier for the searcher to make the necessary comparisons. We further supposed, based on our experience in supporting the instance recall task in previous IT experiments, that an interface which showed many possibly useful documents at once would be beneficial for the listing-type question, and that this could be accomplished through reasonably informative document surrogates, rather than the texts. Finally, we supposed that, in order to support question-answering in general, helping the person to get to the most relevant part of a document (i.e., where some part of the answer was likely to be located) would be beneficial. In
part, this idea is based on the approaches and results of the Q-A Track in previous TRECs, since performance was quite high for most systems when 250 bytes were retrieved. We translated these suppositions into interface designs, and related hypotheses, which could be investigated within the structure of the IT. For the first supposition, we used an interface which we had developed for the TREC-8 instance recall task, since that task shares a number of features in common with the listing-type question. We named this the SDD system (see section 3, below, for details of both systems implemented in this study, and Belkin, et al., 2000 for a description of our TREC-8 study). For the second supposition, we implemented an interface with the same functionality as the SDD system, but which displayed, in a scrollable “document display window”, six scrollable panes containing the texts of the six retrieved documents from the selected part of the retrieved document list. And in response to our third supposition, the document texts in this system, which we named MDD, were displayed beginning at the systemdetermined best passage, rather than at the beginning of the document, as in SDD. The hypotheses that we tested in this study were, thus: Hypothesis 1: MDD will support the comparison-type task better than SDD, where “better” is measured in terms of performance and effort. Hypothesis 2: SDD will support the listing-type task better than MDD (measured as in Hypothesis 1) Hypothesis 3: MDD will support the question-answering task overall (i.e. both tasks combined) better than SDD, where “better” is measured in terms of performance, effort, and user preference. 2
System descriptions
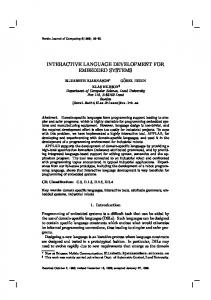
There were two experimental IR systems used in this study. Both systems used Inquery 3.1p1 with its default values for indexing and retrieval (cf. Callan, Croft & Harding, 1992). A SUN Ultra-1 with 512MB memory and 9GB disk under Solaris 2.5.1 with a 20” color monitor was used with both systems. The primary difference between the two systems involves the layout of the information associated with the documents retrieved. This difference results in disparities in the type and amount of information displayed, and associated interactions with that information. The first system, Single Document Display (SDD), presented the top ten document titles and the text of the first document. The text window displayed 32 lines of text and extended most of the width of the screen. The document text was positioned at the beginning of the document. Users could move quickly to the best passages in the text by using the “Show Best Passage,” “Show Next Best” and “Show Prev Best” buttons located next to the document text window. “Good” passages and their ranks with respect to one another were determined according to the InQuery 3.1p2 default values, with the length of passage set to 20 words. Clicking on a different title in the list provided the text of that document in the document window. Scrolling the title list provided new document titles. A document could be saved or unsaved by clicking on a toggle checkbox located to the right of each document title. The SDD interface is shown in Figure 1.
Figure 1: SDD system with final “Answer Window” displayed. The second system, Multiple Document Display (MDD), presented the title and text of the top six documents in a format consistent with that used by Golovchinsky and Chignell (1997). Two rows of three document windows were displayed across the entire width of the screen. Each document window displayed 21 lines of text under a title bar that displayed information about the document ID and a truncated document title. The document text is positioned such that the best passage is displayed at the top of the text window. Users could move to other good passages within the document by using the “Next Pass” and “Prev Pass” buttons located below each document window. Next to those buttons, there is also a button labeled “Top” to allow the user to jump to the beginning of the document text. Each text window had a scrollbar to move up and down throughout the text. A scrollbar at the side of the screen allows the user to view other documents. There is a button at the bottom of each text window to “Save” that document. The button changes to “Unsave” to allow users to change the status of the document. Figure 2 is a screenshot of the MDD interface.
Figure 2: MDD system with final “Answer Window” displayed. The interface features of both systems were similar and are described below: • •
• •
Query Terms Window – A window at the top of the application that was used to input a free-form query. It did allow for minimal structure (e.g., phrases). Good Terms to Add Window – A display window next to the “Query Terms” window provided suggested good terms to add to the query. The user could click on a term to add to the query window for the next search iteration. These terms were determined using pseudorelevance feedback, based on the first ten documents displayed, and using the default relevance feedback formula for InQuery 3.1p2. The top ten relevance feedback terms were then entered into this window. Pop-Up Answer Window – A dialog box that appeared when a document was saved that required the user to label the saved document with the portion of the answer that it represented. Documents Saved Window – A display window at the bottom of the screen that provided a list of the document titles of the saved documents. Clicking on the title displayed the document text. The user could unsave the document by clicking on the check box located to the right of each saved document title.
• • • • •
•
3
Document Label Window – A display window to the right of the “Documents Saved” window that displays the label associated with each saved document. To edit the label the user clicks on the label. Search Button – A button used to initiate the search based on the terms in the “Query Terms” window, which generated the documents retrieved. Clear Query Button – A button used to remove all of the terms in the “Query Terms” window. Exit Button – A button used to end the search session. Final Answer Window – A dialog box was presented at the end of the search to allow users to type in their final answer. The window also presented the search question, the saved documents and the associated labels for those documents. The user was allowed to click on the titles to see the text. Stop Search Window – A window that covered the entire screen at the end of five minutes alerting the user that the time was up. Methods
We followed strictly the TREC-9 Interactive Track protocol for this experiment (see Over & Hersh, this volume, for a complete description of the experimental design). This protocol required a minimum of 16 subjects, each of whom searched the same database in order to answer four questions using one system, and then another four questions using the other system. Questions (also called topics) were divided into two categories: listing-type questions (topics numbered 1-4), and comparison-type questions (topics numbered 5-8). A total of 16 volunteer subjects, recruited informally by the experimenters, participated in this project. A majority (81%) of the subjects either held, or were expecting, graduate-level degrees from varying disciplines such as law, library studies, and women's studies. The remaining participants had obtained a bachelor's degree and were employed in fields from librarianship to civil engineering. None had taken part in previous TREC studies. Each subject conducted eight searches in accordance with the TREC-9 Interactive Track experimental guidelines. Subjects conducted four searches in both the MDD and SDD systems. We used a Latin square design where eight topics were randomized and rotated completely so that each topic appeared only once in each row and once in each column. The same set of topics was rotated again with a different system order, in order to allow a direct comparison between two different systems. Sixteen different combinations of topic order and system order were used allowing us to run experiments with 16 subjects. On arrival, the subjects read and signed a consent form explaining their rights and potential risks associated with participation in the experiment. They then completed a demographic questionnaire that gathered background information and probed their previous searching experience. Next, they received a hands-on tutorial for the first system, describing the various features of that system. After completing the tutorial, subjects were given a general task description and were told that they would have five minutes in which to execute each search, and that they would be warned by the experimenter when only one minute of search time remained. Before each question, participants were asked to provide an answer to the question, if they thought they knew it, and to indicate their degree of confidence in the answer. After five minutes, the system prompted the subjects to answer the question. As they searched, participants
labeled aspects of answers to the questions as they identified them and saved documents. During the search sessions, they were asked to continuously "think aloud." A videotape recorded the computer monitor during both the tutorial and search portions of the experiment in order to capture all "thinking aloud" utterances. The entire session, of tutorial and searches, was logged. After conducting each search, subjects answered several questions about their familiarity with the search topic, experiences with the searching task, their satisfaction with the search result, and satisfaction with the amount of time allotted for the search. After completing four searches for the first system, subjects answered several questions about the system in general. After a short break, the subjects were given a tutorial for the second system, searched another four topics, a pre-search evaluation and post-search questionnaire for each topic, and a post-system questionnaire. After completing all eight searches, the subjects completed an exit interview. The entire session took between 2 and 2 1/2 hours. As mentioned above, most (81%) of the subjects either currently held or expected to receive graduate degrees, and the rest held bachelors degrees and were employed in various areas of the work force. Slightly more than half (56%) of the subjects were male. The average age of the subjects was 37. Half (50%) stated their primary occupation as student. On average, these searchers had been doing online searching for just over five years (M=5.56). We asked a series of questions about the background experiences of our searchers, using a 5 point scale, wherein 1=no experience and 5=a great deal of experience. Overall, the searchers were quite familiar with the use of GUIs (M=4.88) and with Web search engines (M=4.56). A majority reported having had some experience with OPACs (M=4.19) and with searching on CD ROM systems (M=3.3). Of note is that experience searching on commercial online systems in general was reported to be fairly low for our subjects (M=2.6), and experience searching on systems other than the Web was markedly low (M=1.6). On a final note, the searchers in our study tended to say that they enjoyed conducting information searches (M=4.2) as measured by a 5 point scale wherein 1=strongly disagree and 5=strongly agree. 4 4.1
Results General
The two systems were compared according the three criteria: performance, effort (a measure of usability), and preference. Performance was measured on a binary scale: if the question was both completely answered, and correctly supported, then the answer was correct; otherwise, the answer was incorrect. Effort was measured in a variety of ways, including search time, number of cycles per search, and various measures indicating amount of interaction. Preference was measured by questions eliciting subject evaluation of the two systems. The results of the experiment are presented in the following sections, arranged according to each of our three hypotheses. The overall data on correct answers, by subject, topic and system, are shown in Table 1. Seven of our subjects answered four of the eight questions correctly; two answered three correctly; four had two correct answers; two had one correct answer, and one had no correct answers. Three topics, numbers 1, 3 and 6, had no correct answers, and of these, two were of the list-type. These three could be termed “hard” questions for our searchers. Topic 5 had thirteen correct answers
and topic 7 fourteen: these were “easy” questions for our searchers. Overall, each system provided the same number of correct answers. Topics 2, 4 and 8 were, by this system, “moderately difficult”. SUBJECT NO. 1
1
2 SDD
3
TOPIC NO. 4 5 MDD
6
7 MDD
8 MDD
MDD
TOTAL S=1 M=3 S=2 M=2 S=1 M=3 M=1
SDD
SDD
S=1 M=1 S=2
MDD
SDD
2
MDD
SDD
SDD
MDD
3
SDD
MDD
MDD
MDD
4 5
MDD
SDD
6 7
MDD
8
S=1 M=2 S=1
SDD
9
0
10
SDD
SDD
MDD
MDD
11
SDD
MDD
SDD
SDD
MDD
SDD
12 13
SDD
SDD
MDD
SDD
14
SDD
SDD
MDD
MDD
15
SDD
MDD
16
SDD
MDD
TOTALS
0
S=5 M=1
0
S=4 M=3
S=6 M=7
0
S=7 M=7
MDD
S=0 M=4
Table 1. Correct answers by each subject, for each topic, indicating system used.
S=2 M=2 S=3 M=1 S=1 M=1 S=3 M=1 S=2 M=2 S=1 M=2 S=1 M=1 S=22 M=22
4.2
Hypothesis 1: MDD supports the Comparison-type task better than SDD
4.2.1 Performance Performance on the comparison-type task was measured by number of correct, fully supported responses to topics 5-8. The means and standard deviations for these performance measures are displayed in Table 2. For all 16 subjects, the mean number of correct fully supported responses for the two systems was close (MDD: M = 1.13, SD=1.02; SDD: M=.88, SD=.72). The difference was not significant [t(15) = .66, ns]. For the 7 high performers (defined as those subjects who got at least a total of 4 correct, fully supported responses), the mean number correct on topics 5-8 for MDD system was nearly twice the number for SDD system (MDD: M = 1.71, SD= 1.11; SDD: M = .86, SD=.90). However with a size of 7 cases, the difference was not significant [t(6) = 1.16, ns ]. For the 9 low performers (subjects with at most 3 correct fully supported responses of the total 8 questions), the means were similar and the difference was not significant [MDD: M = .67, SD=.71; SDD: M = .89, SD=.60; t(8) = -.69, ns]. All the nonsignificant differences suggest that the effectiveness of the two systems for the comparison-type task is similar. There was no system order effect for these results.
All subjects (N=16) High performers (N=7) Low performers (N = 9)
TOTAL M (SD) 1.01(.87) 1.29(1.01) .78(.66)
MDD M(SD) 1.13(1.02) 1.71(1.11) .67(.71)
SDD M(SD) .88(.72) .86(.90) .89(.60)
Table 2. Means and Standard Deviations of Comparison-type Task Performance 4.2.2 Effort Effort was measured by searching time, number of cycles, and effort associated with interacting with the two systems for each comparison-type question. For the comparison-type task (topics 5-8), the number of cycles in a search was roughly the same for the two systems (MDD: M = 2.16, SD=1.08; SDD: M = 2.66, SD=1.62). The difference is not significant [t(62)=.15, ns]. The average time used in a single search for the two systems was close (MDD: M=300.97 seconds, SD=123.84; SDD: M=326.97 seconds, SD=93.43). The difference was not significant [t(62)=-.95, ns]. The effort associated with interacting with the two systems was different as measured by scrolling behavior and use of the document navigation facilities (Next Passage, Best Passage and Top of Document). The difference between systems was significant for the number of times subjects used the scrolling feature in each of the systems [MDD: M=102.59, SD=175.22; SDD: M=32.63, SD=42.46; t(62)=2.20, p