Support Vector Machine and Spiking Neural Networks for Data Driven prediction of crowd character movement. Israel Tabarez-Paz1, Isaac Rudomin1 and Hugo ...
Support Vector Machine and Spiking Neural Networks for Data Driven prediction of crowd character movement Israel Tabarez-Paz1 , Isaac Rudomin1 and Hugo P´erez1 1
Barcelona Super Computing Centre israeltabarez, rudomin.isaac, vhpvmx @gmail.com
Abstract Microscopic crowd simulation usually uses ad-hoc models. While these have been proven to be useful, they are difficult to calibrate and do not always reflect real behaviour. For this reason we propose a machine learning approach using neural networks. The main contribution of the project is a first exploration of prediction of agent trajectories using two specific types of neural networks, Support Vector Machine (SVM) and Spiking Neural Networks (SNN).
Introduction Developing a computing model for simulating the behaviour of large groups allows us to study the movement of people and improve buildings, plan logistics in health, retail and other services, or even void traffic jams. Also, these models allow us to reduce risks during natural disasters and medical emergencies. There are two ways in which crowd simulation is usually carried out: macroscopic and microscopic Rivas et al. (2014). Macroscopic simulation describes global interactions with the environment and the crowd itself. In contrast, microscopic simulation exposes the interactions between individuals within a group; each agent is processed individually to simulate a crowd. In particular, AgentBased Models (ABM) simulate the actions and interactions of autonomous agents that generate global-scale behaviours Bonabeau (2002). One of the behaviors of such autonomous agents is to decide where each will move next based on their perception of their environment. For this purpose, the usual methods in microscopic crowd simulation are ad-hoc models such as steering rules, social forces, geometric methods such as ORCA or even approaches based on synthetic vision. All these have been proven to be useful, but they are difficult to calibrate to reflect real behaviour. For this reason we propose using real data and a machine learning approach. We will be using trained neural networks to make decisions as to what the next step a simulated agent should take, in effect using a prediction of their trajectories. In the following sections we explore some background: crowd behavior models and artificial neural networks (in particular spiking
neural networks, SNN, and support vector machine, SVM, which are the ones we will use). On the other hand, in previous work we have proved the efficiency of third generation neural networks (SNN and SVM) over other Artificial Neural Networks (ANN) in order to solve classification problems for separable and non separable data. In fact the processing speed for training and execution is better when these methods are parallelized, Paz et al. (2014). This is the main reason why in that article we selected both methods for use in classification. Now, the most popular methods used for obstacle avoidance and to predict trajectories have been tried by Huang et al. (2016) and Abbeel et al. (2008); the evaluation of local costs is considered in these papers to get the less computationally expensive trajectory A∗. Natural movement of crowds cannot always be obtained by simply evaluating costs locally, although for single agents it could work. Real people can see further than what we can cheaply evaluate at during simulation. This represents the main advantage of using real data to train ANNs instead of locally evaluating ad-hoc models. Our main contribution is to show that we obtain trajectories that avoid obstacles and produce what seems to be a more natural movement by using a prediction system that applies third generation neural networks to characters in crowds and to individuals. That is, a method that can use the knowledge embedded in the trajectories followed by real people, that is not explicitly present when taking decisions by evaluating costs locally. In the rest of this paper we will explore trajectory prediction, perform some experiments, obtain some results and come to some conclusions.
Background Reynolds (1987) proposed three basic rules for the behavior of members of crowds, which are: separation, alignment, and cohesion. These remarkably simple rules maintain together a group of boids, give them a direction of movement and keep them free of collisions. Another important approach is social forces Helbing and Molnar (1995), where agent behavior is based on a collection of forces,
DOI: http://dx.doi.org/10.7551/ 978-0-262-33936-0-ch102
called social forces. These can be attraction or repulsion. In its simplest form, a pedestrian can use these forces to get to its destination and avoid obstacles or other pedestrians. In predictive/Velocity-based models Paris et al. (2007), agents calculate the velocities necessary to avoid collisions. Within these velocities they can choose how to move to their goal avoiding collisions. This concept is expanded by Van Den Berg et al. (2011); van den Berg et al. (2008), who introduce the notions of Velocity Obstacles (VO) and Reciprocal Velocity Obstacles (RVO) and the notion of Optimal Reciprocal Collision Avoidance (ORCA). Lastly, synthetic vision Ondˇrej et al. (2010); Moussa¨ıd et al. (2011) is based on using visual information obtained from the perception of the environment to get a safe trajectory to the agents goal without collision. All these models predict individual trajectories and collective patterns of motion and can have a relatively good quantitative agreement with a large variety of empirical and experimental data. A deep study of this topic is beyond the scope of this section, thus we recommend our previous work Rivalcoba and Ruiz (2013). In previous work Rivas et al. (2014) a group of real people were coupled with virtual humans to get a plausible reaction to real people. The simulation of virtual humans was based on social forces. However, in this paper we want the agents to exhibit behavior learned from real examples, since this should lead to a more natural behavior without the tedious process of hand calibration of rules or forces. There is some work in this direction, for example Rodriguez et al. (2011) presents a crowd analysis algorithm by using behavior priors that are learned from a database of crowd videos gathered from the Internet. The algorithm learned a set of crowd behaviour priors off-line. Behaviour is compared in order to validate their data-driven crowd model. One strategy to reduce the complexity is looking in a local space. They adopt a linear Kalman filter to evaluate tracking. Error of trajectory is presented, however it is important to know the efficiency of used method, which is not discussed. Wang et al. (2016) proposes a new approach based on finding path patterns in both real and simulated data in order to analyse and compare them, by using unsupervised clustering by non-parametric Bayesian inference. They offer to take both the global and local properties of crowd motion into account for analysis of the data. In this case, author considered three parameters, state of the agents (position and orientation), state of space, a probability over the path and pattern path. They simulate 64 agents with obstacles and one important contribution is that they got several patterns of path crowds in some environments. However, their method does not directly measure individual trajectories thus does not reflect individual visual similarities. In our case, we will measure individual trajectories and measure collisions with speed, direction, goal and occupation. We believe that ANN is a less complex method and can achieve good results.
Sujeong Kim and Manocha (2016) presents an algorithm that combines realistic trajectory behaviors from videos for simulations statistical techniques to compute movement patterns and motion dynamics from noisy 2D trajectories extracted from crowd videos in order to generate realistic crowd movements performing tasks. The main limitation in this approach is that it may not work well if the layout of the obstacles in the virtual environment is different from captured in the original video. Sujeong Kim and Manocha (2015) applies interactive techniques for analyzing crowd videos combining online tracking algorithms from computer vision, non-linear pedestrian motion models from computer graphics, and machine learning techniques. Also, they use Bayesian inferencing technique to compute the trajectory behavior feature for each agent. In this case they do not require learning a dataset. Lee et al. (2007) is focused on learning an agent model that controls the motion of each agent in a crowd, what is based on a locally weighted linear regression. Their model can be learned to imitate the rule-based flocking or insects. Also, they uses attraction to keeps the local formation of agents.
Artificial Neural Networks An Artificial Neural network is a system composed of simplified abstractions of neurons that are used to solve computational problems by imitating the way neurons are fired or activated in the brain, in which many neurons work in parallel to produce a result. There are three ways a neural network can learn: Supervised learning, Unsupervised learning and Reinforcement learning. These methods all work by either minimizing or maximizing a cost function, but differ on the way this cost function is defined. In supervised learning, example inputs and the correct output are used to train the network. Unsupervised learning only uses inputs, and the network figures out relationships or categories. A reinforcement learning neural network learns from examples of actions and by evaluating their cost and assigning rewards and penalties. Throughout their development, ANN’s have been evolving towards more powerful and more biologically realistic models. In the last decade, the third generation Spiking Neural Networks (SNN’s) have been developed which comprise of spiking neurons. Information transfer in these neurons models the information transfer in biological neurons, i.e., via the precise timing of spikes or a sequence of spikes. Addition of the temporal dimension for information encoding in SNNs yields new insight into the dynamics of the human brain and has the potential to result in compact representations of large neural networks. As such, SNN’s have great potential for solving complicated timedependent pattern recognition problems defined by time series because of their inherent dynamic representation. The two important methods that we considered to predict the trajectory are Spiking Neural Networks (SNN), mentioned above, and Support Vector Machines (SVM). In both cases
DOI: http://dx.doi.org/10.7551/ 978-0-262-33936-0-ch102
they are highly parallelizable by using GPUs, Tabarez-Paz et al. (2013).
Comparison between SNN and SVM Respect to advantages of SVM, it finds the Global Minimum Value, while ANN finds the Local Minimum Value for separable and non-separable data Burges (1998), Cortes and Vapnik (1995). The V C dimension of SVM is infinite, however its computational complexity is high. According to Yang et al. (2009) SVM has O(n3) computational complexity and O(n2) memory complexity in the training phase, where n is the training size. Furthermore, the number of support vectors, that is equal to quantity of neurons in the hidden layer, and it grows linearly with n and the computational complexity is O(n), where the kernels are given by the training inputs Horvath (2003). This implies a limitation for real-world applications, whose training size is typically far beyond thousands. However, the complexity of the network architecture is independent of the dimension of the hyperplane. Although back-propagation converges to the Minimum Local Value, the solution is related to the number of hidden layers and number of neurons in the hidden layers. For Suykens et al. (2002), SVM solutions are characterized by convex optimization problems, up to the determination of a few additional tuning parameters. In contrast, SNN for discontinuous time, its computational complexity depends on discrete time t(n), the time complexity is O(t(n), where n is the discrete time. In the case of continuous time, the computational complexity is logarithmic as is highlighted by Maass (1995) in theorem 1. Theorem 1 The VC-dimension and pseudo-dimension of any SNN N with piecewise linear response-and thresholdfunctions, arbitrary real-valued parameters and timedependent weights can be bounded (even for real valued inputs and outputs) by O(|E| · |W |.S(log|V | + logS)) if N uses in each computation at most S spikes where V is the number of neurons, S is the number of synaptic connections, and V C − dimension is for computations with up to S spikes as large as Ω(|E| · S) In the training process data needs to be codified in the time dimension, Ghosh-Dastidar and Adeli (2009), so it does not depend on whether the database has one or more types of data (multiclass). Nevertheless, there are many applications that have used SVMs, such as classification database, prediction, pattern recognition and regression. Performance for SVMs is better than typical ANNs in large databases for separable and non-separable data. There are important differences between these typical ANNs and SVM:
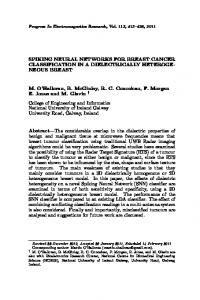
General view of our approach This work focuses on the decision making process of virtual agents that must pick a position to go to. These agents will consider their situation and use a trained ANN to predict this next position. The learning process uses data obtained from trajectories of real pedestrians, extracted from video. From these trajectories, the 2D positions of all pedestrians of the crowd in any given frame are obtained, and from them we obtained what we call an occupation code, in other words, the trajectory database provides specific information related to the position of each person in a given frame. From this data we know the next position of each person and all people nearby. In this way we obtain the occupation code of each agent in each frame. With this data, and given an objective and a position we train an ANN that is then used for simulation. The simulator uses OpenGL and CUDA 7.0 and was tested in a workstation containing both a Tesla K40c and a GeForce GTX TITAN. The main parameters that we must take into account is the position and velocity of the nearby pedestrians, how near these pedestrians are, the final objective, and the density of the crowd. Our main motivation is getting a trajectory that is more natural in a crowd simulation by using the trained neural network to predict the next step of each character instead of evaluating costs by using only local information. The trajectories were obtained from third person top view videos of the crowd such as those available in Lerner et al. (2009). These consist of control points of Catmull Rom splines of said trajectories. A block diagram of the system can be seen in figure 1. In other words, Catmull Rom splines representing trajectories are obtained from the data collection and their control points ordered according to frame number. Since not all characters have control points that appear in the same frame, in order to get the occupation code for all agents, we have to interpolate the position of all the agents for all the frames. After that, we obtain a large table that contains position, direction, speed, frame, sense and goal. Finally, in another algorithm we apply the data calculated in the interpolation to compute the occupation code for each agent. However, repetitive occupation codes are obtained and the table must be simplified. Finally this data will be used to train the ANN.
Simulating crowd behaviour using Artificial Neural Networks We have chosen to use SNN’s due to their characteristics for training multiclass data with various attributes per instance as well as for its acceptable efficiency, although we also considered SVM for prediction in order to compare SVM results. We highlighted the term Multiclass for a database if data can be classified in more than one type according to a common characteristic. For example in Weka3, there is a free database that can be downloaded in order to test some classification algorithms for prediction or clustering, an Iris
DOI: http://dx.doi.org/10.7551/ 978-0-262-33936-0-ch102
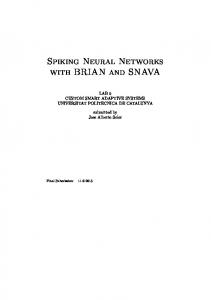
Figure 1: Block Diagram of System. data set is classified in three categories of flowers because of some common physical characteristics Bifet et al. (2015). In our case, we have seven classes that are the seven directions of the agents and our dataset is the occupation code, with a size proportional to the variety of the cases collected from the trajectories in the videos. This data depends on some variables such as the speed of the agent, the distribution of other agents in the viewing area, and the density of the crowd. As mentioned above, we use trajectories obtained from videos of pedestrians in a crowd, and we interpolate the data to get positions per frame of all agents, and from these calculate the direction of movement of the agents in the previous and following frames, as well as their speed. The process consists of codifying the occupation patterns around each element in the crowd. The videos and trajectories are those used by Lerner et al. (2009) and can be seen in figure 2.
First experiment: Results using SNN In our first experiment we used a set consisting of the occupation code and the goal of every agent as a row in the input matrix (M ) of the SNN. After that, the output of the ANN is the decision that was taken for the next step of the pedestrian. The occupation code was computed using a radius of agent and an angle of view divided in seven sectors, as can be seen in figure 3, each of which represents one bit of the occupation code. We define the radius of view as the maximal distance that will be explored in order to decide that a sector of circle of the respective bit is occupied. The set of seven bits form an occupation pattern. If there is a pedestrian is in this sector, then the sector is occupied and the bit is one but if the sector is empty the bit is zero, such as in figure figure 4. Results of this experiment using SNN with the codification explained above is presented in figure 5, so we can check two simulation tests: in the first one (Test 1), agents start all at random positions the same line at the bottom, and have as their goal a single point in the top: we see their trace from start to finish. In (Test 2) the other tests all agents lie on a circle, and each has as its goal the point exactly on the opposing side of the circle, usually called circle test. Both simulations used 100 agents, and by the time the agents had
reached their goal Test 1 had 396 and Test 2 had 72 collisions, respectively; most of thee collisions were concentrated in a very few agents. We performed other testing; 100 agents whose position is divided into the four sides of a square that (Test 3). Initially they are randomly distributed on the four sides of a square, and have a randomly assigned goal on the line opposite to their initial position. In (Test 4) agents are initially distributed on a grid. In each case the goal has the same x coordinate but the y coordinate is on the opposite side. Test 3 had 17 collisions and Test 4 had 0 collisions. In order to take the distance of collision into account and to reduce this average improving precision, we tried using a different coding using three radii, as is described in the next section.
Second experiment: Results using SNN and SVM After obtaining the first results we observed that the simulated characters detected collisions and avoided them but that their reaction was not very natural: in particular when crowd density increases. We therefore proceeded to use an expanded coding which consists of dividing the sectors by three different arcs, with three different radius , as we can see in figure 6, still dividing each arc in seven sectors. To code we took into account the distance from the center of the semicircle to the agent in the three radii, i.e. the number of bits, where it had 1, this number is replaced by its distance from the centre with three options, so, the number 1 will replaced by 2 if its distance is between 34 Radius and Radius; or will be replaced by 1 if its distance is between 3 2 4 and 4 Radius; or will be replaced by 0 if its distance is between 0 and 14 Radius, such as in figure 6. This code represents the empty spaces, or steps, that agents could move toward its goal according to the predicted step. Additionally we controlled the rotation per agent. In other words, after getting the predicted step, the agent rotates toward the goal. Also, agent speed is coded using the seven digits, for example if the speed of nearest intruder is bigger than that of the main agent, that speed bit will be 3 and the agent can consider that space as empty for the next step; also if the speed of nearest intruder is the same that of the main agent, that speed bit will be 2 and also this space could be considered empty; but if the speed of nearest intruder is smaller than that of the main agent, then that speed bit will be 1 and the agent could not consider that empty for the next step. Once the SNN has been trained the simulation is carried out as explained before: given an occupation pattern of the agents and the objective vector the next position is determined by the output of the trained neural net. In case of some sector being occupied but with velocity component greater or equal in the direction of that of the agent being analysed, the sector is considered empty, figure 7 .
DOI: http://dx.doi.org/10.7551/ 978-0-262-33936-0-ch102
Figure 2: Images from sample videos. Trajectories derived from these videos were used as input data.
Figure 3: Proposal 1: Codifying the occupation pattern.
Figure 6: Codifying with three radii
Figure 4: Test 1: A, B
Figure 7: Proposal 2: Cases of codifying. Figure 5: Test 1, 2
DOI: http://dx.doi.org/10.7551/ 978-0-262-33936-0-ch102
Figure 8: Test 5, 6
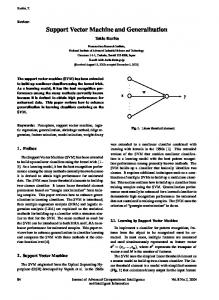
Figure 9: Test 9, 10 SVM: Finishing in the opposite goal with 100 agents Second experiment: Results using SNN In the following paragraphs we present some results of experiments made with SNN using the second approach. In figure 8, test 5, agents start in the opposite place of the goal, with 27 collisions and deviation standard of 0.93; in test 6 the circle test was tried with 49 collisions with deviation standard of 1.6. That means that the most of agents not contributed with collision. We used 100 agents with SNN. We conducted other tests: (Test 7) is like Test 3, and Test 8 is like Test 4. In this case we had only 4 and 0 collisions respectively. With respect to precision, this was not better than first approach, but most of agents got less than 1 unit of distance to the goal and there were fewer collisions. We got better results with this approach than the first. So, it is important to compare with SVM with this approach, as shown in the next section. Second experiment: Results using SVM The same experiments were tested, using this second coding approach, but using SVM to test the advantages or disadvantages of SVM respect to SNN, such as the ability to find the global minimal value and faster execution of prediction. In Figure 9 respect to collisions we got 227, with 227 agents, and the test circle 10 we got 779, with 100 agents. And the standard deviation was 8.79 and 15.16, respectively, significantly higher than with SNN. Probably we could get better results with other methodologies derived from SVM such us SVM light or SMO Joachims (1999). This means that collisions per agent are more with SVMs than with SNNs.
We also conducted (Test 11) analogous to Test3 and Test 12) analogous to Test 4 Collisions measured were 29 with a standard deviation of 0.52 and 157 collisions with a standard deviation of 1.02, respectively. In figure 10 we see an example of our simulation using our visualization system for diverse animated crowds where by combining geometry from different characters and using shaders, we generate varied characters using few assets. Also, different discrete levels of detail are used to allow the system to render crowds composed up to a quarter million characters. We suggest as a reference, Hierarchical level of detail for varied animated crowds Hern´andez and Rudomin (2011). Likewise, techniques for generating many varied and animatable characters for crowdswith reduced memory requirements, and where the use of a texture space techniques allows painless animation transfer between different characters and for different levels of detail Ruiz et al. (2013). Simulation speed of SVM is better than for SNN. Distance to the goal from the final position reached in simulation is also less with SVM than with SNN. But the trajectories obtained with SNN were better in avoiding obstacles and seemed to give a more natural-looking behaviour of the agents. Also, as we can see in previous work Paz et al. (2013), with respect to training time, SVM is faster than SNN. However, training is still much slower than simulation, so the design of an algorithm that learns faster, or even in real time, requires parallelization of training.
Conclusions According to experiments, SNN has better performance for behavior of crowds than SVM at predicting trajectories, in the statistics, SNN got its best results in the second approach achieving significantly fewer collisions. On the other hand, all agents arrived to their goal with SVM, while the distance to the goal with SNN was less than 1 in most cases, so it is still possible to achieve better speed and precision with SNN in future work. Since our model takes into account those limitations by allowing only decisions included in the trajectories contained in our database Lerner et al. (2009), which consists basically of moving characters avoiding each other, this implies that our model works rather well in that characters avoid collisions while getting to the goals. However we did not consider large static obstacles, and in preliminary testing, as expected, the system as presented has limitations in this case. Another limitation is that precision depends on efficiency of the ANN used; in Sujeong Kim and Manocha (2015) experiments do not work with very dense crowds, and in our case we have only tried up to 255 agents. Finally, some advantages of simulating with ANN are that carrying out mathematical computations, using any physical or mechanical data , or guessing what were the appropriate parameter settings was not necessary. However the method has results that depend very strongly on the trajectory data
DOI: http://dx.doi.org/10.7551/ 978-0-262-33936-0-ch102
Figure 10: Simulation a), b) Circle Test SNN, c), d)Test SVM finishing in the opposite goal objetive with 100 agents. used fort training, and it should be possible to get more natural movement if the database is larger and contains more non repetitive cases. With respect to behaviour shown in the test, we can see that the trajectories have more natural shapes and form geometric patterns that look like those of real crowds. As future work, it is important to compare this methodology with the common ad-hoc methods and to train for tests that include large obstacles.
References Abbeel, P., Dolgov, D., Ng, A. Y., and Thrun, S. (2008). Apprenticeship learning for motion planning with application to parking lot navigation. In Intelligent Robots and Systems, 2008. IROS 2008. IEEE/RSJ International Conference on, pages 1083–1090. IEEE. Bifet, A., de Francisci Morales, G., Read, J., Holmes, G., and Pfahringer, B. (2015). Efficient online evaluation of big data stream classifiers. In Proc 21st ACM SIGKDD International Conference on Knowledge Discovery and Data Mining, pages 59–68. ACM. Bonabeau, E. (2002). Agent-based modeling: Methods and techniques for simulating human systems. Proceedings of the National Academy of Sciences, 99(suppl 3):7280–7287. Burges, C. J. (1998). A tutorial on support vector machines for pattern recognition. Data mining and knowledge discovery, 2(2):121–167.
Helbing, D. and Molnar, P. (1995). Social force model for pedestrian dynamics. Physical review E, 51(5):4282. Hern´andez, B. and Rudomin, I. (2011). A rendering pipeline for real-time crowds. GPU Pro, 2:369–383. Horvath, G. (2003). Cmac neural network as an svm with b-spline kernel functions. In Instrumentation and Measurement Technology Conference, 2003. IMTC’03. Proceedings of the 20th IEEE, volume 2, pages 1108– 1113. IEEE. Huang, S., Li, X., Zhang, Z., He, Z., Wu, F., Liu, W., Tang, J., and Zhuang, Y. (2016). Deep learning driven visual path prediction from a single image. arXiv preprint arXiv:1601.07265. Joachims, T. (1999). Svmlight: Support vector machine. SVM-Light Support Vector Machine http://svmlight. joachims. org/, University of Dortmund, 19(4). Lee, K. H., Choi, M. G., Hong, Q., and Lee, J. (2007). Group behavior from video: a data-driven approach to crowd simulation. In Proceedings of the 2007 ACM SIGGRAPH/Eurographics symposium on Computer animation, pages 109–118. Eurographics Association. Lerner, A., Fitusi, E., Chrysanthou, Y., and Cohen-Or, D. (2009). Fitting behaviors to pedestrian simulations. In Proceedings of the 2009 ACM SIGGRAPH/Eurographics Symposium on Computer Animation, pages 199–208. ACM.
Cortes, C. and Vapnik, V. (1995). Support-vector networks. Machine learning, 20(3):273–297.
Maass, W. (1995). On the computational complexity of networks of spiking neurons. Advances in neural information processing systems, pages 183–190.
Ghosh-Dastidar, S. and Adeli, H. (2009). A new supervised learning algorithm for multiple spiking neural networks with application in epilepsy and seizure detection. Neural Networks, 22(10):1419–1431.
Moussa¨ıd, M., Helbing, D., and Theraulaz, G. (2011). How simple rules determine pedestrian behavior and crowd disasters. Proceedings of the National Academy of Sciences, 108(17):6884–6888.
DOI: http://dx.doi.org/10.7551/ 978-0-262-33936-0-ch102
Ondˇrej, J., Pettr´e, J., Olivier, A.-H., and Donikian, S. (2010). A synthetic-vision based steering approach for crowd simulation. In ACM Transactions on Graphics (TOG), volume 29, page 123. ACM.
Tabarez-Paz, I., Hern´andez-Gress, N., and Mendoza, M. G. (2013). A survey of spiking neural networks and support vector machine performance byusinggpu’s. International Journal on Soft Computing, 4(3):1.
Paris, S., Pettr´e, J., and Donikian, S. (2007). Pedestrian reactive navigation for crowd simulation: a predictive approach. In Computer Graphics Forum, volume 26, pages 665–674. Wiley Online Library.
Van Den Berg, J., Guy, S. J., Lin, M., and Manocha, D. (2011). Reciprocal n-body collision avoidance. In Robotics research, pages 3–19. Springer.
Paz, I. T., Gress, N. H., and Mendoza, M. G. (2013). Pattern recognition with spiking neural networks. In Advances in Soft Computing and Its Applications, pages 279–288. Springer. Paz, I. T., Gress, N. H., and Mendoza, M. G. (2014). Classification of database by using parallelization of algorithms third generation in a gpu. In Engineering Applications of Neural Networks, pages 25–38. Springer. Reynolds, C. W. (1987). Flocks, herds and schools: A distributed behavioral model. In ACM SIGGRAPH computer graphics, volume 21, pages 25–34. ACM. Rivalcoba, I. and Ruiz, S. (2013). Gpu generation of large varied animated crowds. Computaci´on y Sistemas, 17(3):365–380.
van den Berg, J., Patil, S., Sewall, J., Manocha, D., and Lin, M. (2008). Interactive navigation of multiple agents in crowded environments. In Proceedings of the 2008 symposium on Interactive 3D graphics and games, pages 139–147. ACM. Wang, H., Ondˇrej, J., and O’Sullivan, C. (2016). Path patterns: Analyzing and comparing real and simulated crowds. In Proceedings of the 20th ACM SIGGRAPH Symposium on Interactive 3D Graphics and Games, I3D ’16, pages 49–57, New York, NY, USA. ACM. Yang, J., Yu, K., Gong, Y., and Huang, T. (2009). Linear spatial pyramid matching using sparse coding for image classification. In Computer Vision and Pattern Recognition, 2009. CVPR 2009. IEEE Conference on, pages 1794–1801. IEEE.
Rivas, J. I. R., De Gyves, O., Rudomin, I., and Pelechano, N. (2014). Coupling camera-tracked humans with a simulated virtual crowd. In Computer Graphics Theory and Applications (GRAPP), 2014 International Conference on, pages 1–10. IEEE. Rodriguez, M., Sivic, J., Laptev, I., and Audibert, J.-Y. (2011). Data-driven crowd analysis in videos. In Computer Vision (ICCV), 2011 IEEE International Conference on, pages 1235–1242. IEEE. Ruiz, S., Hern´andez, B., Alvarado, A., and Rudom´ın, I. (2013). Reducing memory requirements for diverse animated crowds. In Proceedings of Motion on Games, pages 77–86. ACM. Sujeong Kim, A. B. and Manocha, D. (2015). Interactive crowd content generation and analysis using trajectorylevel behavior learning. In Proceedings of IEEE International Symposium on Multimedia. IEEE. Sujeong Kim, Aniket Bera, A. B. R. C. and Manocha, D. (2016). Interactive and adaptive data-driven crowd simulation. In Proceedings of VR. IEEE. Suykens, J. A., Van Gestel, T., De Brabanter, J., De Moor, B., Vandewalle, J., Suykens, J., and Van Gestel, T. (2002). Least squares support vector machines, volume 4. World Scientific.
DOI: http://dx.doi.org/10.7551/ 978-0-262-33936-0-ch102