Euglenoids. Glaucocystis nostochinearum. Glaucocystophyceae. Guillardia theta. Cryptomonads. Hartmannella vermiformis. Amoebozoa. Heterocapsa triquetra.
Supporting Information Fig. S1 and Tables S1–S4 Table S1 List of the 50 eukaryotic complete genome sequences or ESTs used in this study, in addition to the NCBI nr database Species
Lineage
Acanthamoeba castellanii
Amoebozoa
Antonospora locustae
Microsporidians
Aureococcus anophagefferens
Pelagophytes
Batrachochytrium dendrobatidis
Chytrids
Bigelowiella natans
Cercozoans
Blastocystis hominis
Stramenopiles
Brachionus plicatilis
Rotifers
Capitella sp.
Segmented worms
Capsaspora owczarzaki
Opisthokonta
Chlorella sp.
Green algae
Chlorella vulgaris
Green algae
Cyanidioschyzon merolae
Red algae
Cyanophora paradoxa
Glaucocystophyceae
Daphnia pulex
Crustaceans
Dictyostelium purpureum
Cellular slime molds
Emiliania huxleyi
Haptophytes
Euglena gracilis
Euglenoids
Glaucocystis nostochinearum
Glaucocystophyceae
Guillardia theta
Cryptomonads
Hartmannella vermiformis
Amoebozoa
Heterocapsa triquetra
Dinoflagellates
Hyperamoeba sp.
Amoebozoa
Isochrysis galbana
Haptophytes
Karenia brevis
Dinoflagellates
Karlodinium micrum
Dinoflagellates
Lottia gigantea
Gastropods
Malawimonas jakobiformis
Malawimonadidae
Mastigamoeba balamuthi
Amoebozoa
Monosiga ovata
Choanoflagellates
Naegleria gruberi
Heterolobosea
Paracercomonas marina
Cercozoans
Pavlova lutheri
Haptophytes
Physarum polycephalum
Plasmodial slime molds
Phytophthora ramorum
Oomycetes
Phytophthora sojae
Oomycetes
Polysphondylium pallidum
Cellular slime molds
Polytomella parva
Green algae
Porphyra yezoensis
Red algae
Prototheca wickerhamii
Green algae
Reclinomonas americana
Jakobida
Rhizopus oryzae
Fungi
Sawyeria marylandensis
Heterolobosea
Scenedesmus obliquus
Green algae
Seculamonas ecuadoriensis
Jakobida
Sphaeroforma arctica
Opisthokonta
Spironucleus vortens
Diplomonads
Streblomastix strix
Oxymonadida
Thalassiosira pseudonana
Diatoms
Trimastix pyriformis
Unclassified eukaryotes
Table S2 List of TAL genes in 17 representative land plant genomes Lineage
Dicots
Monocots
Gymnosperm Fern Moss
Species Linum usitatissimum Linum usitatissimum Populus trichocarpa Populus trichocarpa Medicago truncatula Arabidopsis thaliana Capsella rubella Thellungiella halophila Citrus sinensis Vitis vinifera Mimulus guttatus Sorghum bicolor Zea mays Setaria italica Oryza sativa Brachypodium distachyon Picea sitchensis Selaginella moellendorffii Physcomitrella patens
Name LuTAL1 LuTAL2 PtTAL1 PtTAL2 MtTAL AtTAL CrTAL ThTAL CsTAL VvTAL MgTAL SbTAL ZmTAL SiTAL OsTAL BdTAL PsTAL SmTAL PpTAL
Locus Lus10043136 Lus10032613 POPTR_0003s16030 POPTR_0001s12930 Medtr7g006100 AT5G13420 Carubv10000972m Thhalv10013572m orange1.1g036665m GSVIVG01001098001 mgv1a006041m Sb03g044500 GRMZM2G134256 Si001538m LOC_Os01g70170 Bradi2g59370 ABR16241 74909 Pp1s159_68V6
Length 436 436 436 440 443 438 441 439 440 441 460 429 429 429 432 429 444 423 438
Intron 6 6 6 6 6 6 6 6 6 6 6 5 5 5 5 5
Chromosome scaffold25 scaffold140 scaffold_3 scaffold_1 7 5 scaffold_6 scaffold_2 scaffold00081 1 scaffold_39 chromosome_3 8 scaffold_5 1 2
Location 1384528–1386813 1012925–1015257 15654057–15657021 10023678–10027179 845072–850479 4301792–4304312 4298572–4301148 4380727–4383435 111594–114983 22628856–22634048 1460196–1462967 71853994–71856810 160390396–160393378 45396389–45399497 40610513–40613463 57090545–57093078
5 7
scaffold_0 scaffold_159
1351640–1353058 376836–382010
Table S3 The site-specific model parameters Branch
Model
Loge L
PSS under NEBc
Parameters
ω = 0.0608
M0
-10086.8220
M3
= p0 0.5461, = p1 0.3549, = p2 0.0990 ** -9778.1731 = ω0 0.0025, = ω1 0.0949, = ω2 0.3612
PSS under BEBd
-
-
NAN
NAN
-
-
NAN
NAN
-
-
NAN
NAN
-
-
p0 = 0.9166, p1 =0.0834 M1a Land plantsa
-9973.4908 = ω0 0.0438, = ω1 1.0000
M2a
= p0 0.9166, = p1 0.0834, = p2 0.0000 -9973.4908 = ω0 0.0438, = ω1 1.0000, = ω2 9.7249
M7
-9783.8626
β (0.2728,3.3243) β (0.2728,3.3247)
M8
-9596.8567
Actinobacteriab M0
-7869.1297
p1 = 0.9999,ω =1.0000
ω = 0.0022
M3
= p0 0.2900, = p1 0.4343, = p2 0.2758 ** -7576.9542 = ω0 0.0001, = ω1 0.0023, = ω2 0.0087
NAN
NAN
-
-
NAN
NAN
-
-
NAN
NAN
p0 = 0.8041, p1 =0.1959 M1a
-7732.2492 = ω0 0.0343, = ω1 1.0000
M2a
= p0 0.8041, = p1 0.0086, = p2 0.1873 -7732.2492 = ω0 0.0343, = ω1 1.0000, = ω2 1.0000
M7
-7581.9788
β (0.5597,99.0000) β (0.5597,99.0000)
M8
a
-7581.9792
p1 = 0.0001,ω =3.2668
All the TAL genes list in Table S2 were used in this analysis. bEight Actinobacteria TAL genes followed to the same branch of land plants on the phylogeny
were used in this analysis. cPositively selected sites (PSS) under naive empirical Bayes (NEB) analysis; dpositively selected sites (PSS) under Bayes empirical Bayes (BEB) analysis. NAN, not a number.
Table S4 Morphometric analysis of wild-type and TAL-RNAi plants Organ
Wild-type
TAL-Ri
Flag leaf length (cm)
26.1 ± 4.9 (7)
21.0 ± 3.4 (9)*
Flag leaf width (cm)
1.6 ± 0.1 (7)
Leaf
1.3 ± 0.3 (9)**
Number of large veins of flag leaf
13.6 ± 1.5 (7)
11.9 ± 3.6 (9)*
Number of small veins of flag leaf
49.4 ± 3.6 (7)
34.9 ± 5.9 (9)**
Number of large vascular bundles of internode I
14.0 ± 0.8 (7)
10.0 ± 3.8 (9)**
Number of small vascular bundles of internode I
30.0 ± 8.6 (7)
22.0 ± 4.3 (9)*
Number of large vascular bundles of internode II
30.7 ± 1.4 (7)
26.0 ± 4.2 (9)**
Number of small vascular bundles of internode II 30.9 ± 0.9 (7)
25.8 ± 4.3 (9)**
Stem
The flag leaf, internode I and internode II morphometric analyses were carried out at heading stage. Results represent means ± SD of populations of the size indicated in parentheses. Asterisks indicate the significance of differences between wild-type and TAL-RNAi as determined by Student’s t test: **, P = 0.01 level; *, P = 0.05 level.
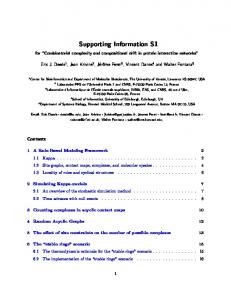
Fig. S1 An alignment of the selected TAL protein sequences in land plants and Actinobacteria, showing the positively selected sites in land plants. The positively selected sites are indicated by deckling.