cost by eliminating the dedicated server, while still de- liver potentially huge amount of computing power. To support the execution of soft real-time applica-.
Supporting Quality of Service in a Non-dedicated Opportunistic Environment Jin Liang, Klara Nahrstedt Department of Computer Science University of Illinois at Urbana-Champaign {jinliang, klara}@cs.uiuc.edu Abstract In this paper we investigate the utilization of nondedicated, opportunistic resources in a desktop environment to provide statistical assurances to a class of QoS sensitive, soft real-time applications. Supporting QoS in such an environment presents unique challenges: (1) Soft real-time tasks must have continuous access to resources in order to deliver meaningful services. Therefore the tasks will fail if not enough idle resources are available in the system . (2) Although soft real-time tasks can be migrated from one machine to another, their QoS may be affected if there are frequent migrations. In this paper, we define two new QoS metrics (task failure rate and probability of bad migrations) to characterize these QoS failures/degradations. We also design admission control and resource recruitment algorithms to provide statistical guarantees on these metrics. Our model based simulation results show that the admission control algorithms are effective at providing the desired level of assurances, and are robust to different resource usage patterns. Our resource recruitment algorithm may need long time of observations to provide the desired guarantee. But even with moderate observations, we can reduce the probability of a bad migration from 12% to less than 4%, which is good enough for most real applications.
1
Introduction
It is well known that most of today’s desktop computers are not fully utilized by their owners [8, 2, 6]. This has motivated the design of many global computing and desktop grid systems such as SETI [1], Condor [7] and Entropia [3]. Although these systems have been successful at harnessing the idle resources in an intranet or across the Internet, they mainly focus on best effort applications and do not provide the necessary system support for QoS sensitive, soft real-time
applications such as distributed multimedia applications. As a result, these applications are excluded from making use of the abundant idle resources. Soft real-time applications such as online video transcoding and mixing are often compute intensive and require a lot of computing resources. On the other hand, with the increasing popularity of video based applications and pervasive, low-end computing devices, more and more users would like to access video contents using mobile devices such as handheld PCs and cell phones. Due to the low capabilities of these devices (e.g. low processing power and small display space), video contents must be transcoded before they are delivered to the devices. Previous research has suggested running transcoders on dedicated servers [11, 10]. However, we believe a resource management system that supports the execution of soft real-time applications on top of the idle, opportunistic resources presents an attractive alternative, because it can reduce the system cost by eliminating the dedicated server, while still deliver potentially huge amount of computing power. To support the execution of soft real-time applications, however, our resource management system must provide some statistical QoS guarantees on top of the idle, opportunistic resources. In this paper, we investigate the techniques to provide such guarantees. Opportunistic environment: We consider a nondedicated desktop environment similar to a desktop grid [3]. In such an environment, tens or even hundreds of individually owned desktop computers are connected by a LAN. When a computer is not used by its owner (and subject to any policy the owner might have), it is said to be in AV (AVailable) state. Otherwise it is said to be in NA (Not Available) state. To be unobtrusive to the resource owners, we can only use a computer when it is in AV state. Whenever the owner resumes using the computer, any applications that do not belong to the owner must be immediately evacuated. We call such a computer an opportunistic resource and such an environment an opportunistic environment.
Soft real-time tasks: The applications we consider in this paper are soft real-time applications, particularly distributed multimedia applications. The component of an application that runs on an opportunistic resource is called a task. One key difference of soft real-time tasks from best effort applications is that they have application QoS requirements such as frame rate and frame size. This often translates into continuous requirements for certain shares of the underlying resources (e.g., 10% of the CPU processing time). This means to satisfy the QoS requirements of the tasks, we must ensure that they have continuous access to resources, even though the underlying resource might be reclaimed by its owner at any time. Fortunately, soft real-time tasks often have two characteristics that make it possible to run such tasks in an opportunistic environment. (1) They can often tolerate occasional resource disruptions. This is characterized by a maximum delay DT . If a task is stopped and resumed within time DT , the QoS of the task will not be affected. For example, in a distributed video on demand system, the client can often buffer some frames in its local memory. So long as the next frame arrives before the buffer depletes, the QoS to the user will not be affected. (2) These tasks can be migrated with little overhead. Soft real-time tasks often consist of periodic data processing, and the processings in different periods are minimally dependent on each other (e.g., the GOPs (Group of Pictures) in an MPEG stream are often independent of each other). Therefore, if the migration is done at the boundary of such periods, only small amount of state information needs to be migrated and yet the delay introduced is small [10]. This means soft real-time tasks can be migrated when the underlying resources are reclaimed, without their QoS being affected. New QoS metrics: Task migration makes it possible to run soft real-time tasks in an opportunistic environment. However, migration alone cannot provide the necessary QoS guarantees. This is because it is possible when a task needs to be migrated, there is no alternative resource available. At this time the task is considered failed, because it no longer has continuous access to resources. Even if an alternative resource is available, the QoS of a soft real-time task may be affected if it is migrated frequently. For example, in the above video on demand system, although the video client can tolerate occasional resource disruptions by consuming the frames in its local buffer, it may take some time for the client to have some frames buffered again after a disruption. Therefore, if a task is migrated immediately following its previous migration, its QoS is likely to be affected.
To characterize these QoS failures/degradations, we define two new QoS metrics. The task failure rate refers to the probability that an admitted task will fail due to lack of idle resources. And the probability of bad migrations refers to the probability that a task is migrated immediately following its previous migration. Suppose a system has been configured with target values for these metrics, our resource management should try to ensure (by using admission control and resource recruitment algorithms) that the actual task failure rate and probability of bad migrations are kept below the target values. We should note that the QoS metrics defined above are unique to an opportunistic environment, and are the focus of this paper. When a task is running on an opportunistic resource, we still need a soft real-time scheduler to guarantee its required share of resources. However, soft real-time scheduling is a conventional QoS mechanism so we do not discuss it here.
2
Idle Resource Characterization
To provide statistical QoS support in an opportunistic environment, we must first understand resource usage patterns in such environments. Mutka et al. [8] have provided detailed resource characterization in a workstation environment. To examine if their results are still valid in today’s desktop environment, we have collected a small set of traces in our research group and performed some data analysis. Our traces include nine machines and last about 2 weeks starting from June 30, 2003. All of the machines are running Windows 2000 or Windows XP and are used daily by students for research purposes. We measure the CPU utilization every 2 seconds (we call this measurement interval a tick ), and we consider a machine to be in AV state if the CPU utilization has remained below some threshold for at least 30 ticks (1 minute). The threshold is 15% for one machine that seems to have relatively high background load, and 5% for all the other machines. Although our trace collection environment is significantly different from those in [8], our trace analysis shows very similar results. This means the results are common to different desktop environments. Two idle resource characterization results are particularly relevant to our opportunistic resource management system. The first is about the variation of resource availability with time. Mutka et al. [8] have shown that the resource availability changes greatly over the time of day, but the availability variation for the same time across different days is relatively small. We find this to be true for our traces. For example, the resource availability often drops sharply from 8am
to 10am, because this is often the time that students begin to work. During lunch time from 12pm to 1pm there will be more resources available. For the same time on different days, however, the available resources are often close to each other. The second result is about the distribution of the AV and NA intervals. Mutka et al. [8] have shown that the lengths of such intervals follow hyper-exponential distributions. A hyper-exponential distribution is a combination of several exponential distributions. For example, Eq. (1) is a hyper-exponential distribution with k components. Fi (t) = 1 − e−t/µi is an exponential distribution with mean µi , αi is its weight and Σki=1 αi = 1. F (t) = Σki=1 αi Fi (t)
(1)
In [8], it has been shown that a 3-component hyperexponential distribution fits the AV intervals well and a 2-component hyper-exponential distribution fits the NA intervals well. We have tried to fit our traces to the same type of distributions. We find that these distributions generally fit the data well. For most of the traces, the mean square error of the distribution fitting is on the order of 10−4 . However, we do find two traces for which the hyper-exponential distribution is not a good fit. For one of the traces we find it is because there is a periodic process that runs every 10 minutes. As a result, the AV intervals on this machine are at most 269 ticks 1 . For the other trace, there is no apparent reason why hyper-exponential distribution does not work. We should note that our distribution fitting is for the purpose of generating realistic AV/NA intervals in our simulation studies. Our resource management does not rely on the particular distributions (In fact, hyper exponential distributions are known to have large variances). The above result shows that it is possible to generate realistic AV/NA intervals using hyperexponential distributions. But other resource usage patterns such as periodic processes should also be taken into consideration.
3
Resource Management System
3.1
Resource Availability Profile
Based on the resource availability result from the previous section, we design the following opportunistic resource management scheme. We divide the time of the day into S slots (e.g., each hour is a slot). For 1 When
the periodic process runs, the machines enters NA state. The process finishes in one tick, but it takes another 30 ticks before the machine enters AV state. However, the machine only stays in AV state for 269 ticks before the process runs again.
each slot, we observe the minimal number of available machines in that slot on each day. These observations form an estimation of the probability mass function (PMF) of the available machines. The sequence of PMFs (one for each slot) is called the resource availability profile of the system. Our opportunistic resource management system is based on the PMF for each slot. For example, if a user requests to run a soft real-time task in the current slot t, we must check if the admission of the task will violate the task failure rate guarantees for slot t. If a task spans over several slots, the admission control has to be performed for each slot. This means the overall failure probability for the task might be high, even if its failure probability within each slot is small. Our solution to this problem is to accept this as the guarantee provided by the system. That is, we only guarantee the failure probability in each slot, instead of the failure probability for a task that may run arbitrarily long.
3.2
Resource Allocation Model
As has been mentioned, the QoS requirements of soft real-time tasks often translate into requirements of certain shares of the underlying resources. In this paper, for simplicity, we further assume that each task requires the same amount of resource, say, 1 unit. And we assume each opportunistic machine, when it is available, provides n units of resources. This means each machine is capable of running n tasks. It is tempting to use some other more “realistic” models which, for example, assume that each task τi has a request of Ri units of resources and each machine mj has a capacity of Cj units of resources. However, such a model will make the admission control more complicated. The reason is that in an opportunistic environment, we can only know from our resource availability profile how many machines will be available. We do not know which machines will be available. Therefore, if we know that N machines will be available in a slot, we must ensure that for any combination of N machines, we can put all the admitted tasks on these N machines. This in general is an NP-Hard bin-packing problem. To perform admission control in the general case, we must enumerate all possible combinations of N machines and check if the admitted tasks can be packed into these N machines. However, other than the exhaustive check, there is no significant algorithmic difference from our simple model. By assuming that all tasks need the same amount of resources, it is possible that our model may waste some idle resources. However, we consider this to be acceptable for two reasons. First, our goal is to provide
statistical QoS guarantees to soft real-time applications on top of the idle, opportunistic resources. Given the abundance of such resources, their full utilization is of less concern to us. Second, in a typical opportunistic environment, we will have best effort as well as soft real-time tasks. These tasks do not require guaranteed share of resources and can be scheduled to share whatever resource is left by the soft real-time tasks.
3.3
k machines available, there are two cases. With probability pk−1 − pk , we still have k − 1 machines available. At this time, only 1 task needs to fail. With probability 1 − pk−1 , we do not have even k − 1 machines. At this time, the second algorithm assumes that all tasks will fail. Since it considers the case when we have only k − 1 machines, this algorithm is called CalcCapacityK1 and is shown below. CalcCapacity-K1(target f r) for k = 1 to M f r[k] = 1 − pk−1 + (pk−1 − pk )/k if f r[k] > target f r then return k − 1 end for return M
Admission Control
From our resource availability profile, we can know for each k, the probability of having at least k machines available (in a slot t) is pk , i.e., P r(A ≥ k) = pk ,
(2)
where A is a random variable denoting the number of available machines. To perform admission control, however, we must compute the number N of tasks that we can admit before the task failure rate of the system exceeds some target value target f r. Below we present three heuristic algorithms for calculating the number N . The idea of all three algorithms is to calculate the task failure rate for each k, assuming k tasks are admitted. The largest k that results in a failure rate less than target f r is the number N we need. To facilitate our discussions, in the following we assume that each machine can run only one task. The case when each machine can run n tasks can be obtained similarly. The first algorithm assumes that the task failure rate when k tasks are admitted is 1 − pk . Therefore, the algorithms is as follows: CalcCapacity-CDF(target f r) for k = 1 to M f r[k] = 1 − pk if f r[k] > target f r then return k − 1 end for return M
In the above algorithm, M is the total number of machines in the system, f r[k] is the failure rate when k tasks are admitted. pk is the probability defined in Eq. (2). The algorithm is called CalcCapacity-CDF, because it considers the task failure rate f r[k] to be the probability of having no more than k − 1 machines available, which is exactly the value of the cumulative distribution function (CDF) of the available machines at k − 1. Apparently this algorithm is being conservative, because it assumes in the event when the system does not have k machines available (which happens with probability 1 − pk ), all k admitted tasks will fail. The second algorithm takes a step further from CalcCapacity-CDF. When the system does not have
The third algorithm extends CalcCapacity-K1 and considers all the information in Eq. (2). To calculate the failure rate when k tasks are admitted, we divide the k tasks into two groups. The first group contains the task that is the last one to be admitted, and the second group contains all the other k − 1 tasks. Suppose whenever some task needs to fail, the system first chooses to fail the task in the first group. If more tasks have to fail, the other tasks are chosen randomly. Therefore, the task failure rate for the first group is 1 − pk , because the task will fail whenever we do not have k machines. For the second group, since no tasks will fail when there are k − 1 or more machines available, and only these tasks will fail when less than k − 1 machines are available, it is clear that the task failure rate for these tasks is exactly the same as when only k − 1 tasks are admitted. Therefore, the task failure rate for the k tasks can be calculated as the average of the two groups. This algorithm is called CalcCapacityACC because it attempts to calculate the task failure rate “accurately” based on all the information available from the resource availability profile. CalcCapacity-ACC(target f r) f r[0] = 0 for k = 1 to M f r[k] = (f r[k − 1] ∗ (k − 1) + (1 − pk ))/k if f r[k] > target f r then return k − 1 end for return M
Given a target task failure rate target f r, we can use any of the above algorithms to calculate the number N of tasks that can be admitted. This is then used to decide if a newly arrived task can be admitted.
3.4
Resource Recruitment
As mentioned in the Introduction, soft real-time tasks cannot tolerate frequent migrations. Suppose a migration is considered bad, if it is within δ time of
the previous migration, and denote the probability of bad migrations as θ. If we place a task on a machine right after it becomes available, then the probability of having a bad migration is the same as the probability of having an AV interval that is shorter than δ. Therefore, we can guarantee that the probability of bad migrations does not exceed some target value θ0 , if we have P r(AV < δ) < θ0 (Here AV denotes the length of an AV interval). It has been observed [4, 2] that if a machine has just become idle, it is likely to be reclaimed soon. However, if a machine has been idle for a long time, it is likely to remain idle for still longer time. This means we should probably not use a machine when it first becomes idle. Instead, we should find a threshold T that satisfies the following inequality and make use of a machine only when it has been idle for at least T time units. P r(T ≤ AV < T + δ|AV ≥ T ) < θ0 .
(3)
Here P r(T ≤ AV < T + δ|AV ≥ T ) is the probability that an AV interval has a length between T and T + δ, conditioned on AV ≥ T . The act of waiting for T time units before allowing an idle machine to be used is called resource recruitment and T is called the recruitment threshold. Therefore, to control the probability of bad migrations, we can create a probability mass function (PMF) for the AV intervals on each machine. We can then use the following algorithm to calculate the recruitment threshold T for the machine. CalcThreshold(θ0 , δ) for T = 1 to Tmax p = P r(T ≤ AV < T + δ|AV ≥ T ) if p < θ0 then return T end for return ERROR
In the above algorithm, Tmax is some maximum value so that if we cannot find a T ≤ Tmax that satisfies the conditional probability requirement, we will not use the machine to run any opportunistic task. Note the use of a recruitment threshold T will affect the construction of the resource availability profile because the “usable” AV intervals are less now. Therefore, there is a tradeoff between the QoS provided by the system and the utilization of idle resources.
4
Simulation Results
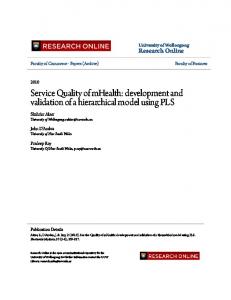
In this section we present simulation results to evaluate our admission control and resource recruitment algorithms. The architecture of our simulator is shown in Figure 1. Our simulator consists of a set of machine objects, an InfoServer, and a scheduler.
InfoServer
scheduler
Capacity Query Results
Task Dispatch
Status Report
...
machines
Figure 1. Simulator architecture
Table 1. Range of parameters for the AV and NA distributions (Second row is for NA) µ1 [10,60] [30,120]
µ2 [120, 360] [480, 1200]
µ3 [1800, 3600] N/A
α1 [0.4, 0.6] [0.8, 0.99]
α3 [0.01, 0.1] N/A
Each machine uses hyper-exponential distributions to generate alternate AV and NA intervals, and reports the state to the InfoServer. When the machines are initialized, each of them randomly generates two hyperexponential distributions, one for the AV intervals and the other for the NA intervals. The AV distribution is generated from the ranges in the first row of Table 1. The numbers in the first three columns are in ticks (we use 1 tick for 2 seconds and each slot has 1800 ticks). Since Σki=1 αi = 1, we only generate α1 and α3 , α2 is calculated as 1 − (α1 + α3 ). The NA distribution can be similarly generated from the ranges in the second row of the table. These ranges are derived from fitting the hyper-exponential distributions to our traces. The InfoServer monitors the overall resource availability and builds the availability profile. It also uses one of the algorithms in Section 3.3 to calculate the system capacity, i.e., the number of tasks that can be admitted without violating the target task failure rate. At the beginning of each slot, the scheduler queries the InfoServer for the system capacity. Suppose N tasks can be admitted, the scheduler will generate N tasks to run on the machines. Each task needs to run for an entire slot. During the slot, if a machines becomes unavailable, any task on the machine must be migrated. If an alternative idle machine cannot be found, the task is declared failed. We repeat the above process until a large number (8000 in our experiments) of tasks are scheduled. This is called one simulation. The actual task failure rate for each simulation is calculated as the percentage of tasks that have failed. Before any task can be scheduled, the InfoServer must have an initial estimation of the resource avail-
x 10
0.018
fr-acc fr-k1 fr-cdf
4.5 4 3.5 3 2.5 2 1.5 1
fr-acc fr-k1 fr-cdf
0.016 0.014 0.012 0.01 0.008 0.006 0.004 0.002
0.5 0 0
task failure rate for each simulation
task failure rate of each simulation
task failure rate for target_fr = 0.01
task failure rate for target_fr = 0.001
-3
5
10
20
30
40
50
60
70
80
90
100
number of simulations
0 0
10
20
30
40
50
60
70
80
90
100
number of simulations
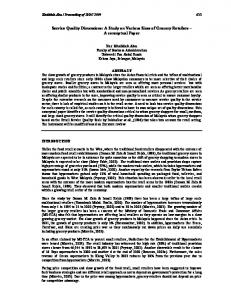
Figure 2. Failure rates for target f r = 0.001
Figure 3. Failure rates for target f r = 0.01
ability PMF. When each simulation starts, we let the system run for Ninit slots and build the initial PMF of the available resources. After Ninit slots, we begin to schedule tasks on the system. In the following simulations, we use a pool of 300 machines and set Ninit to be 60. We also set the capacity of each machine to be 1. As has been mentioned, this does not affect the evaluation of the algorithms.
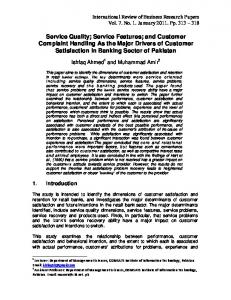
assume limited mode of failures, i.e., all the tasks will fail when k (or k − 1) machines are not available. This makes the two algorithms increasingly conservative when target f r increases. Although these two algorithms achieve much better task failure rate than CalcCapacity-ACC, this comes at the cost of resource utilization. On average the CalcCapacity-ACC algorithm can admit 169 tasks in each slot, CalcCapacityK1 can admit 163 tasks and CalcCapacity-CDF can only admit 162 tasks. To better understand the performance of the three algorithms, we have used our simulation environment to generate a PMF of the available machines and calculated the failure rates f r[k] for different k using the three algorithms. Figure 4 shows the PMF, CDF of the available machines and the failure rates calculated by the algorithms . We can see that the failure rates calculated by CalcCapacity-CDF and CalcCapacityK1 both increase quickly as k (the number of admitted tasks, which is equal to the number of allocated machines since the capacity of each machine is 1) increases. And their increase follows that of the cumulative distribution function (CDF) of the available machines. This is in accordance with our analysis of CalcCapacity-CDF. For CalcCapacity-K1, when k is large, the failure rate f r[k] is dominated by 1 − pk−1 , which is the CDF value at k − 2. The figure also shows that the failure rate calculated by CalcCapacity-ACC increases more slowly with k. Since CalcCapacity-ACC can track the actual task failure rate, it is obvious that CalcCapacity-K1 and CalcCapacity-CDF are too conservative for relatively large target failure rates. This also explains why the f r-k1 and f r-cdf in Figure 3 are much better than the target failure rate. The above results mean that if the desired guarantee is the average task failure rate, then CalcCapacityACC is a good choice, because it can admit more tasks than the other two algorithms, while the average task failure rate is close to the target value. However, if
4.1
Simulation results for admission control
In this subsection we study the performance of the admission control, based on the three algorithms in Section 3.3. Using each of the algorithms, we run the simulation 100 times, with the target failure rate target f r set to 0.001. Figure 2 shows the actual task failure rate for each simulation. f r-cdf , f r-k1 and f racc correspond to the three algorithms in Section 3.3. From the figure we can see that CalcCapacity-CDF performs fairly well in guaranteeing the desired task failure rate. Only in three of the 100 simulations is the actual task failure rate higher than the target rate. CalcCapacity-K1 also achieves the desired failure rate in all but 6 simulations. The failure rate of CalcCapacity-ACC seems to be scattered around the target rate. This is not surprising, because the algorithm attempts to achieve the exact task failure rate. Due to the randomness of the available resources, however, the actual failure rate will be either higher or lower than the target value. Figure 3 shows the actual task failure rate when target f r is set to 0.01. Again, we see the failure rate of CalcCapacity-ACC scattered around the target failure rate. Both CalcCapacity-K1 and CalcCapacity-CDF achieve much better failure rate than the target rate. This is because when target f r is large, it is possible to distribute the failure rate f r[k] among different failure scenarios before target f r is reached. However, both CalcCapacity-K1 and CalcCapacity-CDF
PMF, CDF of available machines and the calculated failure rate
0.1
CDF
PMF
CalcCapacity-CDF 0.08
-3
4.5
task failure rate of each simulation
0.12
CalcCapacity-ACC
CalcCapacity-K1
0.06
0.04
0.02
x 10
task failure rate for target_fr = 0.001, disturbed distribution fr-acc fr-k1 fr-cdf
4 3.5 3 2.5 2 1.5 1 0.5
0 155
160
165
170
175
180
185
190
0 0
195
number of available/allocated machines
Figure 4. PMF, CDF of available machines and the failure rates calculated by the algorithms
the desired guarantee is the worst task failure rate, the other two algorithms should be used. If the target failure rate is low, then CalcCapacity-CDF should be used to minimize the task failure rate violations. If the target task failure rate is high, then CalcCapacity-K1, or some other algorithm between CalcCapacity-ACC and CalcCapacity-K1 should be used in order to increase the resource utilization. In Section 2 we have mentioned that hyperexponential distribution does not fit some resource usage patterns such as periodic processes. To test the robustness of our algorithms to different resource usage patterns, we modify the distributions used to generate AV and NA intervals. Specifically, for 50 of the machines, we set the AV interval to 269 ticks, whenever the generated length is longer. This simulates the effect of a process that runs once every 10 minutes on the distribution of the AV intervals. For another 10 machines, we use the empirical distribution of one of our traces to generate AV intervals. This trace does not have a very good hyper-exponential fit. For the other machines, we continue to use hyper-exponential distributions. Figure 5 shows the task failure rates for such a system when the target failure rate is 0.001. From the figure, we do not see any significant difference from Figure 2. This means that our PMF based resource management scheme and the admission control algorithms are robust to different resource usage patterns in an opportunistic environment.
4.2
Simulation results for resource recruitment
To study the performance of our resource recruitment algorithm, we let each task record its migration time. At the end of a simulation, we compute the probability of a bad migration (θ) as the percentage of migrations that are within δ time of the previous one.
10
20
30
40
50
60
70
80
90
100
number of simulations
Figure 5. Failure rates for disturbed distribution
Table 2. Resource recruitment results θ0 1% 1% 1% 0.1% 0.1% 0.1%
Nrecr 60 300 600 60 300 600
θ 3.74% 2.12% 1.61% 3.69% 1.69% 1.25%
T 235 485 619 242 591 774
migr 633 869 951 642 940 1015
avail 40.61% 31.47% 28.35% 40.09% 28.71% 25.66%
We also record the threshold T calculated by our algorithm, the percentage of time that a machine is in “usable” AV state (avail), and the mean time between two migrations (migr), all averaged across the machines. In our simulation, we chose δ to be 15 ticks. This means we want a task to run for at least 30 seconds on any machine with a probability greater than 1 − θ0 . Since our recruitment threshold affects the construction of resource availability profiles, we let the system run for Nrecr slots first. During these slots, we build PMF for the AV intervals on each machine. At the end of the Nrecr slots, we calculate the recruitment threshold T for each machine. For the next Ninit slots, we build the resource availability profile based on the “usable” AV intervals, and then run the tasks. For different Nrecr and target probability θ0 , we run the simulation 100 times and report the average values. Table 2 shows the simulation results. From the table we can see that the performance of our resource recruitment algorithm depends on the accuracy of PMF estimation for each machine. Generally, the longer the observations (with larger Nrecr ), the smaller the achieved probability of a bad migration. This is because hyper-exponential distributions generally have very large variances. The AV intervals generated from such a distribution will span a large range. So it takes a lot of observations before an accurate estimation of
the distribution can be obtained. Although it may seem difficult for our resource recruitment algorithm to guarantee a very small probability of bad migrations, the achieved probability is much better than if we have no resource recruitment. If we disable resource recruitment in our simulations, then the probability of a bad migration is about 12%. With resource recruitment, we can reduce the probability to less than 4% with moderate observations, this means for more than 96% of the time, a task can run for at least 30 seconds on a machine. We believe this is good enough for many real applications. Table 2 also shows that to achieve a small probability of bad migration, we have to use larger recruitment threshold T , which means the usable AV intervals will decrease. For example, when we increase T from 235 ticks to 485 ticks, we can reduce θ from 3.74% to 2.12%. However, the usable AV intervals also decrease from 40.61% to 31.47%. Therefore, a system must decide on the tradeoff between the desired QoS and the idle resource utilization.
5
Related work
Research work related to our system falls mainly into two categories. The first concerns the characterization and utilization of idle resources. The second concerns statistical QoS guarantees. The abundance of idle resources has been recognized in previous research [8, 2, 4]. In addition, [8] has provided detailed characterization of the idle resources. Many systems such as Condor [7] and Entropia [3] have been built to harness the idle resources in a desktop environment. These systems have mainly focused on best effort applications which do not have strict QoS requirements. Our work aims to provide support for soft real-time applications using idle resources and can be viewed as complement to the above systems. There is also a lot of research work in providing statistical QoS guarantees in different contexts such as multimedia servers [12] , network routers [5] and utility Grid environment [9]. All of them assume that the amount of available resources in a system is fixed, and the goal of the admission control is to multiplex different applications onto the existing resources in order to maximize resource utilization. In our opportunistic environment, however, the amount of resources available is only known statistically, and the available resources might be reclaimed at any time. Therefore, the goal of our admission control algorithm is to make sure that when a task needs to be migrated, with high probability an alternative resource can be found.
6
Conclusion
We have designed a resource management system that can provide statistical assurances to a class of QoS sensitive soft real-time applications in an opportunistic environment. Simulation results show that our admission control algorithms can effectively provide the desired task failure rate guarantees. Our resource recruitment algorithm may need long time of observations to guarantee a small probability of bad migration. But even with moderate observations, we can reduce the bad migration probability from 12% to less than 4%.
References [1] SETI@Home. http://setiathome.ssl.berkeley.edu/,2003. [2] R. H. Arpaci, A. C. Dusseau, A. M. Vahdat, L. T. Liu, T. E. Anderson, and D. A. Patterson. The interaction of parallel and sequential workloads on a network of workstations. In ACM SIGMETRICS’95, pages 267– 278, Ottawa, Ontario, Canada, May 1995. [3] A. Chien, B. Calder, S. Elbert, and K. Bhatia. Entropia: Architecture and performance of an enterprise desktop grid system. Journal of Parallel Distributed Computing, 2003. [4] F. Douglis and J. K. Ousterhout. Transparent process migration: Design alternatives and the Sprite implementation. Software - Practice and Experience, 21(8):757–785, 1991. [5] E. Knightly and N. Shroff. Admission control for statistical QoS: Theory and practice. IEEE Network, 13(2):20–29, March 1999. [6] D. Kondo, M. Taufer, J. Karanicolas, C. Brooks, H. Casanova, and A. Chien. Characterizing and evaluating desktop grids: An empirical study. Technical report, UCSD, October 2003. [7] M. Litzkow, M. Livny, and M. Mutka. Condor - a hunter of idle workstations. In Proceedings of the Eighth International Conference on Distributed Computing Systems (ICDCS 1988), San Jose, CA, 1988. [8] M. W. Mutka and M. Livny. The available capacity of a privately owned workstation environment. Performance Evaluation, 12(4):269–284, July 1991. [9] J. Rolia, X. Zhu, M. Arlitt, and A. Andrzejak. Statistical service assurances for applications in utility grid environments. In MASCOTS’2002, pages 247– 256, Forth Worth, Texas, October 2002. [10] S. Roy, B. Shen, V. Sundaram, and R. Kumar. Application level hand-off for mobile media transcoding sessions. In NOSSDAV’02, pages 95–104, May 2002. [11] J. R. Smith, R. Mohan, and C.-S. Li. Scalable multimedia delivery for pervasive computing. In ACM Multimedia’99, pages 131–140, 1999. [12] H. M. Vin, P. Goyal, A. Goyal, and A. Goyal. A statistical admission control algorithm for multimedia servers. In Proceedings of ACM Multimedia’94, pages 33–40, San Francisco, October 1994.