the mouse scroll wheel: 1) Literal attribute graph view is displayed when users select a search result for further exploration and con- tains only literal attributes of ...
Supporting Search Result Browsing and Exploration via Cluster-based Views and Zoom-based navigation Karol R´astoˇcn´y, Michal Tvaroˇzek and M´aria Bielikov´a Institute of Informatics and Software Engineering, Slovak University of Technology in Bratislava, Slovakia Email: {name.surname}@stuba.sk
Abstract—The difficulty of finding relevant information in the Web is increasing as web repositories grow in size. We propose a novel approach for navigation in the Semantic Web, which helps users find relevant information and enables them to browse similar and/or related resources. We achieve this via view-based search using navigation in a two-dimensional graph, which has the advantage of visualizing dependencies between results. We address problems with readability and understandability via adaptive views, result clustering, facet marking, next action recommendation and zoom-based navigation. Keywords-Semantic Web; navigation; adaptive views; results clustering; graph visualization;
I. I NTRODUCTION AND R ELATED W ORK The amount of information in web repositories grows exponentially. This affects the number of identified results for search queries, which often decreases the relevance of results and causes information overload due to many results. Another issue is the difficulty of understanding relationships between results and between results and user queries. These problems are mostly visible in search engines, digital libraries and faceted browsers that often present users with many results displayed in lists spanning several pages without support for result exploration. One possible solution is the interconnection of user search activities – lookup, learning and investigation [1]. While these activities are not performed all at the same time, users often perform them in succession during search sessions. When users begin a search session, they have limited knowledge about the information space thus making query modification and result selection difficult. After users discover a suitable result and investigate its properties, they often need to explore related resources resulting in the need for navigation support. We address this need via navigation in hierarchical views integrated in a faceted browser that help users search, navigate and explore related and similar results. These views display information adaptively based on user interests and the type of provided content. Current approaches enhance navigation in the legacy Web by exploiting metadata, which are specifically important in the Semantic Web, and are mostly based on keyword-based query expansion, recommendation, faceted browsers and results clustering and visualization. Keyword-based query expansion [2] helps users build queries leading to better
results. Its main benefit is ease of use in conventional search engines. Recommender systems focus on finding similarity between actions and interests of multiple users thus recommending more accurate queries [3] or interesting results [4]. Faceted browsers navigate users via facets, thus eliminating the need for keyword guessing to describe desired results. Most existing browsers such as mSpace [5] present users with all facets and identified results without adaptation to user interests often resulting in information overload. Some search engines (like IGroup [6] or Yippy) employ result clustering in order to decrease information overload. Visualization via graphs enables users to explore relations between results. The RKBExplorer [7] visualizes only resources of the same type that are connected with curved oriented edges that represent relations between them. These edges however do not inform users about relation types but only about their existence. This problem is partly solved by domain specific visualization in GOLEM, which visualizes hierarchical relations in a gene ontology [8]. IsaViz solves this problem by showing RDF predicate labels over all edges and displays the complete graph at once, instead of gradually expanding the graph. This makes the graph unreadable for large RDF models or models with high relationship density. Our faceted browser Factic [9] performs graph visualization of ontologies as RDF triplets. The relation types are visualized as nodes interconnected with related nodes via oriented edges. This solves issues with long labels over edges, but requires users to read the graph through three nodes which users are not used to. The graph employs a uniform force-based layout, which visualizes changes in the graph and results in a symmetric graph layout [10]. The main benefit of faceted browsers over keyword-based search engines is that users need not have prior knowledge of the information space. By integrating faceted browsers with result clustering, users can find desired results more easily. Still, users need the ability to understand relations between results, so the option to use graph-based visualization remains crucial to providing relations in a readable and easily understandable way for generic users. II. AUGMENTING E ND - USER NAVIGATION We augment information discovery using metadata present in the Semantic Web by extending our original faceted
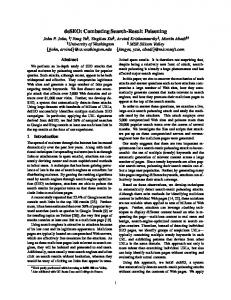
Figure 1. Example of the hierarchical cluster view integrated in Factic. First-level clusters contain four most prominent second-level clusters, which display four representatives with the highest membership degree. Buttons on the right facilitate navigation in user action history and zoom.
browser Factic [11] with additional support for query modification, result selection and exploration via: • Hierarchical Cluster-based Result Browsing, which extends faceted browsing with cluster-based visualization of search results, and query modification and navigation support via cluster selection. • Zoom-based Graph Navigation, augmenting our original graph visualization with advanced adaptive zooming capability thus reducing information overload and improving navigability during (related) result exploration. A. Hierarchical Cluster-based Result Browsing The purpose of our hierarchical cluster view is to provide tailored result overviews, dynamic result structuring and previews of results thus augmenting user understanding of the result set over traditional result lists and supporting query-by-example (see Figure 1). We cluster results returned by our faceted browser into hierarchical clusters based on multiple result properties. To make the classification more readable, we display only two hierarchy levels with representative samples for second-level clusters at a time. When a user selects a cluster, its subclusters from next two levels of the hierarchy are shown. We build clusters using semantic properties of resources that have discreet Boolean values, what negatively affects the number of feature vector’s dimensions and performance of the clustering algorithm (e.g., in our dataset we obtain more than 700 unique properties for 100 results). We address this by pre-filtering the properties, where we select properties
that are interesting for users and important for cluster creation. In the first pre-filtering step we remove uninteresting properties, as the corresponding clusters have no added value to users. Next, we remove all properties that either have too large or too small coverage (i.e., are present in nearly all current results or in almost none), as these would lead to one giant cluster or many tiny clusters. Our clustering algorithm is based on the Hierarchicalhyperspherical divisive fuzzy c-means clustering approach [12], which creates natural clusters and has good precision of item classification. To decrease its complexity of computing the number of top-level clusters, we predict the number of clusters from the pre-filtered properties. B. Zoom-based Graph Navigation We address navigation support and graph readability during (related) result exploration by extending our original graph visualization and navigation approach with zoombased graph navigation, i.e. dynamically adapting the level of detail of the presented information similarly to traditional map visualizations. We also aim to improve user understanding of the information space and consequently of the relations among resources using history persistence, i.e. by showing all visited nodes in the graph (at maximum detail) so that users can easily return to previously visited resources. We address issues with readability and clarity of our original approach via these extensions: • Result clustering – we decrease the number of displayed nodes in the graph by clustering object nodes
Pdf 2 items
Photos 40 items
Karol Rástočný
Created on 18. 7. 2008
Nature
Created on 18. 7. 2008
PDF 2 items
Theme
Author Mushrooms...
Theme Nature
Shows
Shows Shows
Made by Lumix TZ7
Forest Mushroom
Author Karol Rástočný
Shows Mushroom Cone Forest
Cone Shows
Color Shows
Photos 22 items
Brown Photos 34 items
Photos 15 items
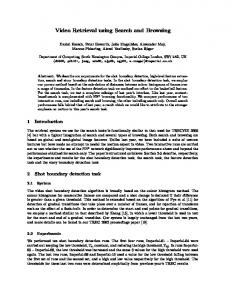
Figure 2. Visualization of the object attributes graph showing fewer nodes improving readability (left) and the RDF graph showing attributes of objects with the values of the original object’s attributes (right).
with the same connections to property nodes. This improves graph readability and increases performance. • Facet marking – users can directly affect the displayed results via property node marking as: wanted, unwanted, allowed which indicates whether newly displayed nodes with results have to, may not or can have straight connection to marked nodes. • Next action recommendation – we perform next action recommendation to provide user guidance in the graph utilizing query flow graphs [13]. We exploit user similarity based on observed navigation sequences (i.e., navigation history) and recommend possible next navigational steps (i.e., navigation trails) based on previous (similar) user experience. • User adaptation – we display only property nodes that are of interest to users in order to reduce information overload. We use user clicks on property nodes as indication of interest, increasing weights of clicked property node types while hiding irrelevant nodes. We employ the aforementioned techniques to provide users with four progressive levels of detail (abstraction) over the presented information space with natural transitions via the mouse scroll wheel: 1) Literal attribute graph view is displayed when users select a search result for further exploration and contains only literal attributes of results. 2) Object attribute graph view is displayed when users zoom in onto the literal attribute graph view. Unexpanded literal attributes are removed and nodes that represent object attributes of results are displayed. 3) Restricted RDF graph view – allows users to change
type of target objects to objects that are values of properties (e.g., change results from photos to authors). Transition to restricted RDF graph view involved the division of attribute nodes into two property nodes and object node (see Figure 2). 4) Full RDF graph view – is the most detailed view primarily intended for domain specialists. It is obtained from the restricted RDF graph by disabling adaptation to user interests (i.e., by adding hidden nodes). In both literal and object attribute graph views, the graph consists of a node corresponding to the initial result and several nodes around it representing its attributes. After attribute node expansion, new results with the same attributes clustered by their type, are displayed. Thereafter users can select one or more results from any cluster or browse results in the hierarchical cluster view. Result nodes are represented by thumbnails while attribute nodes integrate the property label and value into a single node (see Figure 2). Nodes representing clusters are shown as logarithmically sized ovals depending on the number of results in the cluster. They contain information about type of clustered results, their count and optional thumbnail collection (if possible). III. E VALUATION AND C ONCLUSIONS We presented a novel combination of cluster-based result exploration and zoom-based graph navigation as extensions of our original faceted browser Factic, which serves as an adaptive faceted semantic browser for ontological repositories. Our ongoing research focus is to improve visualization, navigation and orientation support for users during exploratory search sessions in the Semantic Web.
We evaluate our approach over an ontological repository of multimedia content which currently contains about 8,200 photos with both manually and automatically acquired annotations, including authors, tags, topics and EXIF metadata. In total, the dataset consists of about 35 classes, 50 predicates and more than 32,000 individuals and 150,000 facts. We conducted informal user observation during our initial prototype deployment and discovered that users were successfully able to navigate in the graph view but many had noticeable issues with graph readability across three nodes (subject-property-value). Based on these findings we proposed zoom-based graph navigation which reduces readability issues for users who prefer straight readability – both the property and its value displayed in one place. We have already performed preliminary usability evaluation of our zoom-based result exploration prototype with ten volunteers with different computer skills. Each volunteer had received a brief instruction about the basic functionality of our prototype. After that, they were given specific navigation goals and we observed their actions and asked them to explain them. The volunteers intuitively started using mouse wheel scrolling with the aim to know more about relations between results and to reach their goals, and expressed their satisfaction with this style of result exploration. While initial experiments seem to indicate promising results (users easily work with the prototype and understand the graph visualizations), we are still working on fine-tuning of the user interaction and the user model considering a term-based user model for future extensions [14]. Our aim was to provide users with navigation, orientation and guidance support during exploratory search sessions in metadata-rich information spaces such as the Semantic Web. Our contribution lies in the extension of faceted browsing with hierarchical cluster-based result exploration and zoombased graph navigation based on metadata of the presented information space. Our approach enables end-users to: • Modify and refine faceted search queries via examples from custom created result clusters providing usertailored overviews of the search result space. • Employ adaptive views with different levels of detail to navigate the information space via a graph, similarly to traditional mapping applications (i.e., zoom in, zoom out, zoom in onto something). • Overcome information overload during graph visualization and navigation by adaptively hiding irrelevant nodes based on user observation and implicit feedback. ACKNOWLEDGMENT This work was partially supported by the grants VEGA 1/0508/09, VG1/0675/11/2011-2014, APVV-0208-10 and it is the partial result of the Research & Development Operational Prog. for the project Research of methods for acquisition, analysis and personalized conveying of information and knowledge, ITMS 26240220039, co-funded by the ERDF.
R EFERENCES [1] G. Marchionini, “Exploratory search: from finding to understanding”, Comm. of the ACM - Supporting exploratory search, vol. 49, April 2006, pp. 41-46. [2] R. W. White and G. Marchionini, “Examining the effectiveness of real-time query expansion”, Information Processing and Management: an Int. Journal, vol. 43, May 2007, pp. 685-704. [3] P. Boldi, F. Bonchi, C. Castillo, D. Donato and S. Vigna, “Query suggestions using query-flow graphs”, Proc. of the Workshop on Web Search Click Data, ACM, 2009, pp. 56-63. [4] Y. Wang, W. Dai and Y. Yuan, “Website browsing aid: A navigation graph-based recommendation system”, Decision Support Systems, vol. 45, June 2008, pp. 387-400. [5] m.c. schraefel, M. Wilson, A. Russell and D. Alexander Smith, “mSpace: improving information access to multimedia domains with multimodal exploratory search”, Comm. of the ACM - Supporting expl. search, vol. 49, April 2006, pp. 47-49. [6] F. Jing, C. Wang, Y. Yao, K. Deng, L. Zhang and W.Y. Ma, “IGroup: web image search results clustering”, Proc. of the 14th annual ACM Int. Conf. on Multimedia (MULTIMEDIA ’06), ACM, 2006, pp. 377-384. [7] H. Glaser, I. C. Millard and A. Jaffri, “RKBExplorer.com: a knowledge driven infrastructure for linked data providers”, Proc. of the 5th European Semantic Web Conf. (ESWC’08), Springer-Verlag, 2008, pp. 797-801. [8] R. SG. Sealfon, M. A. Hibbs, C. Huttenhower, C. L. Myers and O. G. Troyanskaya, “GOLEM: an interactive graph-based gene-ontology navigation and analysis tool”, BMC Bioinformatics, vol. 7, Oct. 2006, pp. 443-451. [9] M. Tvaroˇzek and M. Bielikov´a, “Reinventing the Web Browser for the Semantic Web”, Proc. of Workshop on Web Information Retrieval Support Systems at WI-IAT 09, IEEE CS, 2009, pp. 113-116. [10] F. van Ham and B. Ellen Rogowitz, “Perceptual organization in user-generated graph layouts”, IEEE Trans. on Visualization and Comp. Graphics, vol. 14, Nov. 2008, pp. 1333-1339. [11] M. Tvaroˇzek and M. Bielikov´a, “Bridging Semantic and Legacy Web Exploration: Orientation, Revisitation and Result Exploration Support”, Proc. of Workshop on Web Information Retrieval Support Systems at WI-IAT 10, IEEE CS, 2010, pp. 326-329. [12] G. Bordogna and G. Pasi, “Hierarchical-hyperspherical divisive fuzzy c-means (H2D-FCM) clustering for information retrieval”, Proc. of the 2009 IEEE/WIC/ACM Int. Joint Conf. on Web Intelligence and Intelligent Agent Technology (WI-IAT ’09), IEEE CS, 2009, pp. 614-621. [13] P. Boldi, F. Bonchi, C. Castillo, D. Donato, A. Gionis and S. Vigna, “The query-flow graph: model and applications”, Proc. of the ACM 17th Conf. on Information and Knowledge Management (CIKM ’08), ACM, 2008, pp. 609-618. [14] M. Barla, “Towards Social-based User Modeling and Personali-zation”, Information Sciences and Technologies Bulletin of the ACM Slovakia, vol. 3, No. 1, 2011, 52-60.


![Space Exploration via Proximity Search arXiv:1412.1398v1 [cs.CG] 3 ...](https://m.moam.info/img/260x300/space-exploration-via-proximity-search-arxiv141213_5a307af31723dde2e8019e23.jpg)