Journal of Universal Computer Science, vol. 19, no. 15 (2013), 2320-2346 submitted: 9/11/12, accepted: 30/8/13, appeared: 1/9/13 © J.UCS
Web Search Results Exploration via Cluster-Based Views and Zoom-Based Navigation Karol Rástočný (Slovak University of Technology in Bratislava, Slovakia
[email protected])
Michal Tvarožek (Slovak University of Technology in Bratislava, Slovakia
[email protected])
Maria Bielikova (Slovak University of Technology in Bratislava, Slovakia
[email protected])
Abstract: Information seeking on the Web has become day-to-day routine for more than two billion human beings most of who use traditional keyword-based search engines. Developers of these search engines stress personalization, prediction of users’ next actions and mistake correction. But they are still struggling with results presentation and support for users, who make atypical queries or who do not exactly know what they are looking for. We address these issues via a novel approach for exploring web repositories, which naturally combines user search activities – look up, learning and investigation. We achieve this via view-based navigation in hierarchical clusters and two-dimensional graphs of search results. Keywords: Navigation, Exploratory Search, Adaptive Views, Results Clustering, Graph Visualization, Web; Semantic Web Categories: H.1.2, H.3.3, H.5.1, H.5.2, H.5.4
1
Introduction
In the last decade, we have witnessed significant advances in web information retrieval mostly related to query formulation, disambiguation and search results relevance. However, the improvement of search results exploration by end users has been somewhat limited. For example, while there is much improved autocomplete support and even limited faceted filtering in current web search engines, visualization and navigation in search results remains largely based on a linear list of results and the corresponding snippets. In 2002 Broder already referenced a three step information seeking process for information retrieval consisting of a query, result selection and (optional) query refinement [Broder 02]. At the time it was assumed that users were largely able to define what they were looking for (i.e., formulate a query) and that retrieving a set of relevant search results was sufficient to satisfy informational user needs, which was known as “known item search” in classical information retrieval. Present day user requirements however go beyond this assumption in several ways:
Rastocny K., Tvarozek M., Bielikova M.: Web Search Results Exploration ...
2321
Users are not able to exactly formulate what they are looking for in advance (i.e., when formulating their query). This has been shown by the number of short and ambiguous queries and the many query modifications needed to actually find satisfactory results [Jansen et al. 00];
Finding a set of relevant results (e.g., web pages) is by far not sufficient to accomplish most present day tasks. Specifically for informational queries, it is necessary for users to learn and/or understand the discovered information. This shift in end-user perception of search was coined as Exploratory search by Gary Marchionini in 2006 [Marchionini 06]. Users typically focus on three aspects (steps) when exploring search results returned by a search engine: 1. They identify whether a query modification is necessary and what modification it should be. For this, users quickly glance over the search results to verify whether they correspond to their expected information need or not; 2. They gain a broader understanding of the discovered results space, its scope and contents. This usually occurs once search results seem to satisfy the user’s information need and need to be examined more closely to either gain an understanding of what is out there (e.g., user wants just an overview of the ‘domain’) or select specific results for further exploration (e.g., user needs to know the details about something); 3. They gain a deeper understanding of something specific. Once users select a specific search result, they may want to learn as much about it as possible, or just look for a specific bit of information contained in the result description. This typically results in a navigational session where a user explores a single search result and information associated with it. Work has been done on all three aspects of search results exploration; most real-world advances however focus on query modification support, disambiguation and better search results relevance [Carpineto and Romano 12]. We aim to improve search results exploration support for acquiring an overview of the results space by presenting the discovered relations and properties of individual search results. In this paper we propose a novel approach to search results exploration that utilizes a hierarchy of adaptive views on search results, among which users can navigate by zooming via the mouse wheel and double-clicking. This way, we naturally interconnect user search and browsing activities while supporting all three of the aforementioned results exploration goals. We describe current search results overview navigation approaches and details of exploration approaches in section 2. Our approach is described in section 3 along with its application in the image exploration domain in section 4. We present our evaluation in section 5 and discuss findings and outline future work directions in section 6.
2
Search Results Overview and Exploration
The creation of and interaction with search results overviews are crucial parts of the information retrieval process, since such processes present the majority of information
2322
Rastocny K., Tvarozek M., Bielikova M.: Web Search Results Exploration ...
to users during a search session. After identifying suitable search results in a results overview, users typically proceed to explore individual search result details. Existing results overview and result detail view approaches can be viewed from these perspectives:
Generation – how are data and metadata about results organized to generate the overview;
Visualization – how are the data and metadata visualized to provide users with maximum information while minimizing information overload;
Interaction – how, if at all, can users interact with the results overview. 2.1
Generation of Results Overview and Result Views
The capabilities of search results overviews depend on the amount of metadata available for their generation. These can range from large heterogeneous spaces, like the Web, to closed, highly structured relational databases in digital libraries with strong semantics. Based on these properties we distinguish three main types of data:
Structured data consist of a thorough interlinked metadata structure associated with primary resources (i.e., images, multimedia, or even web pages). They are most often found in digital libraries or relational databases (that can have a webbased frontend) or in the Semantic Web. Structured data can be visualized by attractive hype graphs [Lanzenberger et al. 10], used for results overview personalization [Tvarožek and Bielikova 10], etc.;
Semi-structured data usually consist of unstructured data for which some metadata are available that provide a makeshift structure or simple organization of the data based on some common attributes. Semi-structured data are often found in the open web (e.g., in form of folksonomies, tags, ratings, etc.) or in less organized relational databases. Examples of metadata for web pages include tags, recency and file type; for images attributes such as resolution, content type and creation date/time/place. One possibility how to use web page metadata (e.g., clicks streams logs) is personalized re-ranking search results [Ahmed et al. 09];
Unstructured data typically include generic web pages and/or plain multimedia content (images, audio or video) where little to no metadata is available. Without metadata, plain content can be presented only in its raw form. This problem is addressed via multiple metadata mining techniques e.g., ontology learning [Hazman et al. 11]. Similarly to the generation of a results overview, the generation of views for exploring individual search result details depends on their content type and the amount of available metadata:
Individual results in unstructured data are typically explored via content type specific viewers (e.g., web browser, image viewer, video player). Exploration of results usually corresponds to next/previous style navigation or in case of interconnected web pages to browsing hyperlinks;
Rastocny K., Tvarozek M., Bielikova M.: Web Search Results Exploration ...
2323
Browsers of semi-structured data take advantage of limited metadata availability to provide improved visualization and browsing of content. This often includes rendering of the actual content and an additional table-based visualization of result attributes via label/value pairs. Where attribute semantics are known, specialized visualizations are used to provide more intuitive interaction (e.g., map-based visualization of GPS coordinates) or links to other related content (e.g., other images at that location) [Berners-lee et al. 06];
Exploiting metadata available in structured data browsers often initially shifts focus from the actual content (text/images/etc.) to exploration of the associated metadata and switching to specialized content browsers once the desired content has been located. This enables the creation of advanced browsers taking advantage of the metadata to create for example cluster-based, graph-based or map-based views of result properties and relations. Since our interest is the use of metadata to improve search result exploration, we do not go into detail of content type specific image/video/audio and web browsers for unstructured data and focus on approaches for semi-structured and structured data. One must note that any kind of interlinked structured data is essentially a graph structure usually with nodes corresponding to entities and edges corresponding to relations respectively. An example relationship in the audio domain might be “Ludwig van Beethoven” isComposerOf “The ninth symphony”. This is analogous to a triplet in the Semantic Web, where “Ludwig van Beethoven” corresponds to the subject, isComposerOf to the predicate and “The ninth symphony” to the object. Moreover, the Semantic Web often explicitly defines a meta-layer above the actual data in terms of classes (e.g., Composer or Composition) and properties (e.g., isComposerOf). 2.2
Visualization of Results Overview and Result Views
Currently, most search engines employ text-based visualization of search results where text or other (meta)data corresponding to individual results are rendered in lists or tables. Advanced or experimental search modes sometimes use graphical visualization of search results via maps, graphs, histograms etc. The most used text-based search result overview visualizations include:
List-based result overviews used by most keyword-based web search engines like Google or Bing. These are displayed as linear paginated lists of search results usually containing short snippets of text from target web sites. The ranking of results mostly defaults to ‘relevance’ and cannot be changed;
Table-based result overviews used by many database driven search engines (e.g., in online shops) where results are shown in a paginated table of search result attributes. Ranking is usually based on popularity or other attributes of the results (e.g., price, availability);
Facet-based results overviews used by advanced faceted browsers that in addition to traditional list-/table-based search results overviews include a set of facets that describe the attributes of the entire results set and not just the first page of results as in previous approaches. The facets correspond to a faceted (multidimensional hierarchical) classification of the information space and
2324
Rastocny K., Tvarozek M., Bielikova M.: Web Search Results Exploration ...
enable users to gain an overview of the entire results set and further refine the query simultaneously [schraefel et al. 06]. Graphical search results overview visualizations include:
Map-based results overviews used for visualization of geographical data (e.g., hotel locations in Booking.com, photo geo-tagged in Panoramio) or to show aggregated data or distributions for entire regions;
Histogram-based results overviews used to visualize distributions of search results attributes or time-based data (e.g., publication download counts over time). A special type of histogram-based results overview is provided by faceted browser – Elastic lists [1], which visualize weight proportions of facet values [Stefaner et al. 08];
Cluster-based results overviews show groups and hierarchies of results graphically (similarly to facets, which do the same via text). These groups are obviously predefined by domain expert (e.g., in case of Pivot project [2]) or built by clustering algorithm from results metadata (e.g., from keywords extracted from snippets provided by search engines in case of IGroup [Jing et al. 06], or Yippy [3]). Different results overviews are often combined together to give users different views on results. The VisGets system [4] displays these visualizations (list-based, tag-based, map-based and histogram-based results overviews) in one view. VisGets coordinates user actions in all overviews, while it visualizes dependencies among overviews by highlighting of affected results in the other overviews [Dörk et al. 08]. Bozzon, et al. choose a different approach and present different results overviews in separate specialized tabs [Bozzon et al. 11]. This visualization hides some details from users, but decreases information overload allowing users to select the type of information they want to see. While results overviews visualization can be customized for specific domains, an exploration of a single search result is most often performed in one of these ways:
Table-based visualization, which renders flat textual label/value pairs of result attributes. Extensions to this approach include the generation of links to related resources in values where applicable or the expansion of values into visualizations of associated resources effectively resulting in a nested table of label/value pairs. Information overload occurs for results with many attributes or relations or when too many values are expanded;
Graph-based visualization, which natively renders the aforementioned graph structure as a set of nodes and edges. The view usually starts with the explored search result in the center showing only its attributes (either as edges to literal nodes, inside the center node itself or as a tooltip) and relations (as edges to other unexpanded nodes). Users can expand additional nodes, compare resources and pan the view to shift focus to other resources. However, graph[1] http://well-formed-data.net/archives/54/elastic-lists [2] http://www.microsoft.com/presspass/features/2010/feb10/02-11pivot.mspx [3] http://search.yippy.com [4] http://innovis.cpsc.ucalgary.ca/Research/VisGets
Rastocny K., Tvarozek M., Bielikova M.: Web Search Results Exploration ...
2325
based views often quickly become too complex due to information overload and node layout issues. Moreover orientation support albeit crucial is often limited as the view can rearrange itself to accommodate new nodes confusing users. To counteract information overload, nodes are sometimes hierarchically clustered resulting in cluster-based visualization that groups similar nodes at different levels of abstraction [Herman et al. 00]. 2.3
Interaction with Results Overviews and Result Detail Views
Historically, the interaction with search results was virtually non-existent and limited to selecting a result for further exploration (i.e., clicking it). Exploratory search approaches as well as interactivity of Web 2.0 and social applications extended the interaction options to include:
Selection – the generic interaction option to select a result for further exploration;
Rating – the possibility to rate a result thus giving feedback about its perceived value to the user and ideally usefulness for others. This interaction is most often implemented in browsers of homogenous content as e-shops or video portals;
Previewing – the option to preview more (relevant) information about the result without actually having to select and explore it manually. Previewing of a result is usually mapped to the ‘mouse over’ action, when a control with detailed information about a result is displayed (e.g., Google Images);
Refinement – the option in faceted browsers to further refine the current results set via facets. For example, some keyword-based search engines also include faceted refinement of results via additional metadata (e.g., freshness) or based on search type (e.g., image, shopping). In more database-driven applications (e.g., online shops) faceted refinement of results is often possible based attributes of search results as well as other metadata. Each of search results visualizations can optionally be augmented with previews of the actual content such as image thumbnails or video screenshots, and data type specific visualizations of location (maps) and time (calendars/timelines). Typical interaction options include:
Scrolling and panning – horizontal movement in the visualized information space at a constant abstraction level to explore other related resources;
Node/cluster expansion/collapsing – vertical movement in the visualized in formation space either providing more or less details about particular resources;
Zooming – changing the scope of the visualized information to get a better overview of the entire visualized information space typically without changing the level of abstraction. User interaction with the aforementioned search results visualizations consists of successive steps comprising a combination of scrolling/panning, expansion/collapsing and zooming in/out until users satisfy their information need. But most of these visualizations are independent, narrowly focused on specific type of information so their usage for seeking different types of information is ineffective and uncomfortable
2326
Rastocny K., Tvarozek M., Bielikova M.: Web Search Results Exploration ...
for users. If visualizations support adaptive interoperability and natural switching of different views on explored information, one tool will almost completely cover all possible types of desired information and almost all user specific seeking strategies. These visualizations could be naturally interconnected by zooming, whereby users’ zooming activities lead to new views with a different granularity of the presented information. Zooming activities are already often used in different information systems, but still for switching or enrichment of views aimed to same goals. E.g., by zooming into a place on the map, continents view is firstly switched to more detailed landscape view with added smaller rivers and roads and after next zoom in, photos from the zoomed on place are displayed.
3
Zoom-Based Results Navigation
We combine the aforementioned visualization and interaction approaches into a single navigation paradigm to improve overall user experience during search results exploration. We integrate two core visualizations into the proposed navigation paradigm which reflects users’ actions during search session: 1. Visualization of search results – helps user orientation in a set of results provided by a search engine; 2. Visualization of related results – allows users to explore detailed information. Users seamlessly navigate between these views via zoom which is performed via the mouse wheel and zoom-in/out buttons like in map or photo viewers, which are already familiar to many users. This makes it easy for users to identify the desired results in a set of results provided by a search engine and find out more detailed information about the identified result and about results related to it. The main idea of interconnecting search results overview and exploration into one paradigm, in which users use the same interaction principles, is better supporting domain exploration and learning. Thus users find the initial result whose features partially satisfy the user’s requirements via the visualization of search results. Thereafter the visualization of related resources allows users to naturally learn and understand its unknown or more obscure features and also helps users to find more satisfying results. 3.1
Visualization of Search Results
Users often refine their queries after quick inspection of the provided results in the first page of a search engine. They repeat this refinement until they discover a suitable result or they give up on the search session [Levene 10]. Users’ success and spent time depend on their understanding of the results, which is markedly influenced by the form of results presentation. Since it is not possible to present all results to users, we present results clustered into hierarchical clusters. To preserve readability, we allow up to nine clusters in one level based on the general rule – seven, plus or minus two items [Miller 56]. Clusters are built by standard clustering algorithms (e.g., c-means algorithm). First, properties of results used for computing the similarity of results and for labeling of clusters must be specified. For unstructured data keywords are often used and can
Rastocny K., Tvarozek M., Bielikova M.: Web Search Results Exploration ...
2327
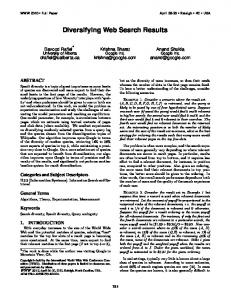
be extracted from snippets [see section 2.2]. Our clustering approach for structured data is described in section 4.1.2. It works reasonably well also for unstructured data after their enrichment by lightweight semantics (e.g., tags or keywords). We visualize the created clusters as labeled boxes, in which the most prominent sub-clusters with representative results are displayed [Figure 1]. This visualization allows users to easily and quickly understand clusters without the necessity of looking into clusters. Users can browse results in clusters by zooming into clusters or by double clicking their labels, which shows clusters from next level. If the zoomed in cluster does not have any sub-clusters, all results from the cluster are displayed. Image Computer Graphics Visualization (computer graphics) - Wikipedia, the free encyclopedia en.wikipedia.org/wiki/Visualization_(computer_graphics) Visualization is any technique for creating images, diagrams, or animations ...
Visualization and Graphics at UC Davis
a)
www-graphics.stanford.edu Stanford University. Research areas include volume rendering, rendering algorithms and ...
Visualization tools ITT Visual Information Solutions, Image Processing & Data Analysis www.ittvis.com/ ENVI, IDL, and IAS are the premier software solutions for image processing, analysis and
VTK - The Visualzation Toolkit www.vtk.org/ The Visualization ToolKit (VTK) is an open source, freely available software system for 3D
Image Computer Graphics
Visualization tools
b)
Figure 1: Examples of a cluster and its sub-clusters visualization generated from a) website results; b) image results of the search query “Visualization” 3.2
Visualization of Related Results
Our cluster-view shows basic information about results, which we deemed insufficient. We address this via the visualization of related results which allows users to explore related results and therefore supports users who seek more details about the discovered result or answers to new questions which arise. One of the greatest concerns during result exploration is becoming “lost in hyperspace”, i.e. losing track of the original purpose of the exploration sessions. To prevent this problem, a user has to know answers to the following questions at each phase of the exploration process [Nielsen 00]: 1. Where am I relative to my initial result?
2328
Rastocny K., Tvarozek M., Bielikova M.: Web Search Results Exploration ...
2. Where did I come from and how can I return back? 3. Where can I go to now and how can I achieve my goal? We support exploration of related results via visualization of graphs of related results. At the beginning of an exploration session, the initial result (found within the original set of search results) is displayed in the middle of the graph and related results are displayed around it. As related results we consider e.g. websites linked from the initial web site or results with common properties. Users interact with this graph by zooming into or double clicking on results, while each zoom in action adds related results to the zoomed in result [Figure 2]. The history of users’ actions stays visible in this form of navigation, which answers the first two questions. Navigation by graph visualization also displays relations between results thus helping users to better understand the explored information space and answering to the third question.
Figure 2: Graph visualization of image results. Oriented edges represent sequence of navigation actions, while gray edges represent possible ways how to continue in exploration and black edges represent the user’s previous path through the graph Visualizations of graphs often struggle with readability and clarity. These problems are mainly caused by a quick increase of the number of results presented in the graph. Too many displayed results complicate future navigation decisions. We address this by extending simple graph visualization with support of tools that decrease the amount of presented information, make the graph more concise, and help users to decide how to continue in navigation:
Node (results) clustering – connects nodes with common incident nodes to one cluster node, what markedly decrease the number of nodes in the graph;
Node marking – users can mark nodes with marks that specify whether newly added nodes (results) have to or may not be incident with the marked nodes;
Personalization – results, which are likely uninteresting for users in the context of the current navigation session, are automatically filtered out;
Next actions recommendation – nodes likely leading to the desired information, are highlighted.
Rastocny K., Tvarozek M., Bielikova M.: Web Search Results Exploration ...
4
2329
Case Study: Image Exploratory Browser
We describe an open information space case study for a multimedia ontology. For this case study we employed our faceted browser Factic [Tvarožek and Bielikova 10], which allows users to search in a repository via facets generated from an ontology. We have extended Factic with search results exploration via hierarchical clusters generated from a faceted search results set and with zoom-based navigation [Rástočný et al. 11]. 4.1
Cluster-Based Navigation
Factic provides two types of cluster-based navigation. The first type is navigation via facet-based clusters which correspond to facets generated from properties of objects in the ontology. This type of navigation allows users to create and refine facet-based search queries. The second type is navigation via hierarchical clusters of search results, which simplifies search results exploration and understanding for end users. 4.1.1
Facets Generated from the Ontology
Facets can be generated by fully autonomous approaches based on knowledge extraction from ontologies [Teufl and Lackner 11]. But these approaches often have high time and memory complexity and they need to be re-executed after each modification in ontologies. Therefore Factic provides facet generation as a semiautomatic algorithm, which has to be initialized by a human expert with facets specifications consisting of four templates [Tvarožek 11]:
A facet template specifies the overall type and behavior of the facet and its corresponding pattern in the domain ontology (i.e., how its label is generated and whether its restriction values are ontology instances, classes or a mix of both);
A restriction template defines how individual restrictions in the facet are constructed and mapped onto the domain ontology (i.e., how restriction labels are created and whether a flat enumeration of values or a hierarchical tree of restrictions is to be generated);
A query template describes the mapping of facet restrictions to database queries which are used to filter results to a specific cluster based on the facet (i.e., which domain properties link search results to restrictions and how SPARQL queries are constructed to find results);
A visualization and interaction template binds the facet to the graphical user interface (i.e., defines which GUI controls are used for facet visualization and user interaction; while our prototype employs lists of textual values, other interaction styles include sliders, calendars, maps, tag clouds, etc.). For example, a simplified informal facet specification might look like this:
Facet template: instance facet based on instances of the class Author using the instance property rdfs:Label as the user interface label of the facet;
2330
Rastocny K., Tvarozek M., Bielikova M.: Web Search Results Exploration ...
Restriction template: flat instance enumeration of Author instances (resources associated via rdf:type with the class Author), use instance property rdfs:Label as the user interface label for facet values (restrictions);
Query template: direct relation between search results and restriction via the property hasAuthor (i.e., corresponds to the SPARQL query pattern {search result} property {restriction}, e.g. {search result} hasAuthor {michalTvarozek});
Visualization and interaction template: list of textual values (this corresponds to a user control “template” that is fed with data and used in the GUI to interact with the user). After human initialization (with the abovementioned templates), facets are automatically generated from the underlying ontology and displayed to users. In the case of Factic, we present facets as named lists of values [see Figure 3]. When a user selects a facet value, a new database query is built from the facet’s query template by application of the selected value and new set of results is retrieved from the repository. After that, facet value ranges are restricted to values, which are applicable to the new results set.
Figure 3: Visualization of facets generated from the ontology in Factic. Facets (on the left) with their value ranges are visualized as named lists. Selected values, which are transformed to search queries are displayed above the results This search approach always displays relevant search results properties (facets with possible values) and effective search results exploration by selecting facet values [Fagan 10]. But it does not show relations between facets (e.g., how a selection of specific value in one facet affects value in another facet) and examples of results to users. 4.1.2
Hierarchical Clusters of Search Results
Navigation issues of faceted browsing are solved by search results classification into hierarchical clusters, which uses semantic properties of search results to generate clusters and thus does not have to be predefined by domain specialists. We visualize the generated clusters along with results as named boxes with results examples [see
Rastocny K., Tvarozek M., Bielikova M.: Web Search Results Exploration ...
2331
Figure 4]. Cluster names are composed from common semantic properties of results in a cluster and most representative results are used as examples. To improve overall readability, we also present four most valuable clusters from the next level. When users double click on a cluster, clusters for the next two levels are displayed.
Figure 4: Visualization of hierarchical clusters. Each box represents one cluster. Nested boxes represent clusters from lower levels of hierarchy We generate the cluster hierarchy via a customized algorithm based on the hierarchical-hyperspherical divisive fuzzy c-means algorithm (H2D-FCM) [Bordogna and Pasi 09]. We chose the hierarchical fuzzy algorithm for two main reasons:
It can quickly classify results into clusters in the first levels, which are presented to users and calculate clusters for deeper levels, while users are exploring the presented clusters (facets);
Fuzzy clustering creates more natural results classification into clusters. In addition, the selection of a proper threshold value (≤ 0.5) leads to classification of results on the clusters borders into multiple clusters, so users do not lose information if an optimal number of clusters on the first level has not been selected (e.g., as a consequence of computational costs). Our clustering algorithm works in six steps: 1. Building of a feature vector – we use a feature vector of semantic properties of the clustered search results. Because these properties have discreet Boolean values (e.g., a photo has or has not been created by a Nikon camera), the number of feature vector dimensions is growing rapidly with the number of results (e.g., in our dataset we obtain more than 700 properties for 100 results). This negatively affects the effectiveness of the clustering algorithm and the quality of clusters. For these reasons we optimize the feature vector by removing properties associated with almost all or only few results (these properties would lead to one giant or many tiny clusters) and properties, which are uninteresting for users (clusters based on these properties have no added value for users); 2. Determine the number of clusters in the first level – the number of clusters in the first level is calculated by (1), where is the number of clusters and is
2332
Rastocny K., Tvarozek M., Bielikova M.: Web Search Results Exploration ...
the dimension of the features vector. We limit the number of clusters to 9 in order to overloading users with information [Miller 56]; = min 9,
2
(1)
3. Initialize cluster prototypes – cluster prototypes are feature vectors with one active dimension (a semantic property). During selection of these vectors, the number of search results with the selected property and distance of the prototyped clusters are considered; 4. Construct clusters via fuzzy c-means clustering; 5. Generate clusters labels – labels of clusters are generated from semantic properties in their prototype feature vectors; 6. Create clusters on next levels – nested clusters are built by the original H2DFCM algorithm, with a maximum of 9 clusters per level. Once users discover the desired information, they ask new questions (e.g., when a user has found a photo of a horse, he often wants to explore more photos of horses). To satisfy evolving exploration goals, users can start a new search session and or continue in the current session by exploring similar or related results to a previously identified result. We propose the second possibility as more effective and comfortable for users, because new exploration goals usually are closely related to previously identified results. We address this by zoom-based navigation in the graph of related results, which visualizes relations between results. 4.2
Zoom-Based Navigation
Zoom-based navigation in graphs simplifies the understanding of the abstract information space by end users. Additionally, graph visualization is an attractive way to visualize relations. But tools which utilize graph views struggle with graph readability and clarity especially for large information spaces. To address these issues, we employ a force-based layouting algorithm, which allows us to smoothly visualize modifications in graphs. It also generates symmetric graphs, which are more acceptable for users [van Ham and Rogowitz 08]. We also address information overload via leveled graph visualization for different degrees of detail and extensions that decrease the number of nodes in the graph and improve user orientation based on results clustering, attributes marking, next action recommendation and user adaptation. 4.2.1
Graph Visualizations
We propose two graph visualizations as levels of abstractions, which can be perceived by end users as zooming, in order to improve end-user usability. To increase this effect, we subordinate the most of user’s actions to zooming via the mouse wheel and zoom-buttons, similarly to other zoom-based tools such as maps or image viewers. So a transition between them is natural and easily understandable. The first proposed visualization is the attributes graph, which is shown after zooming onto an identified result. At the beginning, the graph consists of one node
Rastocny K., Tvarozek M., Bielikova M.: Web Search Results Exploration ...
2333
representing the result and several nodes around it, which represent the result’s attributes. Users can explore new results by expanding an attribute node, which adds new results with this attribute to the graph (represented by results thumbnails). Attribute nodes connect results’ properties together with properties’ values [Figure 5]. This way, we allow users to compare results directly through one node, what makes the graph more readable and understandable. This visualization does not allow straight interaction with property values. For example, if a user has found a photo, which was taken by Adam, this person is joined with the property Author, so the user cannot find photos of Adam, i.e. associated with the same person via a different property. We address this with our second visualization via RDF graph – the graph of RDF triples from the multimedia ontology. Users switch view to this visualization by naturally zooming into an already expanded attribute node. This transition is visualized to users via division of attribute nodes into two nodes – property node and value node [see Figure 5]. RDF graph visualization tools traditionally display types of properties directly on edges between subjects and objects (e.g., IsaViz [ 4 ]) or they use different visualizations of edges for properties, while users see details about properties after selection of subject or object (e.g., RDF Gravity [ 5 ]). Both these RDF graph visualizations add some additional meaning to edges, so it is not enough for users to read only nodes; users also have to understand the meaning of edges. In addition, the second visualization divides information about properties into two parallel views where users have to compare a graph with a list of results’ properties. Our approach with properties visualized as nodes does not change the meaning of edges and gives better interaction possibilities that are the same as in the attribute graph.
Figure 3: Visualization of the attributes graph showing fewer nodes improving readability (left) and the RDF graph showing attributes of objects with the values of the original object attributes (right). Green (thumbnailed) nodes represent results and blue nodes represent results properties [4] http://www.w3.org/2001/11/IsaViz/ [5] http://semweb.salzburgresearch.at/apps/rdf-gravity/
2334
Rastocny K., Tvarozek M., Bielikova M.: Web Search Results Exploration ...
Hide Attribute marking checkbox
Lock button
Figure 4: Control elements of a node are shown on mouse hover over node This graph has more user interaction options, but the results have to be perceived through three nodes (the property node of the first result, the value node and the property node of the second result), which conventional users are not used to. Besides node expansion, which is performed by zooming into or double clicking on a node, we provide three additional interactions with nodes via controls on the node itself [see Figure 6]:
Node hiding – the node and its connections are removed from view; Node locking – prevents change of the node’s position by layouting algorithm; Node marking – marks the node via a three-state check box [see section 4.2.2]. We devised user interaction with the graph in such way that users can perform all their actions right in the graph only with a computer mouse. This decreases cognitive user load and the probability of losing navigation context by looking around the interface in order to find the necessary tool button. 4.2.2
Attributes Marking
Node expansion can introduce a lot of new nodes into a graph, yet only a subset of these is usually of interest to the user. To allow users to directly affect properties of newly added results, we propose the concept of attributes marking, which allows users to pre-filter new results by marking attribute nodes with one of tree marks, which set up additional restrictions for new results:
Wanted – newly added results must have all attributes with this mark; Unwanted – newly added results must not have any attribute with this mark; Allowed – newly added results are not restricted with these attributes. 4.2.3
Personalized Filtering of Nodes
In addition to attributes marking that provides manual node filtering, we also perform automatic pre-filtering of potentially uninteresting results and attributes nodes, which are displayed after node expansion. We base user adaptation on a model of users’ interests, which stores interest weights of resources (results and attributes’ values) and predicates (attributes’ types, properties). Updates to weights of interests in the model are caused by users’ interaction with results and their attributes in graph visualization. Changes of these weights occur, when users perform these actions:
Hide a result node – the weight of the result is decreased by one; Hide attribute node – weights of the attribute’s type and attribute’s value are decreased by one;
Result node expansion – the weight of the result is increased by one;
Rastocny K., Tvarozek M., Bielikova M.: Web Search Results Exploration ...
2335
Attribute node expansion – weights of the attribute’s type and attribute’s value are increased by one. The same action is performed for all marked attributes. To include changes to user interests over time, we perform degradation of interest weights at regular intervals, which means that all negative interest weights are increased and all positive interests weights are decreased by one. 4.2.4
Results Clustering
Another way to decrease the number of displayed results in the graph is results clustering, when newly added results are not displayed separately, but are wrapped by cluster nodes. We group results with common attributes displayed in a graph to one cluster node. This allows users to gain an overview of results categories in the context of known (displayed) information, choose an interesting results subset and interact with it instead of overloading with the sheer number of result nodes. Clustering results also increases performance of the layouting algorithm by lowering overall node count. We visualize cluster nodes as a matrix of thumbnails of randomly selected results from clusters in the attribute graph and as ellipses labeled with results types in the RDF graph [Figure 5]. To give better visual information about the size of a results set covered by clusters, we logarithmically size them based on the number of results.Interaction with cluster nodes is similar to interaction with other nodes with one exception. Zooming into a cluster node does not expand this node, but displays results in the cluster by means of facet-based navigation. Users can explore results in this view, easily identify results which are interesting and extract them from the cluster by double clicking [see Figure 7].
Figure 5: A result extraction from a cluster node 4.2.5
Next Action Recommendation
In addition to the previously described extensions focused on increasing readability by removing information (nodes) from the graph, we also propose next action recommendation to provide user guidance in the graph by highlighting nodes, interaction with which will likely lead to the desired information. Next action
2336
Rastocny K., Tvarozek M., Bielikova M.: Web Search Results Exploration ...
recommendation is based on query flow graphs [Boldi et al. 08], from which we derive an activity flow graph by substituting queries by sequences of actions. Activity flow graphs are built separately for each session, whereby we collect four base activities: node expansion and collapsing, marking and hiding. Each node in the flow graph contains a normalized action sequence, so that all action sequences that generate equivalent navigation graphs have the same representation. If a situation where a new actions sequence has the same representation as a previous one occurs, the previous action sequence is set as the active node (active action sequence). Edges in activity flow graphs represent transitions between action sequences by application of one action. Edge weights are set to 1 by default. When the last action sequence in an active node of activity flow graph has led to details about a result, all edge weights on the path to the root of the activity flow graph are changed to 2. An example of the construction of an activity flow graph is presented in Table 1. Recommendation based on query flow graphs employs graph comparison by determining of their distances [Boldi et al. 09], [Bordino et al. 10]. We utilize this in our action flow graphs, where we compare action flow graphs (that are built from actions of all users) only by paths from active nodes to their roots. Our recommendation based on action flow graphs is based on the premise that users, who at same point performed similar actions, have similar goals or at least the same subgoals of their exploratory activities. So if we find paths in the history of all users’ activities, that are similar to paths of active users, we can help them make decisions about the next navigation step. While this recommendation could be used to recommend the final results directly, it would also prevent users from understanding relations between the currently explored results and the proposed final results. This happens because users would not have explored the results on the path to the final results and thus would be unable to acquire the necessary knowledge about the explored domain.
No
Action
Normalized action sequence
1.
Expansion of the node N1
a1 = [+N1]
2.
Expansion of the node N2
a2 = [+N1+N2]
3.
Expansion of the node N3
a3 = [+N1+N2+N3] a4 = [+N1+N2+N3-N2] = [+N1+N3] a5 = [+N1+N3-N3] = [+N1] = a1
4.
Roll up of the node N2
5.
Roll up of the node N3
6.
Expansion of the node N4
a6 = [+N1+N4]
7.
Display of details of the node N5
a7 = [display(N5)]
a
1
[2]
[1] a
6
a
2
[1]
[2] a
7
a
3
[1] a
4
Table 1: Example of activity flow graph construction showing the final graph
Rastocny K., Tvarozek M., Bielikova M.: Web Search Results Exploration ...
2337
Based on this, we count weights of possible next actions by equation (2), where w(ai,aj,gk) is the weight of the action ai in the transition from the action aj for the graph gk (the graph, for which is counted weight of the action ai), G is the set of all possible action flow graphs, c(aj,gk,gl) defines the number of nodes with same action sequences in graphs gk and gl from the action aj to graph’s root, h(aj,gk) is the depth of the action aj in the graph gk and value e(aj,ai,gl) is the weight of transition edge from the action aj to the action ai in the graph gl. ,
,
,
= /
,
, ,
,
, ,
(2)
Computed weights of possible actions following the last user action (aj in equation(2)) are sorted and the first three actions with the highest weights are selected and nodes, with which they interact, are highlighted. 4.3
Scenario
In the real world, users start their information seeking session mostly with a more or less concrete goal. In this scenario,
a user wants to see photos from an event in Beijing. Therefore he selects “Place Beijing” via facets. After that he notices a group of photos with the tag “Great Wall of China” [Figure 8].
Figure 6: Clusters generated over photos from Beijing with examples This subset of results holds his interest, so he previews these photos and notices that his colleagues Pavol Navrat and Michal Tvarozek are together on one photo. He decides
to find photos with Pavol Navrat without Michal Tvarozek at Great Wall of China. So he zooms onto this photo. As a reaction to this action, the view is switched to the attributes graph view [Figure 9]. After that the user marks the attribute node “Shows Michal Tvarozek” as unwanted and node “Shows Great Wall of China” as
2338
Rastocny K., Tvarozek M., Bielikova M.: Web Search Results Exploration ...
wanted and zooms onto the attribute node “Shows Pavol Navrat”. This action adds one new result to the graph [Figure 10].
Figure 7: Attributes graph of the photo with Pavol Navrat and Michal Tvarozek at Great Wall of China Marked as wanted
Zoomed here Marked as unwanted
Figure 8: Searching for a photo with Pavol Navrat without Michal Tvarozek He sees that photos were shot by “Mária Bieliková”, who he does not know. So he tries
to find some photos of her. This can be accomplished by switching to detailed view, which is realized by the RDF graph. So he zooms onto the attribute node “author Mária Bieliková” [Figure 11]. As a reaction to switching views, attribute nodes are split into value and property nodes and values with same relations to remaining nodes are clustered to nodes titled
Rastocny K., Tvarozek M., Bielikova M.: Web Search Results Exploration ...
2339
by types of values (e.g., values “Great Wall of China” and “2008\2008-04-19…” are hidden in the cluster “Resource 2 items”).
Zoom here
Figure 9: RDF graph with details about resource “Mária Bieliková” In the RDF graph view users see one node with nine photos, which is connected with the resource node “Mária Bieliková” through the predicate node “Shows”. By zooming onto this node, photos of Mária Bieliková are shown [Figure 12].
Figure 10: Photos of prof. Bieliková, which were discovered via RDF graph grouped into two clusters – one shows the person Jakub Simko during the event ICupParis, the other shows photos from the place Pittsburgh with people showing facial expressions
2340 5
Rastocny K., Tvarozek M., Bielikova M.: Web Search Results Exploration ...
Evaluation
Our evaluation of the proposed method of web search results exploration is based on the hypothesis, that interconnection of cluster-based navigation and zoom-based navigation decreases the user effort required to identify desired results and increases understanding of the explored domain. For these reasons we implemented a prototype of the faceted browser Factic described in the case study. 5.1
Prototype and Dataset
The faceted browser Factic works with an ontological repository of multimedia content (digital images and videos), which is based on Kanzaki Exif data description vocabulary ([see 6]). The ontology contains about 11,000 digital photos with both manually and automatically acquired annotations, including authors, tags, locations, topics and EXIF metadata. In total, the dataset consists of about 37 classes, 58 predicates and more than 42,000 individuals and 150,000 facts. The server side services provide access to the ontology via a Sesame endpoint and SPARQL and SeRQL queries [see Figure 13], while the Data access layer converts results to objects and caches often accessed objects. The faceted search engine generates facets from the ontology and builds SPARQL queries from faceted queries, a clustering service performs incremental clustering of results. We implemented the client side of the prototype as a Silverlight application which has two main parts: Faceted query builder and Result explorer. Faceted query builder visualizes facets to users and builds faceted queries. Results explorer visualizes results in Cluster or Graph view and loads and caches data from server. 5.2
Experiment Description
We performed the experiment with ten volunteers that had different computer skills. These volunteers were between 20 to 53 years old, while their age average was 30 years. We selected volunteers with the goal to cover web users with different jobs (e.g., student of economics, accountant, professor of automation). The experiment had the form of a qualitative test and was performed at volunteers’ home computers to minimalize influence of an unknown environment on experiment results. Each volunteer received a brief instruction about the basic functionality of our tool for results exploration. During the experiment, volunteers were working with a questionnaire which contained two tasks, whereby the user’s goal was to find specific information. Questions were focused on the prototype’s usability, its graphical user interface, provided functionality and quality of clusters (facets as search results categories). The expected answers to these questions were values from 1 to 5, 1=best, 5=worst, and a short commentary. The main goal of the first task was the familiarization of volunteers with the faceted browser Factic. This task contained small subtasks (e.g., find photos with [tag] foals and then filter out photos with a [tag] mare) with questions (e.g., How many photos have you found?), which helped users to understand the controls and to
[6] http://www.kanzaki.com/ns/exif
Rastocny K., Tvarozek M., Bielikova M.: Web Search Results Exploration ...
2341
reach their goal. Hereby we have acquired feedback about the proposed style of results exploration and the prototype’s usability for inexperienced users. The second task was focused on collecting feedback on the proposed method’s usability for reaching unclear goals, did not provide any guidance and only contained a poor description of the desired results (e.g., How many photos show running foxes on a snowy parcel without trees?). Descriptions of these goals do not contain identified tags or facets. Users had to identify features and types of desired photos in context of the given dataset and create their own strategy to solve the task.
Figure 11: Architecture of the prototype 5.3
Results
During the experiment, we have collected logs about the volunteers’ activities. We have compared the collected logs with reference logs obtained by simulation of the most probable scenario of the tasks’ solutions [see Table 2]. The first task has straightly described steps, thus we used the minimal number of necessary actions as the reference value. Multiple possible strategies exist for the second task, which together with the exploratory nature of the task exclude the use of the shortest strategy as a suitable reference value. We thus evaluated several strategies and selected the most assumed strategy (the strategy with short exploratory steps followed with direct steps to the goal). During the first task, volunteers have performed on average about 76.88% more actions than the reference value. This difference was caused by the users’ exploration of our tool’s features. We have obtained better and more substantial results during the second task. To find the solution of the second task, participants have needed only about 22.5% more actions on average than the reference value. We consider these results as really good, because we selected a group of people who did not know the
2342
Rastocny K., Tvarozek M., Bielikova M.: Web Search Results Exploration ...
used dataset and they had to explore and understand it on the fly. In addition, from users’ actions and comments we conclude, that all unnecessary user actions had exploratory background and that these actions did not lead to loss of users, but they helped users understand the domain and to fulfill users’ sub-goals. Thus we conclude that the proposed visualization and navigation method is easily understandable and useable for real world users even in previously unknown information domains. Based on user answers and the analysis of users’ behavior we determine that ([see Table 3]):
Minimal value Maximal value Average value Standard deviation Reference value Difference
Actions in the 1st task 18 43 28.3 7.9 16 +76.88%
Actions in 2nd the task 5 27 14.7 6.4 12 +22.5%
Table 2: The number of actions performed by volunteers during the experiment
users did not have any problems with interaction with the implemented tool (grade 2.2 ± 0.63), but it was less understandable for participants that the attribute marking checkbox [see Figure 6] had three states (wanted, unwanted and allowed) and most of participants used only unwanted and allowed state (participants simply replaced the wanted state by double clicking on attribute nodes);
graph navigation has been reasonably natural for them (grade 1.6 ± 0.84) and participants correctly predicted consequences of their actions;
graph visualization is readable and clear for users (grade 1.8 ± 0.79) – participants were able to correctly describe how they understand to graphs;
result clusters were correct (grade 1.2 ± 0.42), but participants noticed that some results had wrong classification to clusters. This was caused by errors in the dataset and by unbalanced descriptions of photos in their details. In addition, we noticed that participants naturally filtered out nodes with a distance above two edges from their actual center of interest. This could be utilized in graph visualization by automatic hiding of outlying nodes thus increasing the efficiency of user navigation.
6
Conclusions
We proposed a novel approach for web search results exploration and navigation, in which we combine several search results overview and individual results exploration techniques. We take advantage of user familiarity with zooming and seamlessly transition between our views based on different levels of search results details either via zooming onto results or zooming out to see the big picture.
Rastocny K., Tvarozek M., Bielikova M.: Web Search Results Exploration ...
2343
Volunteer
Easiness of interactivity
Usability
GUI
Quality of clusters
Graph navigation
Clarity of a graph
Readability of a graph
Overall satisfaction
This natural interconnection of different views gives us opportunity to support all users search activities and to join them into one environment with homogenous graphics and control, thus making information seeking more comfortable and attractive for end users. We also proposed a lightweight user model and next action recommendation method as a part of the Semantic Web exploration approach described in our case study. These methods are directly focused on graph-based navigation and suitable for experiments, but they do not make provisions for global user interests and actions. For real world implementations several existing approaches based on globally collected data [Barla 11] can be employed.
1 2 3 4 5 6 7 8 9 10 Min. Max. Average Std. dev.
2 1 2 2 2 3 3 3 2 2 1 3 2.2 0.63
3 1 4 3 1 1 2 2 2 2 1 4 2,1 0.99
2 1 2 2 2 3 2 2 2 2 1 3 2 0.47
1 1 1 1 1 2 1 2 1 1 1 2 1.2 0.42
1 1 3 1 1 3 2 1 1 2 1 3 1.6 0.84
2 1 3 1 2 3 2 1 1 2 1 3 1.8 0.79
1 1 1 1 1 1 2 2 1 1 1 2 1.2 0.42
1 1 1 2 2 3 2 2 1 2 1 3 1.7 0.67
Table 3: Volunteers’ ratings of Factic obtained from the questionnaire We realized a prototype of the proposed approach as an exploratory image browser for a multimedia ontology which we used for automatic facet generation, hierarchical results clustering, multiple graph view generation and personalization based on user’s graph interactions. We evaluated our approach in several experiments with the exploratory image browser Factic with real world users, and discovered these findings based on user activity logs and observations:
The interconnection of different views via zooming is natural for users and users quickly mastered controlling the prototype via zooming – users naturally perceive the zoom in action as looking on an item in more detail (as looking via a larger magnifying glass);
Real world users are able to effectively use the graph visualization – correct answers of the experiment participants and their comments confirm that users
2344
Rastocny K., Tvarozek M., Bielikova M.: Web Search Results Exploration ...
can understand the graph, they compare the results in the graph and they are also able to use the graph for navigation to desired results;
Users typically read only nodes whose distance from the current point of interest is smaller than three. This observation can be utilized to increase graph clarity by directly hiding more distant nodes;
Users consider the proposed approach attractive. This fact is mostly caused by the more interactive results view, compared to the traditional list-based result view, with which users can interact and make it more understandable. Our approach is mainly focused on content, which can also be viewed via small thumbnails (e.g., photos, videos) and is thus less useful for purely textual content, whose title, topics and keywords are main representatives. But the main idea of zooming is also applicable in text-based domains. Graph visualization may be used as a map of similar articles, in which users follow their trail of navigation and also explore other possibilities. The main focus stays in text, while zooming into a text area switches the view to clustered articles with similar content to the zoomed on area. While the evaluation of our approach was performed with a strong-typed ontology, we have not taken advantage of its full semantics. One good candidate for our visualization approach are also regular unstructured web search results. While few of these results are already annotated with semantic annotations (e.g., written in RDFa), the rest can easily be enriched with lightweight semantics sufficient for our approach (e.g., tags, keywords, bag of words). This can be done via techniques of lightweight ontology learning approaches that have already achieved reasonably good results [Wong et al. 12], [Gahrib et al. 12]. We have indirectly proved this in the first task of our experiment in which users manipulated only tags assigned to images. In the experiment, we assumed that if users are only given one type of properties (relations), it will be easier to understand the new form of navigation. We have not observed any problems with our approach and users have not had any problems in locating the expected information during the experiment. Observations from the evaluation and results of research in ontology learning and matching [Martinez-Gil et al. 12] indicate that our approach can be used as an easily learnable form of web search result exploration. This approach based on visualization of clusters and graphs can also be attractive for modern touch-based devices that can utilize it for exploring web search results, users’ content such as photos, videos or other content that can be viewed via thumbnails. Acknowledgements This work was partially supported by the grants Scientific Grant Agency of Slovak Republic, grant No. VG1/0675/11 and the Slovak Research and Development Agency under the contract No. APVV-0208-10 and by the Ministry of Education, Science, Research and Sport of the Slovak Republic within the Research and Development Operational Programme for the project “University Science Park of STU Bratislava”, ITMS 26240220084, co-funded by the European Regional Development Fund.
Rastocny K., Tvarozek M., Bielikova M.: Web Search Results Exploration ...
2345
References [Ahmed et al. 09] Ahmed, S.; Park, S.; Jung, J.J.; Kang, S.: “A Personalized URL Re-ranking Method using Psychological User Browsing Characteristics”; Journal of Universal Computer Science, 15, 4 (2009), 926-940. [Barla 11] Barla, M.: “Towards Social-based User Modeling and Personalization”; Inf. Scien. and Technologies Bul. of the ACM Slovakia, 3, 1 (2011), 52-60. [Berners-lee et al. 06] Berners-lee, T.; Chen, Y.; Chilton, L.; Connolly, D.; Dhanaraj, R.; Hollenbach, J., Lerer, A.; Sheets, D.: “Tabulator: Exploring and Analyzing Linked Data on the Semantic Web”; Proc. 3rd Int. Sem. Web User Interaction Workshop, (2006), 6. [Boldi et al. 08] Boldi, P.; Bonchi, F.; Castillo, C.; Donato, D.; Gionis, A.; Vigna, S.: “The Query-Flow Graph: Model and Applications”; Proc. 17th ACM Conf. on Inf. and Knowledge Mining - CIKM’08, ACM Press, New York (2008), 609-618. [Boldi et al. 09] Boldi, P.; Bonchi, F.; Castillo, C.; Donato, D.; Vigna, S.: “Query Suggestions Using Query-Flow Graphs”; Proc. 2009 Workshop on Web Search Click Data WSCD’09, ACM Press, New York (2009), 56-63. [Bordino et al. 10] Bordino, I.; Castillo, C.; Donato, D.; Gionis, A.: “Query Similarity by Projecting the Query-Flow Graph”; Proc. 33rd Int. ACM SIGIR Conf. on Res. and Dev. in Inf. Ret. - SIGIR'10, ACM Press, New York (2010), 515-522. [Bordogna and Pasi 09] Bordogna, G.; Pasi, G.: “Hierarchical-Hyperspherical Divisive Fuzzy C-Means (H2D-FCM) Clustering for Information Retrieval”; Proc. 2009 IEEE/WIC/ACM Int. Joint Conf. on Web Intelligence and Intelligent Agent Technology, IEEE, Washington, DC (2009), 614-621. [Bozzon et al. 11] Bozzon, A.; Brambilla, M.; Ceri, S.; Fraternali, P.; Vadacca, S.: “Exploratory Search in Multi-domain Information Spaces with Liquid Query”; Proc. 20th Int. Conf. Companion on World Wide Web - WWW’11, ACM Press, New York (2011), 189-192. [Broder 02] Broder, A.:“A Taxonomy of Web Search”; ACM SIGIR Forum, 36, 2 (2002), 310. [Carpineto and Romano 12] Carpineto, C.; Romano, G.: “A Survey of Automatic Query Expansion in Information Retrieval”; ACM Computing Surveys, 44, 1 (2012), 1-50. [Dörk et al. 08] Dörk, M.; Carpendale, S.; Collins, C.; Williamson, C.: “VisGets: Coordinated Visualizations for Web-Based Information Exploration and Discovery”; IEEE Trans. on Visualization and Computer Graphics, 14, 6 (2008), 1205-1212. [Fagan 10] Fagan, J.C.: “Usability Studies of Faceted Browsing: A Literature Review”; Information Technology and Libraries (ITAL), 29, 2 (2010), 58-66. [Gahrib et al. 12] Gharib, T.F.; Badr, N.; Haridy, S.; Abraham, A.: “Enriching Ontology Concepts Based on Texts from WWW and Corpus”; Journal of Universal Computer Science, 18, 16 (2012), 2234-2251. [Hazman et al. 11] Hazman, M.R.; El-Beltagy, S.; Rafea, A.: “A Survey of Ontology Learning Approaches”; Int. Jour. of Computer Applications, 22, 9 (2011), 36-43. [Herman et al. 00] Herman, I.; Melancon, G.; Marshall, M.S.: “Graph Visualization and Navigation in Information Visualization: A survey”; IEEE Transactions on Visualization and Computer Graphics, 6, 1 (2000), 24-43. [Jansen et al. 00] Jansen, B.J.; Spink, A.; Saracevic, T.: “Real Life, Real Users, and Real Needs: a Study and Analysis of User Queries on the Web”’; Information Processing & Management, 36, 2 (2000), 207-227. [Jing et al. 06] Jing, F.; Wang, C.; Yao, Y.; Deng, K.; Zhang, L.; Ma, W.: “IGroup : Web Image Search Results Clustering”; Proc. 14th Annual ACM Int. Conf. on Multimedia MULTIMEDIA'06, ACM Press, New York (2006), 377-384. [Lanzenberger et al. 10] Lanzenberger, M.; Sampson, J.; Rester, M.: “Ontology Visualization: Tools and Techniques for Visual Representation of Semi-Structured Meta-Data”; Journal of Universal Computer Science, 16, 7 (2010), 1036-1054.
2346
Rastocny K., Tvarozek M., Bielikova M.: Web Search Results Exploration ...
[Levene 10] Levene, M.: “An Introduction to Search Engines and Web Navigation”; WileyBlackwell, John Wiley & Sons, Inc., New Jersey (2010). [Miller 56] Miller, G.A.: “The magical number seven, plus or minus two: some limits on our capacity for processing information”; Psych. Review, 63 (1956), 81-97. [Marchionini 06] Marchionini, G.: “Exploratory Search: From Finding to Understanding”; Communications of the ACM, 49, 4 (2006), 41-46. [Martinez-Gil et al. 12] Martinez-Gil, J.; Navas-Delgado, I.; Aldana-Montes, J. F.: “MaF: An Ontology Matching Framework” ”; Journal of Universal Computer Science, 18, 2 (2012) 194-217. [Nielsen 00] Nielsen, J.: “Designing web usability: the practice of simplicity”; New Riders Publishing, Indianapolis (2000). [Rástočný et al. 11] Rástočný, K.; Tvarožek, M.; Bielikova, M.: “Supporting Search Result Browsing and Exploration via Cluster-Based Views and Zoom-Based Navigation”; Proc. IEEE/WIC/ACM Int. Conf. on Web Intelligence and Intelligent Agent Technology (WIIAT), IEEE CS, Washington (2011), 297-300. [schraefel et al. 06] schraefel, m. c.; Wilson, M.; Russell, A.; Smith, D.A.: “mSpace: Improving Information Access to Multimedia Domains with MultiModal Exploratory Search”; Communications of the ACM, 49, 4 (2006), 47-49. [Stefaner et al. 08] Stefaner, M.; Urban, T.; Seefelder, M.: “Elastic Lists for Facet Browsing and Resource Analysis in the Enterprise,” Proc. 19th Int. Conf. on Database and Expert Sys. Applications, IEEE, Washington, DC (2008), 397-401. [Teufl and Lackner 11] Teufl, P.; Lackner, G.: “Knowledge Extraction from RDF Data with Activation Patterns”; Journal of Universal Computer Science, 17, 7 (2011) 983-1004. [Tvarožek 11] Tvarožek, M.: “Exploratory Search in the Adaptive Social Semantic Web”; Inf. Scien. and Technologies Bul. of the ACM Slovakia, 3, 1 (2011) 42-51. [Tvarožek and Bielikova 10] Tvarožek, M.; Bielikova, M.: “Factic: Personalized Exploratory Search in the Semantic Web”; Proc. Web Engineering, 10th Int. Conf., ICWE 2010, Springer, Berlin (2010), 527-530. [van Ham and Rogowitz 08] van Ham, F.; Rogowitz, B.E.: “Perceptual Organization in UserGenerated Graph Layouts”; IEEE Trans. on Visualization and Computer Graphics, 14, 6 (2008), 1333-1339. [Wong et al. 12] Wong, W; Liu, W.; Bennamoun, M.: “Ontology learning from text”; ACM Computing Surveys, 44, 4 (2012), 1–36.