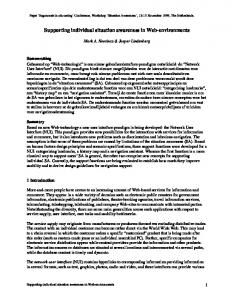
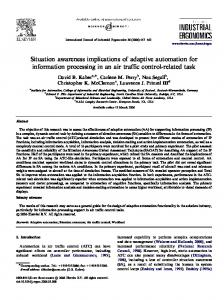
A laptop computer with a mouse was employed for .... Mini. Prop. Std. Figure 3. Overall SA across display conditions proportional icons, although four ...
Supporting Situation Awareness Under Data Overload in Command and Control Visualizations L.D. Strater, L.A. Faulkner, J.R. Hyatt, & M.R. Endsley SA Technologies, Inc. 1315 Black Oak Dr. Carrollton, TX 75007, USA
Abstract Overcoming information overload is a central challenge for supporting information dense environments, such as military operations, some process control systems, and real-time data analysis tasks. This paper describes a study which evaluated concepts for supporting military personnel’s ability to quickly assess needed information in very cluttered Common Operating Picture (COP) displays. The effort focused on the presentation of four possible unit representations on a digitized COP based on ethnographic observations of the way in which Army officers seek to deal with the proliferation of large, overlapping battlespace objects on dense displays. Sixteen U.S. Army Reserve Officer Training Corps (ROTC) cadets monitored a 28 minute simulation that depicted a developing military advance. Cadets viewed each of the four modalities with presentation order counterbalanced between subjects using a Latin squares design. For each modality, cadets responded to a rapid battery of questions about their SA using the Situation Awareness Global Assessment Technique (SAGAT). At the end of the study, participants completed a subjective questionnaire about their representation preferences. While participants prefer current MilSTD 2525B representations, objective SA measures do not support the superiority of this representation. Keywords: experimental study, Situation Awareness, cognition, human computer interaction, usability, Command
and Control
1. Introduction We are living in the midst of a revolution of information technology. With the proliferation of data sources and the increasing digitization of data, operators in many domains are expected to monitor dynamic, constantly updating data from a wide array of sources covering a broad spectrum of operations. This increased information flow is provided to enhance decision-making and human-system performance, yet often, the high flow of data has a deleterious effect on the operator’s understanding of the relevant aspects of
the situation. The tools provided to support task performance are no longer simple tools; they are often amazingly complex, requiring significant amounts of training and experience to master. The challenges are not simply in learning to physically perform a task and mastering the motor skills required for performance, but rather in perceptual and cognitive task mastery. Just as the Industrial Revolution wrought changes in the way people lived and worked, so too is the current Information Revolution producing changes in the way people work and interact with systems. In many workplaces, this has meant a huge increase in
systems, displays and technologies. The problem in this environment is no longer lack of information, but finding, within the mass of data available, those precise bits of information that are needed to make an informed, reasoned decision. A widening gap exists between the tons of data being produced and disseminated, and the individual’s ability to find the right, disparate bits and process them together to arrive at the actual information sought. If we examine research on aviation accidents and performance under demanding battlefield conditions, we see that operators have no difficulty physically performing their tasks, and no difficulty choosing the correct action once they understand the situation, but they struggle with the task of developing and maintaining an understanding of the situation [1, 2] For this reason, researchers are interested in understanding, evaluating and improving the situation awareness (SA) of individuals. Endsley [3] formally defines SA as “…the perception of the elements in the environment within a volume of time and space, the comprehension of their meaning and the projection of their status in the near future.” The definition encompasses several concepts that are central to understanding the SA construct. First, SA is comprised of three levels: perception, comprehension and projection. Level 1 SA, perception, involves the sensory detection of significant environmental cues. Perception is an active process whereby individuals extract salient cues from their environment. By selectively directing attention to the incoming stimuli, important/essential information is attended to while nonessential items are disregarded. Level 2 SA, comprehension, involves integrating information to understand how it will impact upon the individual’s goals and objectives. This includes developing a comprehensive picture of the world, or of that portion of the world of concern to the individual. Level 3 SA, projection, consists of extrapolating this information forward in time to determine how it will affect future states of the operational environment [4]. Level 3 SA combines what the individual knows about the current situation with their mental models or schemata of similar events to predict what might happen next. For instance, a driver approaching a red light might predict that ignoring the light and proceeding into the intersection would result in a car accident. Thus, mental models help ease the cognitive workload required to develop level 2 and 3 SA.
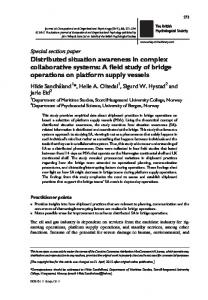
Figure 1. Display modalities investigated were (clockwise from top right) standard, miniature, proportional, and blobs. The current research investigated the issue of information overload in a military command and control (C2) environment. In a fast-paced, dynamic environment such as military C2, it is often difficult to develop a clear picture of emerging events. One significant source of confusion is the density of units being displayed on cluttered Common Operating Picture (COP) displays and the difficulty this information density causes for operators seeking a clear picture of the situation. In particular, current military C2 displays are often difficult to “read” because of stacked and occluded icons on the COP. This phenomenon can be seen in the standard display shown in Figure 1 above. The current research focused on the presentation of unit representations (icons) on the digitized COP. A comparison was undertaken of the effectiveness of current MilSTD 2525B symbology, the military standard for display symbology, with other unit representation options. The options selected for this study, in addition to standard, are miniature icons smaller versions of the standard icons, without the detailed information contained in standard icons, proportional icons - icon size is proportional to unit size (e.g. larger units have larger icons), and blobs depicting physical unit boundaries and dispersion, developed by the U.S. Army Research Lab’s
Computer Information Systems Directorate (see Figure 1 for sample displays). Modalities were selected for investigation based on ethnographic observations of the ways in which officers seek to deal with the proliferation of large, overlapping battlespace objects on dense COPs. The operator needs easy ways to understand relationships among and between units, such as which are headquarter units, which the current military standard does not readily support. They also need to be able to tradeoff the detail of MilSTD 2525B for simpler representations that reduce the substantial symbol overlap and occlusion associated with units in close proximity that render viewability of unit symbols virtually impossible. This study examines the utility of several new approaches that do not “declutter” in the traditional sense (simply eliminating some symbols, thus creating potentially hazardous loss of SA). Instead this effort seeks to convey meaning through variable sizes and proportions, or through the blobology concept developed by the U.S. Army Research Lab’s Computer Information Systems Directorate. The goal is to determine if these other approaches can retain critical battlespace object location and identity information while also reducing clutter and adding much needed data on unit relationships and importance.
2.
Method
2.1 Participants Sixteen United States Army Reserve Officer Training Corps (ROTC) students at the University of Central Florida volunteered for participation in the study. An honorarium was paid into the ROTC student fund as compensation for their participation. Student ages ranged from 18 to 27 years, with a mean age of 22.8 years. Seven participants had no prior military experience, while nine participants had some prior military service time. For those with military experience, the time in service ranged from two years, five months, to seven years. Six of the nine participants with military service time had been operationally deployed, with number of deployments ranging from one to six. Four participants were excluded from the analysis as they did not complete the SA queries at all halts, thus it was not possible to tell which experimental condition they completed immediately
prior to testing when they did respond to the queries. 2.2 Materials Background for the experimental scenario was provided to participants on paper copies of excerpts from a standard format, U.S. Army Operations Order. A laptop computer with a mouse was employed for presentation of the simulation scenario. The 28 minute simulation was divided into four, seven-minute segments. Icon modality was changed in each segment, so each participant viewed each display modality – standard, miniature, proportional and blobs, for one seven-minute segment. In order to provide the broadest possible array of information regarding the quality of participant SA, SA data was collected using the Situation Awareness Global Assessment Technique (SAGAT), a validated, objective measure, along with a subjective assessment of SA. Additionally, NASA-TLX was used to collect subjective workload data; however, that data is not reported here. 1. Participant Biographical Questionnaires. Relevant biographical data was collected from each participant with information about age, rank, educational background, and pertinent military experience and training (see Appendix 1B.) 2. SAGAT. Situation Awareness Global Assessment Technique (SAGAT) was used to measure participant SA during the simulation [5]. Four freezes were inserted into the simulation, one at the end of each segment, to collect SAGAT data. At each freeze, the simulation was stopped, SAGAT queries were administered on the same laptop PC as the simulation, and responses were collected electronically. Response accuracy to the SAGAT queries yields an objective measure of participant SA at the end of each presentation segment. SAGAT queries presented are shown in Table 1, with the possible responses, and the level of SA (1perception, 2-comprehension, and 3projection) of the query. Queries about the status of unit assets were placed into a separate category. 3. Subjective Assessment Forms. SA will also be measured using subjective evaluations forms to determine participants’ subjective assessments of the different visual displays.
Table 1 SAGAT queries administered
Subjective Assessment 8
SA level 1
1
1
1 1-2 Status 1-2 Status 1-2 Status 1-2 Status 2
2 2 2 2 3
Query How many companies in your battalion are in contact? How many platoons in your battalion are in contact? How many enemy elements has your battalion engaged? How many sensors are in OBJ Gold? What companies are not green on vehicles? What companies are not green on troops? What companies are not green on weapons? What companies are not green on supplies? What is your current battalion effectiveness?
Which enemy locations are strongest? Which enemy locations are weakest? Which friendly locations are strongest? Which friendly locations are weakest? What do you expect the enemy to do next?
Response #
7 6
Std Blobs Min Prop
5 4
#
3 2 1
#
0 Liked Best
Liked Least
# A, B, C, D, NA A, B, C, D, NA A, B, C, D, NA A, B, C, D, NA 100%, 90 %, 80%, 70%, 60%, 50%,