David Gelernter. "Generative Communication in. ICS-90/23, Georgia Institute of Technology, May, 1990. Linda". ACM Transactions on Programming Languages.
Supporting the Development of Network Programs Bernd Bruegge Peter Steenkiste School of Computer Science Carnegie Mellon University Pittsburgh, Pennsylvania 15213 Abstract For computation-intensive computations, or applications with heterogeneous components, partitioning the application over a group of computer systems connected by a network is an attractive solution. Unfortunately, programmers who want to do ‘‘network computing’’ face several challenges: the network and attached systems are shared resources with an unpredictable behavior and network communication primitives are often hard to use. The programming environment developed for the Nectar system addresses both problems. It provides simple and efficient communication primitives, and an efficient monitoring kernel that allows both programmers and programming tools to monitor the behavior of the program in the dynamic network environment. Our experience shows that monitoring the progress of applications interactively is both desirable and practical.
1. Introduction A growing number of computer users run their applications not on a single computer system, but on a group of computers. For computation-intensive applications, distributing the application over a number of underutilized computer systems is an economical way or sometimes the only way to get the needed cycles. For other applications the motivation is more fundamental: the application breaks up in tasks that are best executed on different types of computer systems. Traditionally, network performance has limited the range of applications that can be parallelized over a network, but highperformance networks are becoming available, thus creating new opportunities for ‘‘network computing’’. Users who want to distribute their application over a group of computers face several challenges. First, network communication interfaces such as sockets are in general hard to use because they were designed to support system programs (e.g. ftp and telnet). Second, the This work was supported in part by Defense Advanced Research Projects Agency (DOD) monitored by DARPA/CMO under Contract MDA972-90-C-0035, and in part by the National Science Foundation and the Defense Advanced Research Projects Agency under Cooperative Agreement NCR-8919038 with the Corporation for National Research Initiatives.
behavior of ‘‘network computers’’ is inherently less predictable than that of more traditional distributed memory systems, such as hypercubes [22], since both the nodes and the network are shared with other users. The unpredictable nature of the network environment makes the already difficult task of programming distributedmemory computers even more complicated. The dynamic nature of network computers often requires programmers to use a more complex programming model when parallelizing their application. For example, for a lot of applications one can achieve good load balancing in a static, homogeneous environment, by distributing the input evenly across the nodes (domain decomposition). In a network environment however, nodes cannot only have different speeds, but the load on the nodes can change during execution. If the data is distributed statically, it might be necessary to redistribute the data if the load on the nodes changes, or alternatively, the distribution of the work can be done completely at runtime. Depending on the complexity of the application, the partitioning and load balancing can either be done by a programming tool or by the application programmer. The Nectar programming environment provides the primitives that both programmers and programming tools can use to effectively operate in a network environement. Several groups have worked on the problem of using idle machines over the network. The approaches range from informally reserving a number of workstations overnight [9], to a more formal organization, where a set of reserved computers are set up as a multicomputer [16]. The network nodes are typically homogeneous and reserved, thus creating a predictable environment similar to, for example, a hypercube. Several groups have also tackled the problem of providing simple primitives for communicating over a network. Examples are the Linda tuple space [8], the Grail project at the University of Colorado [16], the ESKIT project [17], and the Cosmic environments on Suns [22]. Express [12] supports both communication and synchronization primitives, and postmortem monitoring. Some projects have worked on providing support for a heterogeneous environment [3], but these efforts typically do not directly address the development of network programs.
This paper describes an environment that was designed specifically to support network programming. The environment has been implemented for Nectar, a highspeed multicomputer. Sections 2 and 3 give a brief overview of the Nectar system and the Nectar environment. The following sections provide more details on efficient communication primitives that make network computing more accessible to applications programmers, a flexible monitoring mechanism, and a programming interface that simplifies program execution and development. We conclude with an example and a discussion on future work.
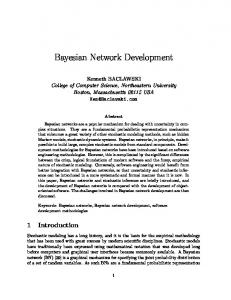
2. The Nectar system Nectar (NEtwork CompuTer ARchitecture) was designed specifically to support large-scale heterogeneous applications [1]. The Nectar net is built from fiber-optic lines and one or more crossbar switches called HUBs (Figure 1). Hosts are connected to the Nectar net through a network coprocessor, called the CAB (communication accelerator board). A prototype system has been in use since January 1989 and it currently supports 26 nodes. The nodes include mostly Sun4 workstations and future nodes will include iWarp systems [4] and the Cray Y-MP at the Pittsburgh Supercomputer Center. The fiber-optic lines operate at 100 Megabit/second and the HUBs are 16x16 crossbars.
Applications
Applications
Tools
BEE
BEE
Nectar Interface Now
Nectar Interface Future
The low latency communication of Nectar, (200 µseconds host-host), and the flexibility of the communication coprocessor make Nectar an attractive system for network computing, and applications groups in the areas of mechanical and chemical engineering, circuit simulation, environmental sciences and vision are using the Nectar prototype for their research [13]. Nectar is also used by computer science researchers to develop tools for network computing.
3. The Nectar Environment The Nectar programming environment consists of two components: a runtime environment for the application and a user interface for executing applications. The runtime environment is shown in Figure 2. At the lowest level, the Nectar Interface (Nectarine) provides primitives to communicate over Nectar and to create tasks on nodes and CABs. These primitives are similar to those found on distributed-memory multiprocessors. The Event kernel (BEE) can be used to instrument the application: events generated by the instrumented code are processed by event interpreters. The events can for example be displayed interactively or they can be archived. Event generation can be adjusted at runtime, thus allowing users to focus on specific parts of the application, while keeping the monitoring overhead low.
4. Network communication The communication interface provided by operating systems, e.g. sockets, is hard to use for non-system programmers. For use in applications we would like simpler communications primitives, similar to the ones found on more tightly coupled distributed memory computers. The interface should also lend itself to an efficient implementation. The Nectar Interface, or Nectarine, was developed for that purpose: it defines simple communication primitives, plus primitives to create tasks on Nectar nodes [25]. Nectarine applications are built up from tasks executing on the hosts and CABs and user-declared buffers located in CAB memory. Tasks communicate by placing messages in buffers (‘‘send’’), where they can be
Host
CAB Nectar net
S
CAB
Host
Results M
Host
CAB
S
Tasks
S
Master() { do { Receive_Imm(Results, ptr, length); /* create new tasks based on results */ while(needed(ptr)) Send_Imm(Tasks, ptr, length); }while (TRUE); }
Slave() { do { Receive_Imm(Tasks, ptr, length); /* execute task */ Send_Imm(Results, ptr, length); } while (TRUE); }
This not only makes it possible to do sophisticated runtime monitoring with minimal impact on the application, but the event streams of different parts of the application can also be combined to present a global picture of the application. In order to make event processing more efficient and flexible, it is broken up into different stages: sensing, generation, handling, and interpretation (Figure 4). Events are generated by event sensors placed in the client program. When an active sensor is encountered, the event generator is called. It collects the components of the event: a node identifier, a time stamp and class dependent information. The event handler then hands the event to each event interpreter that is registered for that event class. Event interpreters can be local or remote. Local event interpreters are invoked through procedure calls, and should be used when event interpretation is fast. Alternatively, the event handler can send the event over the network to a remote event interpreter. Remote event interpreters should be used when information from different parts of the application has to be combined, as is often the case for network programs, or when interpretation is time or space consuming.
Local Interpreter
Client Event Sensor
Event Generator
Event Handler
Remote Interpreter
Figure 4: Event Processing Stages in BEE BEE supports predefined event classes, for example the execution of a procedure, as well as user-defined events, for example important milestones in the application. A variety of event interpreters can be used to display the event stream interactively: a frequency counter, time profiler, and load meter provide different views such as histograms and pie-charts using the X library as display language. These event interpreters are typically small programs written in C or C++. Although BEE is primarily used for runtime monitoring, users can also use an event logger to create an event trace, that can later be analyzed by post-mortem tools. The event trace can for example be used to replay a view of the program execution.
sensors should be included in the code during programming development. These sensors are an integral part of the program and are not just added when the program does not run. For a typical run of the program, most event sensors will be ignored, but since the program is always instrumented, the user has the option to start monitoring without having to modify the program. To make the above approach practical, the overhead introduced by both active and especially inactive event sensors should be low. One way to reduce the overhead is to use a postprocessing of events [12, 14], but this is undesirable for network programs since the information is often needed at runtime. Other researchers have implemented hardware or hybrid monitors [10, 15, 17] to collect monitoring information, with minimal impact on the application. This approach is not practical in our environment, since multicomputer nodes are off-the-shelf systems that are physically distributed: the cost of a hardware monitor would be prohibitive. BEE limits the monitoring overhead by allowing users to specify event filters at each of the event processing stages, thus reducing the number of events that has to be processed. For event classes that are of no interest, the event sensor should be disabled, so the event is never generated. On a Sun4/110, the cost of a disabled event sensor is 0.3 µseconds. An event handler filter can be used to exercise a more fine grain control over the event stream: events can be dropped selectively, or they can be combined in an event aggregate before being sent to an event interpreter. An event aggregate can for example limit the number of events by combining events that are generated within, for example, 10 milliseconds.
To make interactive monitoring practical, the cost of generating events should be as small as possible. In our implementation, the overhead for a predefined event is 21 µseconds with a (minimal) local event interpretator and 96 µseconds with a remote event interpreter. The overhead is slightly higher for events that include a lot of event-specific information [6]. These overheads are low enough that interactive monitoring is practical with minimal impact on the application. With the current version of BEE, applications can generate about 500 events per second with an impact of less than 5% on the execution time. The reason for this low overhead is that communication over Nectar is very efficient. The overhead for sending an event stream using TCP/IP over an Ethernet is about 10 times higher, making interactive monitoring much more expensive.
5.3. The Client Server 5.2. The Cost of Event Processing Because of the unpredictable behavior of a network environment, all network application should be able to generate monitoring information for debugging and monitoring. Predefined or application-specific event
Occasionally it is necessary to read or alter information in the client program. The client server allows event interpreters and other programs to retrieve information about the client program, as well as to alter the execution and the state of the client (Figure 5). The client server can for example be used to retrieve the names of variables
in the client program; this allows events to use a concise representation for names, and to have the event interpreter retrieve naming information from the client, when needed. The functionality provided by the client server is similar to that provided by ptrace in Unix.
Client Server
Client Event Sensor
Event Generator
Clients
Event Interpreters
C1
Event Interpreter
EI1
C2
EI2
C3
Event Handler
1,2,3 C E
1,2
Client Figure 5: The Client Server The client server is implemented as a separate thread in the client program. At startup, each Nectar task creates a unique port called the client event server port, and enters the port identifier in a global name server. Requests that are sent to this port are handled by the client server. Event interpreters and other programs can retrieve the port identifier based on the name of the client during program execution. On systems that do not support lightweight threads, the client server is invoked through a Unix signal.
5.4. Managing Event Configurations It is not always possible to know in advance what aspect of the execution should be monitored [23]. BEE therefore allows the user to change the monitoring setup during execution. For example, users can activate or deactivate event classes and change the frequency of event generation. This functionality is implemented using the client server. To help the user in managing the application, the Nectar programming environment includes a configuration manager. The configuration manager keeps track of all client programs and event interpreters, and allows the user to declare client and event groups. Users can set up and change the event configuration using simple Unix shell commands, addressing clients and interprters individually or by group. Figure 6 shows an example of three clients C1, C2, and C3 being monitored by an event group consisting of two event interpreters EI1 and EI2.
5.5. Runtime Monitoring based on BEE BEE can be used to build a wide spectrum of monitoring and debugging tools. The simplest BEE configuration consists of a local event interpreter. Every time an event sensor is executed, the event interpreter routine is invoked with a procedure call. Local event interpreters are ideal
EI Group Configuration Manager
Figure 6: Event Configuration when information is accumulated during program execution, and displayed at the end. They are less well suited for runtime monitoring: displaying status information or updating the screen inside an event interpreter can slow down the client application significantly. Several clients executing in different nodes can be attached to an event interpreter as shown in figure 7. This configuration is very important in a network environment since users want to get an overview of the activities in the entire system. An example is measuring the load on the network nodes for monitoring and for dynamic load balancing purposes. This configuration is frequently used by Nectar applications.
C1 C2
EI1
C3 Figure 7: Network monitoring of multiple clients For the configuration in Figure 7, sorting the event streams based on time stamps is a significant problem. BEE uses a CAB timer with a 1 µseconds granularity to generate time stamps; the timers on different CABs are not synchronized. Event interpreters handle the synchronization problem by recording the clock skew between the event interpreter clock and the client clock the first time the client contacts the event interpreter. All time stamps from that client are corrected using this offset. This method is simple, and it is adequate for most applications. For long running applications, the clock
skews will have to be recalculated periodically. Figure 8 shows a client connected to several event interpreters, each of them tapping on the same event stream, but providing different views of the behavior [21, 24]. The different event interpreters can either be on the same node or on different nodes. The client overhead can be reduced by having the client send the events to just one event interpreter which then forwards the (filtered) events to other interpreters. This configuration can easily be built using BEE.
EI1 C1
EI3 EI2
Figure 8: Multiple views of a client Ogle, Schwan and Snodgrass describe a distributed monitoring system [20] that uses resident and remote monitors. This system can also be built using BEE. Each node uses a "resident monitor" (local event interpreter) which collects and analyzes the monitoring information from processes on that node. The resident monitors report to a central monitor (remote event interpreter) executing on a network node with access to a monitoring data base.
6. Running a Network Program To execute network programs in the Nectar environment users first select nodes and initialize the runtime environment. They can then execute and debug their application.
6.1. Network Configuration Nectar users invoke start_nectar to set up their runtime environment. start_nectar first selects a set of nodes based on a specification provided by the programmer. The node request language allows users to ask for nodes with specific properties (i.e. a Warp node). start_nectar satisfies the request after consulting the Nectar data base, which contains a description of all nodes and their properties. start_nectar then checks the status of the nodes, and, if necessary, starts up the necessary system software and loads application-specific code onto the CABs. It also sets up terminal I/O following one of several modes. Most applications use central IO: the user interacts with the application through a single window. Other modes allow users to use a separate window per task, or to start up tasks under a debugger. Once the system is initialized, the user can run and develop applications as described in
the next section. During application development and execution, start_nectar can be used to load new application code onto the CAB and to clean up finished applications. The interface described above was designed to support the interactive use of Nectar. Setting up a fixed configuration for a programming ‘‘session’’ has several advantages: most of the initialization has to be done only once and since the nodes are specified up front, it is easier to verify that the nodes remain available, i.e. we can eliminate some of the unpredictability of the network environment. However, the interface is cumbersome for production use of the system, and the fixed configuration is overly restrictive. We are in the process of changing the environment so that programs can be started using a single command and nodes can be added dynamically.
6.2. Network Execution In the following we describe some of the operations defined on event configurations. Users can set up an initial event configuration, or add to a configuration using the connect function. For example, connect -client prog -ei load -event E_PROC
starts up a client group prog and an event interpreter group load enabling event sensors of type E_PROC. The enable/disable Group functions control the event processing in a group of clients or event interpreters. When an event interpreter is disabled, all connected clients are notified so their event kernels can check the connections to event interpreters. If a client is not actively connected to any interpreter, its event generation is completely disabled. In the current implementation, the above operations are provided as a library and as a Unix shell command interface. Users currently use the command line interface together with start_nectar, or they use the library interface to setup the event configuration directly from the application. The library interface could for example also be used by network execution manager programs, for example with an interface based on a graphical editor [18], allowing users to specify and manipulate event configurations graphically.
7. An Example An important aspect of the Nectar project is the close cooperation with application programmers: several applications groups at CMU are using Nectar [13]. In this section we describe how the Nectar environment was used during the port of Mistral-3 to Nectar. Mistral-3 is a parallel solid modeling program based on an octree decomposition of modelling space and was developed at the University of Leeds [11]. Mistral-3 first creates an octree, which is automatically distributed over
the set of available network nodes as it is generated. Then it ray traces the image using a quadtree subdivision to generate independent tasks. Each of these phases is parallelized using a distributed task queue model with automatic load balancing. To execute the tasks during ray-tracing, workers in general can access the data locally, but if needed they request the data from other nodes.
on each node and the global message traffic between the nodes. These views are particularly useful, because they allow the programmer to quickly identify communication problems.
Mistral-3 is implemented as a set of 4 processes replicated on every allocated node in the network. Each of these processes is instrumented with user-defined events. The execution of Mistral-3 on Nectar can be monitored with two event interpreter groups attached to these events: A message debugger group whose main task is to monitor the communication traffic between the individual nodes and a performance debugger group monitoring the elapsed user and system times, thereby allowing the user to assess Mistral-3’s overall performance.
We described a programming environment that was specifically designed to support the development of applications distributed over a group of computers connected by a network. Two key components of the system are an efficient monitoring kernel and an easy-touse communication primitives. Because of the dynamic nature of a network environment, monitoring by users or programming tools is essential for efficient parallelization. Using the event kernel, users can instrument their code extensively and select at runtime what aspects of the execution will be monitored.
8. Conclusion
We implemented the environment in the context of the Nectar project. The low overhead of communication over Nectar allows us to do interactive monitoring with minimal impact on the application, by moving the interpretation of the event stream to other Nectar nodes. Good network performance is not only important for the parallel execution of applications, but it is also needed to support the necessary monitoring: monitoring data has to be sent over the network so that it can be combined to provide a global picture of the application, and users have to access the information, again over the network [19]. More work is needed to improve the current environment and to implement higher level tools on top of the event kernel. We plan to extend the set of systemprovided event interpreters, and to use BEE as the basis for debuggers. Applications will also be able to query event interpreters, thus allowing them to adjust based on the monitoring information. More work is also needed in helping users deal with network and node failures. Figure 9: Mistral-3 Message Debugger Figure 9 shows an X window snapshot of Mistral-3 running on 3 worker nodes, with the message debugger group activated. The snapshot is taken during ray-tracing, after the creation of the octree. The two left windows in the top row show the load distribution during these two phases, where the load describes the number of tasks completed per node. The rightmost window on the first row shows the number of cache faults per node. The number of cache faults changes over time, in particular when a worker moves from one region of the image to another. Without runtime monitoring it would be difficult to see this dynamic behavior. The second row of event interpreters shows the distribution of data around the network. The data distribution also changes over time since cache faults cause data to be copied over the network. The last two rows of event interpreters in Figure 9 show the local message traffic between the 4 processes
Acknowledgements We would like to thank the many hardware and software people who were involved in the development of Nectar. This work would not have been possible without their effort. The Mistral application was ported to Nectar by Nick Holliman, who is visiting CMU from the University of Leeds where he is a IBM Research Fellow supported by the IBM United Kingdom Scientific Centre.
References 1. Emmanuel Arnould, Francois Bitz, Eric Cooper, H. T. Kung, Robert Sansom and Peter Steenkiste. The Design of Nectar: A Network Backplane for Heterogeneous Multicomputers. Proceedings of the Third International Conference on Architectural Support for Programming Languages and Operating Systems,
ACM/IEEE, Boston, April, 1989, pp. 205-216. 2. Peter Bates. Debugging Heterogeneous Distributed Systems Using Event-Based Models of Behavior. Workshop on Parallel and Distributed Debugging, ACM, Madison Wisconsin, May, 1988, pp. 11-22. 3. A. Black. Supporting Distributed Applications: Experience with Eden. Proceedings of the Tenth Symposium on Operating System Principles, ACM, December, 1985, pp. 181-193. 4. Shekhar Borkar, Robert Cohn, George Cox, Sha Gleason, Thomas Gross, H. T. Kung, Monica Lam, Brian Moore, Craig Peterson, John Pieper, Linda Rankin, P. S. Tseng, Jim Sutton, John Urbanski, and Jon Webb. iWarp: An Integrated Solution to High-Speed Parallel Computing. Proceedings of Supercomputing ’88, IEEE Computer Society and ACM SIGARCH, Orlando, Florida, November, 1988, pp. 330-339. 5. Bernd Bruegge. BEE: A Basis for Distributed Event Environments (Reference Manual). Tech. Rept. CMUCS-90-180, Carnegie Mellon University, November, 1990. 6. Bernd Bruegge and Frank Walzer. Runtime Monitoring in a Network Environment. International Conference on Parallel Processing, IEEE, Illinois, August, 1990, pp. 278-279. 7. Eric Cooper, Peter Steenkiste, Robert Sansom, and Brian Zill. Protocol Implementation on the Nectar Communication Processor. Proceedings of the SIGCOMM ’90 Symposium on Communications Architectures and Protocols, ACM, Philadelphia, September, 1990, pp. 135-143. 8. David Gelernter. "Generative Communication in Linda". ACM Transactions on Programming Languages and Systems 7, 1 (January 1985), 80-112. 9. Thomas Gross, Angelika Zobel, and Markus Zolg. Parallel Compilation for a Parallel Machine. Proceedings of the SIGPLAN ’89 Conference on Programming Language Design and Implementation, ACM, Portland, OR, June, 1989, pp. 91-100. 10. Dieter Haban and Dieter Wibranietz. "A Hybrid Monitor for Behavior and Performance Analysis of Distributed Systems". IEEE Transactions on Software Engineering 16, 2 (February 1990), 197-211. 11. N. Holliman, C. Wang and P. Dew. Mistral-3 : Parallel Solid Modelling. Tech. Rept. TR 91-4, University of Leeds, January, 1991. . 12. K. Ikudome, G. C. Fox, A. Kolawa, and J. W. Flower. An Automatic and Symbolic Parallelization System for Distributed Memory Parallel Computers. Proceedings of the Fifth Distributed Memory Computing Conference, IEEE, April, 1990, pp. 1105-1114.
13. H.T. Kung, Peter Steenkiste, Marco Gubitoso, and Manpreet Khaira. Parallelizing a New Class of Large Applications over High-Speed Networks. Third ACM SIGPLAN Symposium on Principles and Practice of Parallel Programming, ACM, Williamsburg, April, 1991. 14. Ted Lehr, Zary Segall, Dalibor Vrsalovic, Eddie Caplan, Alan Chung, and Charles Fineman. "Visualizing Performance Debugging". IEEE Computer 22, 10 (October 1989), 38-52. 15. Allen D. Malony, Daniel A. Reed, David C. Rudolph. Integrating Performance, Data Collection, Analysis and Visualization. In Performance Instrumentation and Visualization, ACM Press, 1990, pp. 73-97. Edited by Margaret Simmons, Rebecca Koskela. 16. Paul Maybee. Grail: A System for Parallel Distributed Programming. 17. Russell D. McLaren and William A. Rogers. Instrumentation and Performance Monitoring of Distributed Systems. Proceedings of the Fifth Distributed Memory Computing Conference, IEEE, April, 1990, pp. 1180-1186. 18. Brad A. Myers. The Garnet User Interface Development Environment: A Proposal. Tech. Rept. CMU-CS-88-153, CMUCS, September, 1988. 19. Bernd Bruegge, Hiroshi Nishikawa, and Peter Steenkiste. Computing over Networks: An Illustrated Example. Proceedings of the Sixth Distributed Memory Computing Conference, IEEE, Portland, April, 1991. 20. David M. Ogle, Karsten Schwan, and Richard Snodgrass. The Dynamic Monitoring of Real-Time Distributed and Parallel Systems. Tech. Rept. GITICS-90/23, Georgia Institute of Technology, May, 1990. 21. S. P. Reiss, E. Golin and R. Rubin. Prototyping Graphical Languages with GARDEN. IEEE Conference on Visual Languages, IEEE, 1986. 22. Charles Seitz. "The Cosmic Cube". Communications of the ACM 28, 1 (January 1985), 22-33. 23. Richard Snodgrass. "A Relational Approach to Monitoring Complex Systems". ACM Transactions on Computer Systems 6, 2 (May 1988), 157-196. 24. David Socha, Mary L. Bailey and David Notkin. Voyeur: Graphical Views of Parallel Programs. Workshop on Parallel and Distributed Debugging, ACM, Madison Wisconsin, May, 1988, pp. 206-215. 25. Peter Steenkiste. Nectarine - A Nectar Interface. Internal document.