Dec 3, 2016 - Chuanjie Lin, Chuanyang Li, Jinliang He, Jun Hu and Bo Zhang. State Key Laboratory of Power Systems, Department of Electrical Engineering.
IEEE Transactions on Dielectrics and Electrical Insulation
Vol. 24, No. 3; June 2017
1905
Surface Charge Inversion Algorithm Based on Bilateral Surface Potential Measurements of Cone-type Spacer Chuanjie Lin, Chuanyang Li, Jinliang He, Jun Hu and Bo Zhang State Key Laboratory of Power Systems, Department of Electrical Engineering Tsinghua University Beijing 100084, China
ABSTRACT To study the surface charge distribution of high-voltage direct-current (HVDC) spacers for gas insulated lines (GIL), a surface charge inversion algorithm based on surface potential measurements is necessary. However, previous studies on inversion calculation of surface charge density only considered the surface potential of one side, neglecting the effect of residual surface charge on the other side of the spacer; this leads to an inaccurate inverted surface charge distribution. In this paper, the inversion algorithm methods used to determine surface charges over the past few decades were summarized, and their advantages and disadvantages were discussed. Based on the previous charge inversion algorithms, an improved surface charge inversion algorithm considering the surface potential of both sides of a cone-type model spacer was developed. The improved method was verified experimentally using a cone-type model spacer. Compared with that obtained by previous charge inversion algorithms, the charge distribution derived from the improved algorithm was closer to the situation determined from theoretical analysis. This work has practical relevance for the surface charge measurement of cone-type spacers and offers a new orientation in the surface charge analytical algorithm. Index Terms — Surface charge, charge inversion calculation, cone-type spacer, HVDC, gas insulated line.
1
INTRODUCTION
GAS insulated lines (GILs) have become a focus in practical applications because of their large-capacity transmission, small occupied area, and stable operation [1-6]. However, there are still some problems that limit the application of GILs in high-voltage direct-current (HVDC) systems. Except for the metal particles on the surfaces of spacers in DC GILs [7-9], the charge accumulation on the spacer surface [10-13] is considered as the main factor that lowers the surface flashover voltage of spacers [14-16] in HVDC GILs. Therefore, accurate measurement of surface charge distribution is important to design effective HVDC spacers. The study of surface charge accumulation should be based on the accurate measurement of surface potential distribution. To date, several methods to measure surface potential have been proposed, such as the “dust figure” method, the optical measurement method based on the Pockels effect, and the electrostatic probe method [17-19]. The dust figure is also known as the “Lichtenberg figure”, which was derived from the phenomenon of dust movement and proposed by Lichtenberg in 1777 [20, 21]. Colored solid dust particles with unipolar charge Manuscript received on 3 December 2016, in final form 26 February 2017, accepted 17 March 2017. Corresponding author: B. Zhang.
can move in the electric field direction and be adsorbed on the surface of the spacer. The charge distribution of the spacer can be determined from the resulting colored surface. However, this method only generates an image that indicates the charge distribution. The amount of charge cannot be quantified. Besides, the motion of the dust may change the surface charge distribution, which may lead to inaccuracy of the measurement results. The optical measurement method based on the Pockels effect was proposed by Kumada et al in 1998 [22-24], which takes into account the optical anisotropy effect generated by certain isotropic and transparent optical media under an applied electric field. Although this method has high precision, it is only applicable to thin, transparent insulators. The electrostatic probe test method was developed by Davies in 1967 [25]. This method determines surface potential quantitatively based on the induction mechanism. Because of its wide availability, the electrostatic probe measurement method has commonly been used to measure surface potential [26-35]. The charge distribution on the spacer surface is then obtained by using the charge inversion algorithm. The charge inversion algorithm for electrostatic probe measurement was reported in 1967 and many available algorithms, such as the linear method [25], the λ function method [29-31], the analytical method [32], the Θ function
DOI: 10.1109/TDEI.2017.006496
1906
C. Lin et al.: Surface Charge Inversion Algorithm Based on Bilateral Surface Potential Measurements of Cone-type Spacer
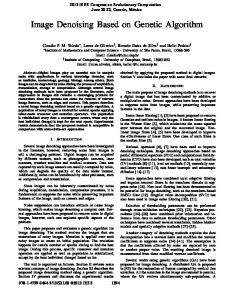
Figure 1. Development of inverse algorithm methods.
method [33], and the improved λ function method with a noise reduction process [34-36], have been widely used. The development history of these methods is shown in Figure 1. It is clear that the processes of these inversion algorithms are all related to the geometric structure of dielectrics. To simplify the computing process, these previous algorithms usually used planar or cylindrical samples as experimental subjects [25, 31-33, 35, 36]. However, the spacer structure is so complicated in practice that it needs to be considered to improve the precision of inversion algorithms. For cone-type spacers inside GILs, it should be noted that the surface charge of the unmeasured side influences the surface potential of the measured side, especially in locations where the spacer is relatively thin. The analytical method is based on the Maxwell equations, so it can be widely applied. At the same time, the analytical method can also be implemented in numerical calculations, providing a way to improve algorithms. In this paper, based on the reported analytical algorithm, an improved algorithm for cone-type spacers that considers the surface potentials on both sides is proposed. Furthermore, the effectiveness of this improved algorithm is proved experimentally for a cone-type model spacer. This research has practical relevance for the surface charge measurement of cone-type spacers, bringing a new perspective to surface potential measurement and the surface charge analytical algorithm.
2
REVIEW OF THE ANALYTICAL METHOD
Ootera and Nakanishi stated that the detected surface potential was determined by a function of the entire surface charge [32]. They proposed an analytical method based on the
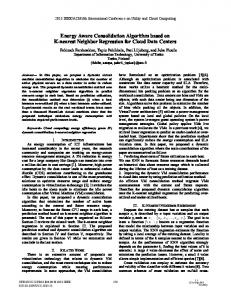
basic formulas of an electromagnetic field in 1988, which calculated the electric potential and charge distributions on an entire surface. A test area was divided into several small triangular domains by applying the finite element method, as shown in Figure 2, where ni is the domain number, Si is the domain area, and i is the average surface charge density.
Figure 2. Surface domain triangulation used in the analytical method.
The potential Pi measured at the i th point can be written as [32]: n
Pi Ci ij j
(1)
j 1
where C i is the potential produced by the metal electrode, j is the surface charge density at point j, and ij is the correlation coefficient of the surface charge and measured potential, the value of which depends on the geometry of the whole system.
IEEE Transactions on Dielectrics and Electrical Insulation
Vol. 24, No. 3; June 2017
After some mathematical derivation, Equation (1) can be written in a matrix form to give the following equation [32]:
P11 P21 Pm1 Fm 1,1 F n1
1 ' 1 2 ' 2 ... ... Pmn m ' m ... ... Fm 1,n m 1 ' m 1 ... ... Fnn n ' n
P12 P22
... ... ... ...
Pm 2 Fm 1,2 Fn 2
P1n P2 n
(2)
where the subscripts 1 to m represent areas on the conductor surface, and subscripts (m + 1) to n represent areas on the dielectric surface. i ' and i are the apparent surface charge density and practical surface charge density, respectively, and i is the surface potential. The computational formulas of Pij and Fij can be written as [32]:
Pij
1 4 0
Fij ( 2 1 )
The matrix A aij
1
r dS
(3)
Si ij
1 4 0
Si
rij n j rij 3
dS
(4)
is defined as the inverse matrix of
coefficient matrix (2):
P11 P21 A Pm1 Fm1,1 F n1
P12
... ...
P22
... ...
Pm 2
... ...
Fm 1,2 ... ... Fn 2
... ...
P1n P2 n Pmn Fm1,n Fnn
1
3
1907
LIMITATIONS OF THE CURRENTLY USED ANALYTICAL METHOD
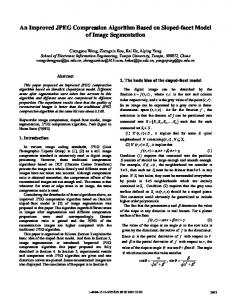
The analytical method introduced above and other commonly used surface charge inversion algorithms all focus on the discussion of the charge activity on the lateral surface of the dielectric. For a spacer with a specific form, only the charge distribution on a single surface was focused on [26-31], even though it was pointed out as early as 1988 that the charge accumulation on the unmeasured side of a flake spacer could affect the surface potential measurement results [32, 33]. Kumada has conducted excellent work on the measurement of surface charge on opposite sides of a planar insulator [37]. In this paper, to verify the effect of charge accumulation on the opposite side of a spacer on the surface potential measurement, we conducted experiments using a cone-type model spacer. Before surface potential measurement, the concave side of the cone-type model spacer was treated with corona discharge from a needle electrode under −3 kV. The electric potential distributions before and after discharge, as shown in Figure 3, were measured by the electrostatic probe test method during the entire process; the convex side was not treated. The respective electric potential distributions before and after discharge were inversed, as illustrated in Figure 4. A large number of negative charges accumulated on the concave side after corona discharge. Although the convex side was not treated, the measured surface potential image revealed a large number of negative charges near the discharge point of the
(5)
The apparent charge can be written as: m
i ' aij j j 1
n
k m 1
aik k
(6)
Figure 3. Concave potential before and after corona discharge (Unit: V).
The apparent surface charge density can then be obtained. Furthermore, the practical surface charge density can be calculated [32]. This algorithm is essentially a numerical method based on the electromagnetic field theory, so it can be widely adopted for different kinds of experimental samples. The algorithm fully considers that the accumulation of charges on the whole insulator surface influences the result detected by the probe and has high applicability to practical situations. Because its calculation precision is closely associated with the geometric partitioning intensity, and there are two large matrix inversion computations in whole calculation process, the numerical implementation is relatively complicated.
Figure 4. Convex potential before and after corona discharge (Unit: V).
1908
C. Lin et al.: Surface Charge Inversion Algorithm Based on Bilateral Surface Potential Measurements of Cone-type Spacer
concave surface. Therefore, it is clear that the potential value measured on the convex surface will be influenced by the negative charges on the concave one. As a consequence, it can be determined that for insulating sheets that are far thinner than they are wide, it is necessary to simultaneously perform an inversion calculation based on the bilateral surface sides measurements of the spacer.
4
IMPROVED ALGORITHM BASED ON BILATERAL SURFACE POTENTIAL MEASUREMENT
Because the thickness of a cone-type spacer is far less than its diameter [9, 10, 33, 34, 38], a cone-type model spacer was used as an example. An improved algorithm based on the bilateral surface potential of a cone-type model spacer was introduced and verified. 4.1 THE NEW ALGORITHM The main differences between the new algorithm and the old one are that the new algorithm considers bilateral surface charge and the influence of the electrode is eliminated. The improved algorithm was developed on the basis of the analytical method introduced in Section II. Assuming that there was no charge in the bulk of the spacer during the whole computing process, the charge accumulation would only appear on the two surfaces. Therefore, the algorithm can be divided into three steps: 1) Finite element division; 2) Coefficient matrix derivation; 3) Inverse matrix calculation. During finite element division, the convex and concave surfaces of the cone-type spacer were segmented simultaneously. Each domain was divided by the axis and circumference to make full use of the geometry symmetry of the cone-type spacer. The division is shown in Figure 5, where 1 – n1 is the concave domain, and m+1 – n is the convex domain, which are both located on the dielectric surface.
then the second measurement was conducted after the voltage had been applied for 30 min. The difference between the two measured results reflects the magnitude of the charge accumulated on the surface. The formula for the potential of a single finite element is:
( P)
n
1 4 0
1
i ' r dS i 1
(7)
Si
Based on Equation (7), we have:
P11 P21 Pn11 P n1 1,1 Pn1
P12
... ...
P22
... ...
Pn1 2
... ...
Pn1 1,2 ... ... Pn 2
... ...
P1n 1 ' 1 P2 n 2 ' 2 Pn1n n1 ' n1 (8) Pn1 1,n n1 1 ' n1 1 Pnn n ' n
where the equation on the right side is the processed measurement data; namely, the potential value, which would change over a period of time. The coefficient matrix on the left side can be given by,
Pi j
1
1
dS 4 0 rij
(9)
Si
where S is the small domain area, which can be regarded as a small rectangle when the division is meticulous enough; it should be noted that the distance between the center points of two domains rij would be different, which is determined by whether domains i and j are located on the concave or convex side of the spacer. The practical surface charge is obtained after the below inverse matrix calculation, using the matrix: F11 F21 Fn11 F n1 1,1 Fn1
F12
... ...
F22
... ...
Fn1 2
... ...
Fn1 1,2 ... ... Fn 2
... ...
F1n 1 ' 1 F2 n 2 ' 2 Fn1n n1 ' n1 Fn1 1,n n1 1 ' n1 1 Fnn n ' n
(10)
where the element of the coefficient matrix is: (a) Top view
(b) Lateral view
Figure 5. Division of the finite element
Fij ( 2 1 )
1
4 0 Si
It should be noted that the electrode domain was not in the finite element to simplify the inversion calculation. Two measurements were conducted to eliminate the influence of the electrode. The first potential was measured when the DC voltage was applied on the spacer surface with no charge, and
rij n j rij 3
dS
(11)
The matrix coefficient here is determined by the product of the link vector between two different domains and the normal vector perpendicular to the surface compared to the coefficient matrix P. Therefore, the spacer geometry needs to be accurately measured.
IEEE Transactions on Dielectrics and Electrical Insulation
Vol. 24, No. 3; June 2017
The actual values of surface charges are obtained after matrix inversion twice. The main feature of this improved algorithm is that the two surface domains are included in the matrix calculation simultaneously, which provides a more realistic inversion calculation result than those obtained previously. 4.2 EXPERIMENTAL VERIFICATION To confirm the reliability of the effect caused by surface charges trapped on the opposite surface of the spacer, a control experiment using the new algorithm and analytical method was carried out. Considering that the main differences are associated with the surface charge of the bilateral sides of the cone-type spacer, the convex and concave potentials were measured before and after changing the surface charge density on the concave surface of the spacer. 4.2.1 EXPERIMENT DESCRIPTION Across-sectional diagram and the geometry of the cone-type spacer model used in the experiment are illustrated in Figure 6. The experimental samples were prepared according to the industrial ratio, as reported in our former publications [39, 40].
1909
High voltage supply Electrometer Oscilloscope
Kelvin probe
needle
Computer
Rotation platform Figure 7. Schematic diagram of the experiment setup.
The experiment involved the following steps: 1) The concave side of the spacer was first covered by a grounded copper film, and then the surface potential distributions on the both sides of the model spacer were measured; 2) The measurement was repeated after 30 min. If the result was the same as that measured in step (1), then it was verified that the ambient environment was unchanged and does not affect the surface potential measurement; 3) A 30-mm slit was made 10 mm from the central axis of the cone-type spacer. To introduce negative charge by corona discharge, a −3 kV voltage was applied to the metal tip for 10 min. The surface potential distribution on both sides of the cone spacer was then measured; 4) After completely covering the concave side of the spacer with a grounded metal film, the bilateral surface potential distribution was measured again.
Figure 6. Model of the cone-type spacer.
A schematic diagram of the experiment setup is shown in Figure 7. The cone-type model spacer was placed on a rotating platform, which was equipped with a step motor that rotated at a constant speed. The movement of the Kelvin probe was controlled by a mechanical arm and actualized as two-dimensional motion in a plane. The Kelvin probe could be moved to the other surface of the model spacer by adjusting the position of the mechanical arm. Real-time data detected by the Kelvin probe were transmitted to the oscilloscope through the electrometer. Data were sent to the computer after being sampled by the oscilloscope. Finally, the potential distribution was derived by data treatment using software compiled by LabVIEW. 4.2.2 EXPERIMENTAL PROCESS To sufficiently contrast the new algorithm with the analytical method, the surface potentials of the convex and concave sides of the model spacer were measured before and after surface charges were introduced to the concave side.
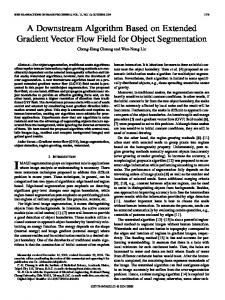
Based on the measured results, the surface charge distributions were obtained by the analytical algorithm and improved algorithm to allow their comparison. 4.2.3 ANALYSIS OF THE RESULTS Comparing Figures 8 and 9, an important difference in the results obtained by the two methods is found in Figures 8(d) and Figures 9d. In (a) and (b) of Figures 8 and 9, the surface charge distribution changed slightly after applying a voltage for 30 min. A large number of negative charges are found on the concave side facing the needle after corona discharge treatment (Figure 8c and 9c). In addition, negative charge accumulated in the corresponding domain of the convex side, as shown in (d), while the amount of negative charge accumulation obtained by improved algorithm in the corresponding domain of the convex surface in (d) was relatively small. From (e) in Figures 8 and 9, the surface charge distribution on the convex side almost returned to the initial state after recovering the concave side with the copper film.
1910
C. Lin et al.: Surface Charge Inversion Algorithm Based on Bilateral Surface Potential Measurements of Cone-type Spacer
Figure 8. Inversion calculation results of surface charges using the analytical method (Unit: C/ mm2): (a) the charge distribution of the convex side of the model spacer in the initial state with the concave side fully covered by a grounding copper film; (b) the charge distribution of the convex side after 30 min; (c) the surface charge distribution after corona discharge; (d) the charge distribution of the convex side at this time; (e) the charge distribution of the convex side after recovering the concave surface with the copper film.
Figure 9. Inversion calculation results using the improved algorithm (Unit: C/ mm2): (a) the charge distribution of the convex side in the initial state with the concave side fully covered by a grounding copper film; (b) the charge distribution of the convex side after 30 min; (c) the surface charge distribution after corona discharge;(d) the charge distribution of the convex surface at this time; (e) the charge distribution of the convex surface after recovering the concave surface with the copper film.
During the experiment, only the surface charge distribution of the concave side changes. When there is no time interval between the states shown in (d) and (e) in Figures 8 and 9, the surface charge distributions on the convex side are unchanged. In addition, there is no residual negative charge on the convex surface side, as shown by comparing (b) with (e) in Figures 8 and 9. The difference between Figure 8(d) and Figure 9(d)
serves as good evidence for the effectiveness of the improved algorithm. Meanwhile, it is obvious that negative charge accumulation occurs in the analytical algorithm (Figure 8(d)); this is because ignoring the accumulation of considerable negative charge on the convex side would influence the potential distribution on the convex side. Subsequently, it can be proved that the unmeasured lateral surface charge
IEEE Transactions on Dielectrics and Electrical Insulation
Vol. 24, No. 3; June 2017
distribution of the spacer can affect the measured lateral surface charge distribution in the charge inversion calculation. Therefore, it is necessary to use the improved inversion algorithm that accounts for bilateral surface charge for accurate numerical analysis. It should be noted that the cone-type model spacer used in this paper is different from real spacers in terms of factors like convex slope and operating environment. For real spacers, the surface normal component is stronger and the charge accumulation phenomenon is more serious than those of our model spacer. Therefore, it is necessary to use the improved inversion algorithm that considers bilateral surface charge in surface charge measurements of real spacers.
4 CONCLUSIONS The traditional surface charge inversion algorithm is based on the electromagnetic field theory, and fully considers that the accumulation of charge on the whole insulator surface influences the result detected by the probe and has high suitability in practical applications. However, the calculation precision of this algorithm is closely associated with the geometric partitioning intensity. It was determined that for an insulating sheet that is much thinner than its diameter, it is necessary to simultaneously perform an inversion calculation based on the measurements of both surfaces of a spacer. In this paper, an improved surface charge inversion algorithm considering the surface potentials of both sides of the cone-type model spacer was developed. Comparing the traditional analysis algorithm and the improved one revealed that the results derived from the improved algorithm are more practical. An experiment using a cone-type model spacer composed by epoxy resin and aluminum oxide was carried out. The results indicated that the surface charge of the unmeasured side influenced the surface charge distribution of the measured side in the charge inversion calculation. In conclusion, the electric field distribution of a cone-type spacer depends on the surface charge distributions on both sides. Neglecting the surface charge accumulation on the reverse side of the spacer leads to systematic error in the measurement of the surface charge.
ACKNOWLEDGEMENT
[3] [4] [5] [6] [7] [8] [9] [10]
[11] [12] [13] [14] [15] [16] [17]
[18] [19] [20] [21]
[22]
The authors are grateful for the financial support from the National Basic Research Program of China (“973” Project) (Grant No. 2014CB239502). And this work was supported in part by the National Natural Science Foundations of China under Grant 51322703.
[24]
REFERENCES
[25]
[1] [2]
T. Hillers and H. Koch, “Gas insulated transmission lines for high power transmission over long distances,” Energy Management and Power Delivery, Vol. 2, pp. 613-618, 1998. N. Takinami, S. Kobayashi and A. Miyazaki, “Application of the world's longest gas insulated transmission line in Japan,” Properties and Applications of Dielectric Materials, Vol. 1, pp. 19-22, 2003.
[23]
[26]
1911
R. Benato, C. Di Mario and H. Koch, “High-Capability Applications of Long Gas-Insulated Lines in Structures,” IEEE Trans. Power Deliv., Vol. 22, No. 1, pp. 619-626, Jan. 2007. K. Nakanishi, H. Ootera, Y. Shibuya, Y. Arahata and T. Nitta, “Charge accumulation on conical spacer in compressed SF6 gas at DC stress”, IEEE Conf. Electr. Insul. Dielectr. Phenomena, pp. 87-94, 1983. H. Koch, “Future needs of high power interconnections solved with gas-insulated transmission lines (GIL),” Power Syst. Tech., Vol. 3, pp. 1851-1855, 2002. H. J. Koch, “Gas-insulated transmission line (GIL)”, IEEE Power Eng. Soc. General Meeting, Toronto, Canada, Vol. 4, pp.13-17, 2003. S. Okabe, “Phenomena and mechanism of electric charges on spacers in gas insulated switchgears,” IEEE Trans. Dielectr. Electr. Insul., Vol. 14, No. 1, pp. 46-52, 2007. X. Y. Li, S. H. Dan, W. R. You, M. N. Wu and D. Li, “A novel particle trap in compressed air insulated transmission line”, Applied Superconductivity and Electromagnetic Devices (ASEMD), pp. 42-47, 2013. Q. Wang, G. X. Zhang, X. X. Wang and B. Wang, “Surface charge accumulation on the cone-type insulator under DC voltage,” IEEE Int’l. Power Modulator and High Voltage Conf., pp. 430-433, 2010. Q. Wang, G. X. Zhang and X. X. Wang, “Characteristics and mechanisms of surface charge accumulation on a cone-type insulator under dc voltage”, IEEE Trans. Dielectr. Electr. Insul., Vol. 19, No. 1, pp. 150-155, 2012. H. Koch, “Basic information on Gas Insulated Transmission lines (GIL)”, Power and Energy Society General Meeting - Conversion and Delivery of Electrical Energy in the 21st Century, pp. 1-4, 2008. A. Knecht, “Development of surface charges on epoxy resin spacers stressed with direct applied voltages”, Gaseous Dielectrics III, pp. 356-364, 2013. R. A. Fouracre, E. Santos, I. Timoshkin, “Surface Discharge Propagation: The Influence of Surface Charge”, Power Modulator Sympos., pp. 39-42, 2006. J. H. Geng and B. Y. Jia, “Research on the Influence of Surface Accumulation Charge on Flashover Voltage of Ceramic Insulator”, Int’l. Conf. Energy Environment Technology, Vol. 2, pp. 244–246, 2009. Z. Jia, B. Zhang, X. Tan and Q. Zhang, “Flashover Characteristics along the Insulator in SF6 Gas under DC Voltage,” Asia-Pacific Power and Energy Eng. Conf., pp. 1-4, 2009. C. Y. Li, J. Hu, C. J. Lin, B. Zhang, and J. L. He, “Surface charge migration and dc surface flashover of surface-modified epoxy-based insulators”, J. Phys. D: Appl. Phys., Vol. 50, pp. 065301, 2017. C. J. Gao, B. Qi, Z. L. Xing, C. G. Li, L. J. Zhao and X. Q. Sun, “Development of a surface charge measurement system for GIS insulator in SF6”, IEEE Conf. Electr. Insul. Dielectr. Phenomena (CEIDP), pp. 286-289, 2015. Y. Takahashi, “Two hundred years of lichtenberg figures”, J. Electrostatics, Vol. 6,No. 1, pp. 1-13, 1979. H. Wang, W. Wang, “Investigation of line streamers of dielectric surface by using dustfigure techniques”, Int'l. Conf. on Properties Applications of Dielectr. Materials, Vol. 2, pp. 561-564, 1988. B. I. Resnik, and C. V. Wetli, “Lichtenberg figures”, Amer. J. Forensic Medicine Pathology, pp.99-102, 1996. S. Koyama, and Y. Murooka, “The Study of Surface Discharge Phenomena with ns Rectan- gular Pulses:A Comparison of the Dust Figure Technique andthe Lichtenberg Figure Technique”, IEEE Trans. Fundamentals & Materials, Vol. 93, pp. 375-381, 1973. A. Kumada, M. Chiba, K. Hidaka, “Potential distribution measurement of surface discharge by Pockels sensing technique”, J. Appl. Phys. , Vol. 84, pp. 3059-3065, 1998. A. Kumada, M. Chiba and K. Hidaka, “Potential distribution measurement of positive surface streamer by using Pockels device”, IEEE Conf. Electr. Insul. Dielectr. Phenomena (CEIDP), Vol. 1, pp. 150-153, 1999. A. Kumada, Y. Shimizu, M. Chiba, “Pockels surface potential probe and surface charge density measurement”, J. Electrostatics, Vol. 58, pp.45-58, 2003. D. K. Davies, “The examination of the electrical properties of insulators by surface charge measurement”, J. Sci. Instrum., Vol. 44, No. 7, pp.521-524, 1967. A. D. Lorenzi, L. Grando, A. Pesce, P. Bettini and R. Specogna, “Modeling of epoxy resin spacers for the 1 MV DC gas insulated line of ITER neutral beam injector system”, IEEE Trans. Dielectr. Electr. Insul., Vol. 16, No. 1, pp. 77-87, 2009.
1912
C. Lin et al.: Surface Charge Inversion Algorithm Based on Bilateral Surface Potential Measurements of Cone-type Spacer
[27] B. Lutz and J. Kindersberger, “Influence of relative humidity on surface charge decay on epoxy resin insulators”, IEEE 9th Int’l. Conf. Properties and Applications of Dielectr. Materials, pp. 883-886, 2009. [28] C. Li, J. He, J. Hu, B. Zhang and G. Zhang, “Dynamic observation of dc surface charge dissipation for epoxy-resin/alumina composite”, IEEE 11th Int'l. Conf. Properties and Applications of Dielectr. Materials (ICPADM), pp. 360-363, 2015. [29] A. Pedersen, “On the electrostatic field near the charged surface of an insulator with special reference to surface charge probe measurements”, Gaseous Dielectrics IV, pp.4l4-420, 1984. [30] A. Pedersen, “On the electrostatic of probe measurements of surface charge densities”, Gaseous Dielectrics V, 235-241, 1987. [31] T. O. Rerup, G. C. Crichton and I. W. McAllister, “Using the λ function to evaluate probe measurements of charged dielectric surfaces”, IEEE Trans. Dielectr. Electr. Insul., Vol. 3, No. 6, pp. 770-777, 1996. [32] H. Ootera and K. Nakanishi, “Analytical method for evaluating surface charge distribution on a dielectric from capacitive probe measurement-application to a cone-type spacer in ±500 kV DC-GIS”, IEEE Trans. Power Deliv., Vol. 3, No. 1, pp. 165-172, 1988. [33] T. Nitta and K. Nakanishi, “Charge accumulation on insulating spacers for HVDC GIS”, IEEE Trans. Dielectr. Electr. Insul., Vol. 26, No. 3, pp. 418-427, 1991. [34] D. C. Faircloth and N. L. Allen, “High resolution measurements of surface charge densities on insulator surfaces”, IEEE Trans. Dielectr. Electr. Insul., Vol. 10, No. 2, pp. 285-290, 2003. [35] A. Kumada, S. Okabe and K. Hidaka, “Resolution and signal processing technique of surface charge density measurement with electrostatic probe,” IEEE Trans. Dielectr. Electr. Insul., Vol. 11, No. 1, pp. 122-129, 2004. [36] A. Kumada and S. Okabe, “Charge distribution measurement on a truncated cone spacer under DC voltage”, IEEE Trans. Dielectr. Electr. Insul., Vol. 11, No. 6, pp. 929-938, 2004. [37] A. Kumada and S. Okabe, "Measurement of surface charge on opposite sides of a planar insulator using an electrostatic probe," IEEE Trans. Dielectr. Electr. Insul., Vol. 11, No. 6, pp. 919-928, 2004. [38] M. G. C. Naik, J. Amarnath, S. S. Kamakshiah, “A new optimised design of single phase gas insulated cone type insulator”, Int’l. J. Eng. Sci. Technology, Vol.4, No. 3, pp. 929-936, 2012. [39] C. Y. Li, J. Hu, C. J. Lin, and J. L. He, “The control mechanism of surface traps on surface charge behavior in alumina-filled epoxy composites”, J. Phys. D: Appl. Phys., Vol. 49, pp. 445304, 2016. [40] C. Y. Li, J, L. He, J. Hu, “Surface Morphology and Electrical Characteristics of Direct Fluorinated Epoxy-resin/Alumina Composite”, IEEE Trans. Dielectr. Electr. Insul. , Vol. 23, No. 5, pp. 3071-3077, 2016. Chuangjie Lin was born in Sichuang, China, in 1993. He received a B.Sc. from Tsinghua University, China, in 2016. He is currently a Ph.D. student in the Department of Electrical Engineering, Tsinghua University. His research interests include surface charge behavior and multiphysics simulations for high-voltage direct-current spacers.
Chuanyang Li was born in Shandong, China, in 1987. He received the B.Sc. and M.Sc. degrees from Taiyuan University of Technology, China, in 2011 and 2014, respectively. Currently, he is a Ph.D. candidate in the Department of Electrical Engineering, Tsinghua University. His research interests include dc surface charge behavior, material modification for insulators, and condition monitoring and PD pattern recognition for HV motors and generators. He is the author or coauthor of more than 20 scientific papers. Jinliang He (M’02-SM’02-F’08) was born in Changsha, China, in 1966. He received a B.Sc. degree in electrical engineering from Wuhan University of Hydraulic and Electrical Engineering, China, in 1988, M.Sc. in electrical engineering from Chongqing University, Chongqing, China, in 1991, and Ph.D. in electrical engineering from Tsinghua University, Beijing, China, in 1994. He became a Lecturer in 1994, and an Associate Professor in 1996 in the Department of Electrical Engineering, Tsinghua University. From 1997 to 1998, he was a Visiting Scientist at the Korea Electrotechnology Research Institute, Changwon, Korea, where he was involved in research on metal–oxide varistors and high-voltage polymeric metal–oxide surge arresters. In 2001, he was promoted to Professor at Tsinghua University. In Jan. 2014 to Jan. 2015, he was a visiting professor at the Department of Electrical Engineering, Stanford University, Palo Alto, CA, USA. He is currently the Chair of the High Voltage Research Institute, Tsinghua University. His research interests include advanced power transmission technology, nanodielectrics, electromagnetic sensors and big data applications. He is the author of seven books and 500 technical papers. Professor He is an Associate Editor of IEEE Transactions on Dielectrics and Electrical Insulation. Jun Hu was born in Ningbo City, Zhejiang Province, China, in 1976. He received the B.Sc., M.Sc., and Ph.D. degrees in electrical engineering from Tsinghua University, Beijing, China, in 1998, 2000, and 2008, respectively. He is currently a Lecturer at Tsinghua University. His research fields include overvoltage analysis in power systems, dielectric materials, surge arrester technology, electromagnetic sensors and big data applications. He is the author of about 100 technical papers. Bo Zhang was born in Datong, China, in 1976. He received B.Sc. and Ph.D. degrees in theoretical electrical engineering from the North China Electric Power University, Baoding, in 1998 and 2003, respectively. Currently, he is an Associate Professor in the Department of Electrical Engineering at Tsinghua University, China. His research interests include computational electromagnetics, grounding technology, and EMC in power systems.