South African Journal of Geomatics, Vol. 2, No. 2, April 2013
Differential Interferometry Techniques on L-Band Data Employed for the Monitoring of Surface Subsidence Due to Mining Jeanine Engelbrecht1,2, Michael Inggs2 1
2
Council for Geoscience, Cape Town, South Africa,
[email protected] Department of Electrical Engineering, University of Cape Town, Cape Town, South Africa
Abstract Mining activities in South Africa changes the natural environment in several ways. Challenges for mining companies lie in the detection and monitoring of surface subsidence and there exists a need for a long term monitoring system. Field-based techniques for deformation measurement are labour intensive and time consuming and, consequently, the implementation of these techniques for long-term monitoring is not ideal. On the other hand, satellite remote sensing data provides a synoptic view of an area and the repeat image acquisition strategy implies that the long-term monitoring of surface deformation is a possibility. This paper investigates the use of L-band ALOS PALSAR data for the detection and monitoring of surface subsidence due to underground mining activities in the Witbank Coalfields. Surface subsidence was detected for a period of over 3 years between 2007/08/16 and 2010/10/09. Centimetre scale surface deformation was detected in the study area and is associated with areas of active mining. The systematic evolution of the surface deformation basins over time was recognised and is consistent with the advance of the working face of the mine during the same period. The results confirm that L-band synthetic aperture radar data through dInSAR techniques can be used for the long-term monitoring of surface subsidence associated with mining activities.
1.
Introduction
Underground mining activities world-wide are associated with numerous challenges including health and safety concerns and environmental impacts. One particular challenge is associated with surface deformation as a result of the subsurface extraction of ore material. Underground mining activities can result in the lowering of the earth surface (referred to as surface subsidence) as a result of the collapse of bedrock and the subsequent sinking of unconsolidated sediments (Perski & Jura 2003). The effects of surface subsidence at the surface are frequently severe and include damage to infrastructure (roads, dams, pipelines, buildings etc.) and pose potential risks to human health and safety. Surface subsidence also affects the natural environment by altering hydrological pathways. Groundwater circulating through mining cavities can become polluted and will potentially discharge into the natural environment thereby contaminating wetlands, streams and dams (Bell et al. 2001). For mining companies involved it is necessary to know if subsidence is 82
South African Journal of Geomatics, Vol. 2, No. 2, April 2013 taking place, where it is taking place, how much deformation is taking place and how fast subsidence is progressing. With this knowledge informed decisions on extraction techniques can be made and remedial actions and prevention strategies can be formulated. The traditional way of monitoring surface subsidence is through field-based techniques including spirit levelling and GPS surveys. Although high accuracies are achieved using these techniques, several problems have been described (Carnec & Delacourt 2000; Herrera et al. 2007; Tomás et al. 2005; Yen et al. 2007). These include difficulties associated with frequent field observation requirements if the evolution of subsidence over time needs to be monitored. Variations in the precision of measurements and difficulties with access to monitoring sites in isolated areas have also been reported. Additionally, the techniques relies on measurements that are point-based implying that the full extent of subsiding areas is not well recognised and poorly understood (Herrera et al. 2007; Yen et al. 2007). The synoptic view and repeat observation strategy provided by satellite-borne sensors provide the ability to overcome many of the limitations associated with field-based subsidence monitoring approaches. Synthetic Aperture Radar (SAR) data through differential interferometry (dInSAR) techniques provide the ability to detect, measure and monitor centimetre to millimetre scale surface deformation. The systematic coverage and frequent observations provided by SAR sensors implies that the extraction of information on the spatial and temporal evolution of subsiding areas is a possibility (Anderson 2007; Herrera et al. 2007; Massonnet & Feigl 1998; Tomás et al. 2005). The synoptic view further ensures that extensive areas can be monitored at lower cost when compared to field-based techniques (Anderson 2007; Herrera et al. 2007). Various authors have studied surface subsidence using radar interferometry techniques (Anderson 2007; Carnec & Delacourt 2000; Chang et al. 2004; Engelbrecht et al. 2011; Herrera et al. 2007; Massonnet & Feigl 1998; Perski & Jura 2003; Raucoules et al. 2003; Smith 2002; Tomás et al. 2005). The advantages of using radar interferometry for measuring and monitoring surface subsidence include the fact that it is more cost effective than monitoring extensive areas by traditional ground-based approaches (Anderson 2007; Herrera et al. 2007). It also allows for the extraction of information on the spatial and temporal evolution of subsiding areas at more frequent intervals than traditional techniques (Anderson 2007; Herrera et al. 2007; Massonnet & Feigl 1998; Tomás et al. 2005). The synoptic view provided by SAR sensors also ensures an areal view of the deformation pattern as opposed to the discrete point locations monitored by traditional techniques (Raucoules et al. 2003; Carnec & Delacourt 2000). Most of the authors describe the ability to measure subsidence at millimetre- to centimetre-scale accuracy in good agreement with groundbased measurements. To test if dInSAR techniques can be used to monitor surface subsidence, a study area in the Mpumalanga province of South Africa was selected. The area is known for its coal mining activities 83
South African Journal of Geomatics, Vol. 2, No. 2, April 2013 with open-cast as well as underground coal mining taking place. Underground mining activities in the area are known to be associated with surface subsidence, especially in areas where longwall mining is taking place. Here surface subsidence is planned for and allows for the mitigation of surface subsidence effects. In addition to the coal mining activities, the region is subject to commercial agricultural activities. The main crop types cultivated include maize, sunflowers and soya. The objective of the paper is to show some results of the technique in a South African context, rather than to introduce the details of the techniques, that can be found in many of the references in this paper. We begin with a very brief overview of differential, interferometric, SAR, and the limitations due to vegetation changes in the study area and acquisition of data. This is followed by the main objective of the paper, i.e. to show some results of the signal processing in a mining application in South Africa, and the degradation of the results over long time frames, due to the vegetation changes mentioned above. We conclude and make recommendations.
2.
DInSAR background, limitations and data acquisition
2.1.
Background to DInSAR and incoherence
Synthetic aperture radar (SAR) images are formed by recording the phase (time delay) and amplitude (energy intensity) of microwave echoes returned from the earth’s surface (Smith 2002; Massonnet 1995). The phase measured by the SAR antenna is related to the number of wavelengths required to traverse the round-trip distance between the antenna and the earth’s surface. Any ground motions that transpire in the radar line-of-sight direction would result in a slight increase or decrease in round-trip distance, causing an offset in phase (Smith 2002). The interference pattern caused by the phase differences between two images captured at different times or different locations can be calculated, resulting in an interferogram (Massonnet & Feigl 1998; Chang et al. 2004; Liu et al. 2004; ESA 2005; Smith 2002). This process is called radar interferometry. An interferogram provides information about height variations present on the imaged surface. Therefore, using radar interferometry, detailed three-dimensional relief maps (or digital elevation models) of the earth’s surface can be produced from multiple-pass synthetic aperture radar (SAR) data sets. Furthermore, the phase difference information in an interferogram can be adjusted to compensate for topography, resulting in information that can be related to very small relative movements of the ground surface (centimetre or millimetre scale) (ESA 2005). This is called differential synthetic aperture radar interferometry (dInSAR). Various limitations are associated with the use of dInSAR techniques for deformation measurement. By far the most limiting aspect is the introduction of phase noise in interferograms as a result of various factors including the relative positions of the satellites at the time of image 84
South African Journal of Geomatics, Vol. 2, No. 2, April 2013 capture, the squint angle of the sensor at the time of image capture and the characteristics of the land surface at the time of image capture. The evolution of ground characteristics is frequently considered to be the most limiting factor influencing successful interferogram generation (Liu et al. 2004; Massonnet & Feigl 1998; Stebler et al. 2002). Since two or more images are needed for interferogram generation, the satellite has to return to the same area twice (repeat-pass interferometry). The time lapse between the acquisition of the first scene (referred to as the master scene) and the second scene (referred to as the slave scene) can be as short as one day or as long as several years. Theoretically there is no limit to the length of the temporal baseline, but in practice it is restricted to a few weeks or months. This is because of changes in surface conditions which can make radar images incoherent to each other. Two sets of radar images will be correlated (coherent) to each other if each image experiences the same interaction with scattering elements on the ground. Pixel decorrelation (or incoherence) takes place when, after a certain period of time, scatterers within a resolution cell rearrange randomly, leading to different speckle patterns in interferometric pairs. Extreme cases of incoherence include water-covered surfaces which have no stability, and agricultural areas that change as soon as they are ploughed or irrigated (Massonnet & Feigl 1998). Vegetated surfaces in general alter significantly with time, which makes the radar echo scattering characteristics different, resulting in coherence losses (Liu et al. 2004; Raucoules et al. 2003). The phase noise component of an interferogram can be calculated and is known as interferometric coherence (hereafter referred to as coherence) which acts as an indicator of the quality of interferometric measurement. The observed coherence values ranges between 0 and 1 with 0 implying no coherence (or complete decorrelation) and meaningless phase measurements. A value of 1 implies high coherence and high reliability of phase measurements. Several advanced algorithms have been developed to overcome the limitations due to phase noise. One such technique (known as Persistent Scatterer Interferometry or PSI) relies on the selection of pixels demonstrating ideal behaviour (high coherence) (Berardino et al. 2002; Ferretti et al. 2001; Prati et al. 2010). The ideal pixels, known as persistent scatterers (PSs), are stable reflectors usually corresponding to man-made structures meaning that in vegetated, non-urban areas the density of PSs will be low (Ferretti et al. 2001; Raucoules et al. 2007). This limits the ability to extract deformation measurements. Additionally, the PSI technique relies on the availability of a minimum of 20 scenes (Mora et al. 2003; Raucoules et al. 2007) which limits its use in areas where an insufficient number of scenes are available. Since the area of interest is situated in a dynamic commercial agricultural environment, the evolution of the land surface can pose significant limitations in the use of the PSI technique. Consequently, the traditional dInSAR techniques was the focus of the investigation to test the ability to detect, measure and monitor surface subsidence due to underground mining activities in
85
South African Journal of Geomatics, Vol. 2, No. 2, April 2013 the Witbank Coalfields. The following section describes the SAR data selected for the investigation and the deformation results obtained.
2.2.
Satellite image data used
Several earth-orbiting satellites host sensors capable of capturing SAR data. These sensors operate at specific wavelengths such as X-band (~3 cm), C-band (~ 5 cm) and L-band (~ 23 cm). Shorter wavelength data is generally more sensitive to small-scale deformations compared to longer wavelength data (Prati et al. 2010). However, the wavelength of the sensor also dictates the maximum detectable deformation with the maximum detectable deformation being equal to 0.5 times the wavelength of the signal per pixel. Consequently, for C-band data, the maximum detectable deformation will be 2.8 cm per pixel whereas L-band data will detect up to 11.5 cm per pixel (Zhou et al. 2009). Furthermore, the selection of the optimal wavelength of data to use for interferometric measurement is dependent on the characteristics of the surface. Longer wavelength data provides the ability to penetrate further into vegetation, thereby maximising the signal return from the surface (Fletcher 2005). Shorter wavelength data on the other hand will interact with vegetation resulting in a greater backscatter contribution from the vegetation canopy as opposed to the surface (Fletcher 2005). A previous investigation tested the use of C-band data to monitor surface deformation in the area. The results suggested that phase noise due to the presence of vegetation and the evolution of the land surface limited the extraction of reliable deformation measurements (Engelbrecht et al. 2013). Therefore, the use of L-band data was considered in this research. Since the area of interest is situated in a dynamic commercial agricultural environment, Lband data was expected to be more suitable for extracting information from the surface. An additional parameter that influences dInSAR measurement is the polarization of the signal. SAR systems are designed to transmit either vertically polarized or horizontally polarized radiation or both. Likewise, the antenna can receive either vertically or horizontally polarized waves. The transmitted and received polarizations are designated with the letters H and V for the horizontal and vertical cases respectively (Natural Resources Canada 2012). Thus the polarization of a radar image can be HH, for horizontal transmit, horizontal receive, VV for vertical transmit, vertical receive, HV for horizontal transmit vertical receive, and vice versa (Natural Resources Canada 2012). A sensor with the ability to capture data in fully polarimetric mode captures information in 4 channels corresponding to different polarization states. These include HH, HV, VH and VV polarizations. In agricultural areas, vertically orientated crops allow for improved penetration by horizontally polarized waves when compared to vertically polarized waves. This implies that horizontal polarizations (HH) will allow for improved backscatter from the surface. At the time of publication, the only satellite that hosted an L-band sensor was a Japanese sensor known as ALOS. ALOS hosted the Phased Array-type L-band Synthetic Aperture Radar (PALSAR) sensor which captured data at L-band and a selection of polarization states. When 86
South African Journal of Geomatics, Vol. 2, No. 2, April 2013 operating in full resolution mode, the sensor provided scenes at 10 m spatial resolution with a swath of 70 km. The PALSAR data obtained for the study area was captured in single polarization (only HH channel) as well as dual polarization mode (HH channel and HV channel provided). The dates of image capture and the polarization state is presented in Table 1. The same polarization data is required for interferometric processing implying that, for dual polarization datasets, only the HH polarization data was used. The ALOS satellite was decommissioned in April 2011 meaning that only archived data is available for investigation. Table 1. ALOS PALSAR dates of image acquisition and polarization state Date of image capture 2007/08/16 2008/02/16 2008/05/18 2008/07/03 2008/08/18 2008/10/03 2009/01/03 2009/02/18 2010/01/06 2010/02/21 2010/04/08 2010/08/24 2010/10/09
3.
Polarization HH/HV HH HH/HV HH/HV HH/HV HH/HV HH HH HH HH HH HH/HV HH/HV
Image processing methodology and deformation results
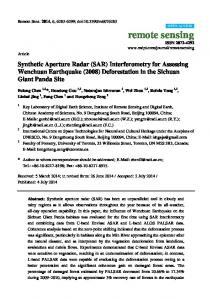
Although the interferometric phase is sensitive to the topographic relief and surface motions that occur between two image acquisitions, this phase is really the addition of different contributing parameters including: 1) a flat earth and topographic component; 2) an atmospheric component; 3) an orbital component; 4) phase noise; and 5) the deformation component (Massonnet and Feigl, 1998; Raucoules et al., 2003; Raucoules et al., 2007; Chang et al., 2004; Liu et al., 2004). To exploit the interferometric phase to derive a measure of surface deformation or motion, the components listed in 1 to 4 above need to be removed from the interferogram. This is achieved by interferometric processing which involves several image processing steps: 1) Data importing and updating the precise orbital parameters, 2) Interferogram generation, 3) Interferogram flattening (the process of removing orbital and topographic phase contributions), 4) Adaptive filtering and coherence generation (the process of noise removal and derivation of coherence as an indicator of phase quality), 5) phase unwrapping and 6) orbital refinement and re-flattening. The resulting data consist only of phase contributions due to deformation that took place at the surface between the times of image capture (known as a differential interferogram). An example of a differential interferogram is presented in Figure 1. An interferogram essentially represents the relative phase of the signal in cycles between - and + . In a differential interferogram, the phase due to topography and other parameters is removed, and the relative phase is the phase contribution as a result of surface deformation. For the differential interferogram, each cycle between - and + then represents deformation equal to half the wavelength of the signal of 87
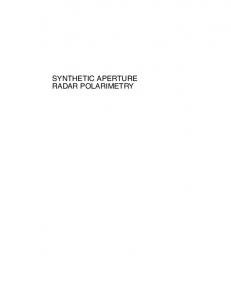
South African Journal of Geomatics, Vol. 2, No. 2, April 2013 the sensor. In the case of PALSAR data which operates at a wavelength of 23.62 cm, one phase cycle represents then represents 11.81 cm of deformation. From the differential interferogram, the relative phase as presented by values between - and + can be converted to absolute phase by means of the phase unwrapping process. The result of the phase unwrapping and conversion of phase measurement to displacement is presented in Figure 2. The result presents the deformation measurement of the subsidence basin that formed between 2011/02/21 and 2011/04/08. A maximum of 36.5 cm of deformation was recorded for this timeframe.
Figure 1. An example of a differential interferogram with 2011/02/21 as master and 2010/04/08 as slave. The colour ramp represents interferometric phase measured between - and + which is associated with 11.8 cm of deformation.
Figure 2. Surface deformation measured for the period 2011/02/21 to 2011/04/08. The profile graph across the subsidence basin is indicated along the black line with North to the left and south to the right 88
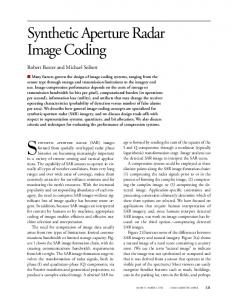
South African Journal of Geomatics, Vol. 2, No. 2, April 2013 The long time series for which ALOS PALSAR data was available (2007/08/16 to 2010/10/09) implied that the monitoring of the evolution of subsidence basins over a period of over 3 years was a possibility. Figure 3 presents a selection of interferograms created. Coherence limitations (phase noise effects) are evident and are manifested by a speckle effect which is most prominent on the interferograms created for the period 2008/02/16 to 2008/05/18 as well as the period for 2009/02/18 to 2010/01/06 (top left and bottom left interferograms in Figure 3). It should be noted that the day difference between master/slave image acquisitions were 92 days and 322 days respectively for these two interferograms suggesting that the evolution of the land surface is responsible for the phase noise. The noisy areas on differential interferograms will create problems during the phase unwrapping stage of processing and will create areas with unreliable deformation measurements. Despite coherence limitations, the results indicate that ALOS PALSAR data can be successfully used for the detection and monitoring of surface subsidence over time.
Figure 3. A selection of interferograms showing the evolution of surface deformation basins over time. The underground mine plans are presented by black lines Surface deformation measurements for the area of interest were obtained by using successive scenes as master together with the slave scene that results in the shortest day difference between master and slave scenes. The extent of the resulting interferograms were manually digitised and compared to the extent of the mine plans at the time of image capture (Figure 4). The extents of the subsidence basins were found to be consistent with the areas of active mining during the time of master/slave image capture and the evolution of the subsidence basins detected through dInSAR techniques coincided with the advance of the working face of the mine during that period. The total amount of subsidence was calculated for the area of interest (Figure 5). The results suggest that, for the longwall mining operation in question, surface subsidence reaches a maximum of ~ 53 cm. 89
South African Journal of Geomatics, Vol. 2, No. 2, April 2013
Figure 4. The extent of mine plans and the date of extraction compared to the extent of subsidence basins detected through dInSAR techniques.
Figure 5. The total surface subsidence experienced from 2007/08/16 to 2010/10/09 90
South African Journal of Geomatics, Vol. 2, No. 2, April 2013
4.
Discussion and concluding remarks
The detection and monitoring of surface subsidence due to mining activities is an ongoing effort and the paper aimed to demonstrate the use of satellite image data through dInSAR processing as a monitoring tool. Although the evolution of the land surface is known to affect the quality of deformation measurements using dInSAR techniques, ALOS PALSAR data was tested for its ability to successfully detect and measure surface deformation in a dynamic agricultural environment. Although the presence of vegetation is particularly limiting for dInSAR measurement, the longer wavelength ALOS PALSAR data was expected to penetrate through vegetation therefore minimising the phase noise introduced by vegetation changes. However, normal agricultural activities such as harvesting and ploughing would alter the soil surface sufficiently to cause a change in the scattering behaviour, causing the signal to decorrelate to a certain degree. The phase noise effects due to evolving land surface conditions were visible on the differential interferograms created. The phase noise, manifested as speckle in the interferograms, frequently masked portions of observed subsidence basins. Although the location and extent of the subsidence basins were still visible in most of the noisy interferograms, the presence of noise prevented the unwrapping of the relative phase and, consequently, prevented the accurate quantification of displacement. Even though an accurate measurement of displacement could not be achieved for long temporal baseline datasets, the location and extent of subsidence basins could still be recognised. This implies that the presence or absence of surface deformation features will be noted even in the absence of short temporal baseline datasets. The noise effects for shorter day difference interferometric pairs (46 day difference) were not as problematic and surface deformation measurements with a high reliability was possible. The strong correlation of dInSAR surface deformation results with the position of active underground mining activities highlights the potential of including dInSAR techniques together with complimentary field-based techniques in existing deformation monitoring programmes. The ability to monitor the evolution of surface subsidence basins over time in good agreement with the advance of the working face of the mine was also demonstrated. This suggests that the systematic acquisition of SAR scenes over time will enable the operational monitoring of deformation in underground mining regions. However, if the amount of surface displacement is to be quantified, the day difference between successive image acquisitions should be kept to a minimum to limit the phase noise effects introduced by an evolving land surface. The paper demonstrated the ability of L-band data through dInSAR processing techniques to measure and monitor deformation due to underground mining. However, since the ALOS satellite was decommissioned in 2011, the continued systematic acquisition of L-band datasets is not possible until new satellites with the ability to capture L-band SAR data become available. At the time of publication, new L-band sensors were being planned by various international space agencies 91
South African Journal of Geomatics, Vol. 2, No. 2, April 2013 including the National Aeronautics and Space Administration (NASA) and the Deutsches Zentrum für Luft- und Raumfahrt (DLR). Until the routine acquisition of L-band data is assured, shorter wavelength C-band data can be considered for the routine monitoring of surface deformation (Engelbrecht et al. 2013). Although C-band data is expected to be more sensitive to phase noise induced by the presence of vegetation and the evolution of the land surface, the selection of very small temporal baseline datasets may alleviate some of these limitations (Engelbrecht et al. 2013). However, if C-band data are used for the measurement of deformation, the maximum detectable deformation will be 2.8 cm per pixel (Section 2.2) meaning that deformation measurements at the centres of subsidence basins may be inaccurate where actual deformation exceeds this rate (Engelbrecht et al. 2013). However, the delineation of the extent of subsidence basins will remain a possibility.
5.
Acknowledgement
The research would not have been possible without the joint support of the Council for Geoscience and the South African Department of Science and Technology. The ALOS PALSAR data used in this investigation was provided by the European Space Agency through their Cat-1 support initiative.
6.
References
Anderson, A. 2007. Land subsidence. Renew Canada, 33. Bell, F. G., Bullock, S. E. T., Hälbich, T. F. J., & Lindsay, P. 2001. Environmental impacts associated with an abandoned mine in the Witbank Coalfield, South Africa. International Journal of Coal Geology, 45 pp. 195-216. Berardino, P., Fornaro, G., Lanari, R., & Sansosti, E. 2002. A new algorithm for surface deformation monitoring based on small baseline differential SAR interferograms. IEEE Transactions on Geoscience and Remote Sensing, 40 (11) pp. 2375-2383. Carnec, C. & Delacourt, C. 2000. Three years of mining subsidence monitored by SAR interferometry, near Gardanne, France. Journal of Applied Geophysics, 43 pp. 43-54. Chang, H. C., Ge, L., & Rizos, C. 2004. Application of repeat-pass DInSAR and GIS for underground mine subsidence monitoring. www.gmat.unsw.edu.au/snap/publications/chang_etal2004d.pdf. 1-11-2007. Engelbrecht, J., Musekiwa, C., Kemp, J. N., & Inggs, M. R. 2013. Parameters affecting interferometric coherence - the case of a dynamic agricultural region. IEEE Transactions on Geoscience and Remote Sensing, In Press. Engelbrecht, J., Inggs, M. R., & Makusha, G. 2011. Detection and monitoring of surface subsidence associated with mining activities in the Witbank Coalfields, South Africa, using differential radar interferometry. South African Journal of Geology, 114.1 pp. 77-94. Ferretti, A., Prati, C., & Rocca, F. 2001. Permanent scatterers in SAR interferometry. IEEE Transactions on Geoscience and Remote Sensing, 39 (1) pp. 8-20. Fletcher, K. 2005. Spaceborne radar applications in Geology, European Space Agency Publications Division, Noordwijk, Netherlands, ESA TM-17.
92
South African Journal of Geomatics, Vol. 2, No. 2, April 2013 Herrera, G., Tomás, R., Lopez-Sanchez, J. M., Delgado, J., Mallorqui, J. J., Duque, S., & Mulas, J. 2007. Advanced DInSAR analysis on mining areas: La Union case study (Murcia, SE Spain). Engineering Geology, 90 pp. 148-159. Liu, G. X., Ding, X. L., Li, Z. L., Chen, Y. Q., & Yu, S. B. 2004. Pre- and co-seismic ground deformations of the 1999 Chi-Chi, Taiwan earthquake, measured with SAR interferometry. Computers & Geosciences, 30 pp. 333-343. Massonnet, D. & Feigl, K. L. 1998. Radar interferometry and its application to changes in the Earth's surface. Reviews of Geophysics, 36 pp. 441-500. Mora, O., Mallorqui, J. J., & Broquetas, A. 2003. Linear and nonlinear terrain deformation maps from a reduced set of interferometric SAR images. IEEE Transactions on Geoscience and Remote Sensing, 41 (10) pp. 2243-2253. Natural Resources Canada. 2012. Radar Polarimetry. http://www.nrcan.gc.ca/earth-sciences/geographyboundary/remote-sensing/radar/1893. 1-8-2012. Perski, Z. & Jura, D. Identification and measurement of mining subsidence with SAR interferometry: Potentials and limitations. Santorini, Greece. Prati, C., Ferretti, A., & Perissin, D. 2010. Recent advances on surface deformation measurement by means of repeated space-borne SAR observations. Journal of Geodynamics, 49 pp. 161-170. Raucoules, D., Colesanti, C., & Carnec, C. 2007. Use of SAR interferometry for detecting and assessing ground subsidence. C.R Geoscience, 339 pp. 289-302. Raucoules, D., Maisons, C., Carnec, C., Le Mouelic, S., King, C., & Hosford, S. 2003. Monitoring of slow ground deformation by ERS radar interferometry on the Vauert salt mine (France) Comparison with ground-based measurement. Remote Sensing of Environment, 88 pp. 468-478. Smith, L. C. 2002. Emerging applications of interferometric synthetic aperture radar (InSAR) in geomorphology and hydrology. Annals of the Association of American Geographers, 92 pp. 385-398. Stebler , O., Meier, E., & Nüesch, D. 2002. Multi-baseline polarimetric SAR interferometry- first experimental spaceborne and airborne results. ISPRS Journal of Photogrammetry and Remote Sensing, 56 pp. 149-166. Tomás, R., Márquez, Y., Lopez-Sanches, J. M., Delgado, J., Blanco, P., Mallorquí, J. J., Martínez, M., Herrera, G., & Mulas, J. 2005. Mapping ground subsidence induced by aquifer overexploitation using advanced Differential SAR Interferometry: Vega Media of the Segura River (SE Spain) case study. Remote Sensing of Environment, 98 pp. 269-283. Yen, J.-Y., Chen, K.-S., Chang, C.-P., & Boerner, W.-M. 2007. Evaluation of earthquake potential and surface deformation by differential interferometry. Remote Sensing of Environment. Zhou, X., Chang, N.-B., & Li, S. 2009. Applications of SAR interferometry in earth and environmental research. Sensors, 9 pp. 1876-1912.
93