Jul 2, 2006 - CONICET, Chacabuco 917, 5700 San Luis, Argentina. 2. Centro Atómico Bariloche, CONICET Av. Bustillo 9500,. 8400 S. C. de Bariloche, ...
arXiv:cond-mat/0607018v1 [cond-mat.str-el] 2 Jul 2006
Surface phase transitions in one-dimensional channels arranged in a triangular cross-sectional structure: Theory and Monte Carlo simulations
P. M. Pasinetti1 , F. Rom´a1,2 , J. L. Riccardo1 and A. J. Ramirez-Pastor1,† 1. Departamento de F´ısica, Universidad Nacional de San Luis, CONICET, Chacabuco 917, 5700 San Luis, Argentina 2. Centro At´omico Bariloche, CONICET Av. Bustillo 9500, 8400 S. C. de Bariloche, Argentina Abstract Monte Carlo simulations and finite-size scaling analysis have been carried out to study the critical behavior in a submonolayer lattice-gas of interacting monomers adsorbed on one-dimensional channels arranged in a triangular cross-sectional structure. The model mimics a nanoporous environment, where each nanotube or unit cell is represented by a one-dimensional array. Two kinds of lateral interaction energies have been considered: 1) wL , interaction energy between nearest-neighbor particles adsorbed along a single channel and 2) wT , interaction energy between particles adsorbed across nearest-neighbor channels. We focus on the case of repulsive transversal interactions (wT > 0), where a rich variety of structural orderings are observed in the adlayer, depending on the value of the parameters kB T /wT (being kB the Boltzmann constant) and wL /wT . For wL /wT = 0, successive planes are uncorrelated, the system is equivalent to the triangular lattice and √ h√ √ i √ the well-known ( 3 × 3) ( 3 × 3)∗ ordered phase is found at low temperatures and
a coverage, θ, of 1/3 [2/3]. In the more general case (wL /wT 6= 0), a competition between
interactions along a single channel and a transverse coupling between sites in neighboring channels allows to evolve to a three-dimensional adsorbed layer. Consequently, √ √ √ √ the ( 3 × 3) and ( 3 × 3)∗ structures “propagate” along the channels and new ordered phases appear in the adlayer. Each ordered phase is separated from the disordered state by a continuous order-disorder phase transition occurring at a critical temperature, Tc , which presents an interesting dependence with wL /wT . The Monte Carlo technique was combined with the recently reported Free Energy Minimization Criterion Approach
(FEMCA), [F. Rom´a et al., Phys. Rev. B, 68, 205407, (2003)], to predict the critical temperatures of the order-disorder transformation. The excellent qualitative agreement between simulated data and FEMCA results allow us to interpret the physical meaning of the mechanisms underlying the observed transitions. Keywords: Lattice-Gas Models, Phase Transitions, Monte Carlo Simulation † To whom all correspondence should be addressed.
I.
INTRODUCTION
Lattice-gas models have been extensively investigated in the last decades because they provide a theoretical framework for the description of many physical, chemical and biological systems. The adsorption thermodynamics and the understanding of surface phenomena have been greatly benefited from the development of these models1,2,3 . In this sense, the more recognized examples are the Langmuir adsorption model2,4 and the Ising model of magnetism2,5,6,7,8 . More recently, a number of contributions have been devoted to the study of adsorption of gases on solid surface9,10,11,12,13,14,15,16,17,18,19,20,21,22 . These papers have included the effects of lateral interactions9,10,11,12,13 , surface heterogeneity14 , multisite occupation11,15,16,17,18,19,20,21,22 , etc. Among them, A. J. Phares et al.11 . have studied the structural orderings occuring in a wide variety of experimental and theoretical systems and its influence on the corresponding phase diagrams. Recently, the advent of modern techniques for building single and multiwalled carbon nanotubes23,24,25,26,27 has considerably encouraged the investigation of the gas-solid interaction (adsorption and transport of simple and polyatomic adsorbates) in such a low-dimensional confining adsorption potentials. The design of carbon tubules, as well as of synthetic zeolites and aluminophosphates such as AlP O4 − 5 (Ref.28 ) having narrow channels, literally provides a way to the experimental realization of quasi one-dimensional adsorbents. Many studies on conductivity, electronic structure, mechanical strength, etc. of carbon nanotubes are being currently carried out. However the amount of theoretical and experimental work done on the interaction and thermodynamics of simple gases adsorbed in nanotubes is still limited29,30,31,32,33 . These papers predict a complex behavior. At low temperatures, Radhakrishnan et al.29 have reported, by using molecular simulations, a phase transition occurring between two different density states, one corresponding to a low density (“gas) and the other to a higher density (“liquid) phase. The authors propose that this transition is induced by the interactions with the molecules that are in neighboring channels. A different type of transition was found by Boutin et al.30 and Lachet et al.31 at intermediate temperatures (much higher temperature than the phase transition considered by Radhakrishnan et al.). The molecular simulations of Refs.30,31 show stepped isotherms. The step was only observed using a model that includes both two-body and three-body lateral interactions, whereas a model with only two-body
interactions did not show such a step. Later, this transition has been confirmed by experimental results by Martin et al.33 . The step was attributed to local rearrangement of the adsorbed phase. Other interesting features of the carbon nanotubes have been recently studied. Namely, Urban et al.34 studied the properties of an Ar film adsorbed on the external surface of a bundle of carbon nanotubes; and Calbi and Riccardo35 investigated the presence of adsorption sites and energy barriers near the ends of carbon nanotube bundles to determine their consequences on gas adsorption in the interstitial channels between the tubes. For theoretical purposes, adsorption in a narrowest nanotube can be treated in the onedimensional lattice-gas approach12,19 . This is, of course, an approximation to the state of real adsorbata in nanotubes, which is justified because thermodynamics and transport coefficient can be analytically resolved in these conditions. Many studies have been performed of specific geometries and specific adsorbate-substrate combinations36 . In recent papers37,38 , Trasca et al. presented simple model of a nanoporous environment. That is a lattice-gas model with two kinds of sites. One was a one-dimensional line of sites, which the authors called “axial sites, surrounded by a set of “cylindrical shell sites. The system was evaluated by using mean-field theoretical approach37 and Monte Carlo (MC) simulations38 . This work represents an effort in that direction. Here, we study a simplified lattice-gas model, which can help us to establish criteria to characterize more complex experimental systems. In this model, each nanotube has been represented by a onedimensional chain. These chains were arranged in a triangular structure. We included longitudinal interactions between nearest-neighbor particles adsorbed along a single channel, wL , and transversal energy between particles adsorbed across nearest-neighbor channels, wT . The phase behavior depends on the values of these various energies, especially on the attractive or repulsive character of the interaction. In previous work, low temperature calculations of configurational entropy of the adlayer allowed us to identify a wide variety of structural orderings39 . Later, the influence of such structural orderings on interesting properties as adsorption isotherm and heat of adsorption was analyzed40 . The present article goes a step further, studying the critical behavior of the system via MC simulation, finite-size scaling analysis and the recently reported Free Energy Minimization Criterion Approach (FEMCA)22 . For this purpose, the critical temperature Tc characterizing the transition from the disordered state to the ordered phase is obtained as a function of the
ratio wL /wT . The paper is organized as follows: In Section II we describe the lattice-gas model, the simulation scheme and we present the behavior of Tc (wL /wT ), obtained by using MC method. In Section III we present the theoretical approach (FEMCA) and compare the MC results with the theoretical calculations. Finally, the general conclusions are given in Section IV. II.
LATTICE-GAS MODEL AND MONTE CARLO SIMULATION SCHEME A.
The model
We consider the adsorption of monomers on a simple model of a nanoporous environment. In this model, each nanotube or unit cell has been represented by a one-dimensional (1D) line of L adsorptive sites, with periodical boundary conditions. These chains were arranged in a triangular structure of size R × R and periodical boundary conditions. Under these condition all lattice sites are equivalent hence border effects will not enter our derivation. The energies involved in the adsorption process are three: 1). ε0 , interaction energy between a particle and a lattice site. 2). wL , interaction energy between adjacent occupied axial sites. 3). wT , interaction energy between particles adsorbed on nearest-neighbor transverse sites. Thus, the resulting substrate was an anisotropic three-dimensional array of M = L × R × R adsorption sites, where each site was surrounded by two “axial” sites along the nanotube’s axis and six “transverse” sites belonging to nearest-neighbor unit cells (see Fig. 1 in Ref.39 ). In order to describe the system of N molecules adsorbed on M sites at a given temperature T , let us introduce the occupation variable ci,j,k which can take the following values: ci,j,k = 0 if the corresponding site (i, j, k) is empty and ci,j,k = 1 if the site is occupied by an adatom. Then, the Hamiltonian of the system is given by, H = wL
X
hi,j,k;i′ ,j ′ ,k ′ iL
ci,j,k ci′ ,j ′ ,k′ + wT
X
hi,j,k;i′ ,j ′ ,k ′ iT
ci,j,k ci′ ,j ′,k′ + (ε0 − µ)
M X
i,j,k
ci,j,k
(1)
where hi, j, k; i′ , j ′ , k ′ iL (hi, j, k; i′ , j ′ , k ′ iT ) represents pairs of NN axial (transverse) sites and µ is the chemical potential. B.
Monte Carlo simulations
The lattice-gas was generated fulfilling the following conditions: • The sites were arranged in a structure of size M = L × R × R, with conventional periodic boundary conditions. • Due to the surface was assumed to be homogeneous, the interaction energy between the adparticles and the atoms of the substrate, ε0 , was neglected for sake of simplicity. • Repulsive transversal lateral interactions were considered, where a rich variety of ordered phases are observed in the planes. • Repulsive and attractive longitudinal lateral interactions were used. • Appropriate values of L and R were used in such a way that the adlayer structures at critical regime are not perturbed. In order to study the critical behavior of the system, we have used an efficient exchange MC or simulated tempering method41,42 and finite-size scaling analysis43,44,45 . As in Ref.41 , we build a compound system which consists of m non-interacting replicas of the system concerned. The m-th replica is associated with the temperature Tm [or βm = 1/ (kB Tm ), being kB the Boltzmann constant]. In other words, each replica is in contact with its own heat bath having different temperature. Under these conditions, the algorithm to carry out the simulation process is the following: 1) The compound system of m replicas is generated. For this purpose, each replica is simulated simultaneously and independently as canonical ensemble for n1 MC steps by using a standard importance sampling MC method45,46,47 . In order to determine the set of temperatures, {Tm } ({βm }), we set the highest temperature, Tmax (βmin ), in the high temperature phase where relaxation (correlation) time is expected to be very short and there exists only one minimum in the free energy space. On the other hand, the lowest temperature, Tmin (βmax ), is somewhere in the low temperature phase whose properties we are interested in. Finally, the difference between two consecutive temperatures is set as (Tmax − Tmin ) /(m − 1) (equally spaced temperatures).
2) Interchange vacancy-particle. The procedure is as follows: 2.1) One of the m replicas is randomly selected. 2.2) An occupied site and an empty site, both belonging to the replica chosen in 2.1), are randomly selected and their positions are established. 2.3) By using a standard Kawasaki algorithm48 , an attempt is made to interchange the occupancy state of the sites chosen in step 2.2). 3) Exchange of two configurations Xm and Xm′ , corresponding to the m-th and m′ -th replicas is tried and accepted with the probability W (Xm , βm |Xm′ , βm′ ). In general, the probability of exchanging configurations of the m-th and m′ -th replicas is given by41 , W (Xm , βm |Xm′ , βm′ ) =
1
for ∆ < 0
exp(−∆) for ∆ > 0
(2)
where ∆ = (βm − βm′ ) [H(Xm′ ) − H(Xm )]. As in Ref.41 , we restrict the replicaexchange to the case m ↔ m + 1. 4) Repeat from step 2) m × M times. This is the elementary step in the simulation process or Monte Carlo step (MCS). The procedure 1)-4) is repeated for all lattice’s sizes. For each size, the equilibrium state can be well reproduced after discarding the first n2 MCS. Then, averages are taken over nM CS successive MCS. The canonical expectation value of a physical quantity A is obtained in the usual way as follows: hAiβm =
1 nM CS
nX M CS
A [Xm (t)]
(3)
t=1
All calculations were carried out using the parallel cluster BACO of Universidad Nacional de San Luis, Argentina. This facility consists of 60 PCs each with a 3.0 GHz Pentium-4 processor. As it is standard for order-disorder phase transitions, a related order parameter was de√ √ fined. In particular, at θ = 1/3 [2/3] (being θ ≡ N/M the surface coverage), a ( 3 × 3) √ √ [( 3 × 3)∗ ] ordered structure is formed in the planes below the critical temperature. Depend on the sign of the longitudinal interactions, the order is propagated to all planes.
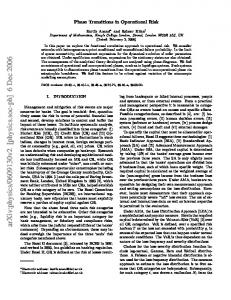
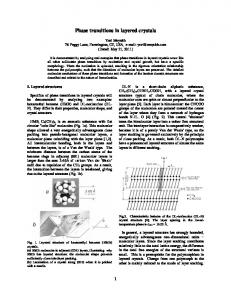
For repulsive wL , adatoms avoiding configurations with nearest-neighbor interactions order along the channels in a structure of alternating particles separated by empty sites. On the other hand, attractive monomer-monomer longitudinal interactions favor the formation of pairs of nearest-neighbor adsorbed particles along the nanotubes. The resulting structures are shown in Figs. 5 and 8 of Ref.39 . For the case of repulsive longitudinal interactions, Fig. 1 a) shows two successive planes, k and k + 1, for one possible configuration of the phase appearing at critical regime and θ = 1/3. Due to the periodic boundary conditions the degeneracy of this “local phase” is equal to six. These configurations allow us to decompose the “local lattice” into six different sublattices [see Figs. 1 b)-c)]49 . The coverage on each sublattice is denoted as θs (s = 1, ..., 6). In this way, an “local order parameter”, ϕk , can be defined as
ϕk =
X
s,t;s6=t
|θs − θt |
(4)
where we sum the differences (in absolute value) between the coverage corresponding to two sublattices. When the system is disordered (T > Tc ), all sublattices are equivalents and the order parameter is minimum. However, when a configuration of the local phase appears at low temperature (T < Tc ), this is allocated on a sublattice. Let us suppose that this configuration lies on the sublattice s. Then, the coverage θs is maximum (θs = 1) and the coverage of the rest of the sublattices is zero or minimum. Consequently, ϕk is also maximum. On the basis of ϕk , the generalized order parameter, ϕ, can be written as,
ϕ=A
L X
ϕk
(5)
k=0
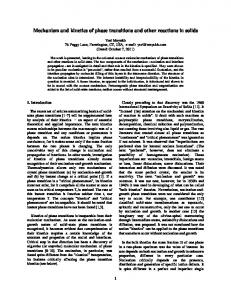
where A is a normalization factor. The definition (5) is computationally convenient and ϕ appears as a good order parameter evidencing the order-disorder phase transition. In a similar way, it is possible to define the order parameter corresponding to θ = 2/3 and repulsive longitudinal interactions. For attractive longitudinal interactions, it is not appropriate to define local sublattices. In this case, each sublattice s(s = 1, ..., 3) lies on the total lattice (see Fig. 2) and ϕ can be easily defined as ϕ = |θ1 − θ2 | + |θ1 − θ3 | + |θ2 − θ3 |
Now, the reduced fourth-order cumulant, UR[L] , introduced by Binder45 and related to the order parameter, can be calculated as:
UR[L] (T ) = 1 −
hϕ4 iT 3hϕ2 i2T
(6)
where UR [UL ] represents the cumulant obtained by variable R [L] and fixed L [R]. The thermal average h...iT , in all the quantities, means the time average throughout the MC simulation. The standard theory of finite-size scaling43,44,45 allows for various efficient routes to estimate Tc from MC data. One of these methods, which will be used here, is from the temperature dependence of UR[L] (T ), which is independent of the system size for T = Tc . In other words, Tc is found from the intersection of the curve UR[L] (T ) for different values of R[L], since UR[L] (Tc ) = constant. C.
Computational results
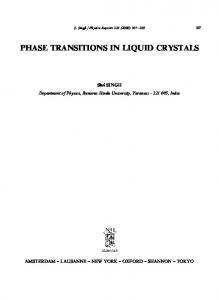
The thermodynamic properties of the present model have been investigated by means of the computational scheme described in the previous section. As a consequence of the equivalence particle-vacancy, the critical behavior at θ = 2/3 is as at θ = 1/3. Then, we restrict our calculations to θ = 1/3. In addition, we set wT = 1 and vary wL/wT from −1 to 1 (−1 ≤ wL /wT ≤ 1). In order to understand the basic phenomenology, we consider in the first place null longitudinal interactions (wL /wT = 0). In this particular case, successive planes are uncorrelated and the system is equivalent to the well-known triangular lattice. The value obtained of kB Tc /wT = 0.3354(1) confirms this arguments and validates the MC scheme50,51,52,53 . The data are not shown here for brevity. Hereafter, we discuss the behavior of the critical temperature as a function of wL /wT . We start with the case of attractive longitudinal interactions. As an example, Fig. 3 illustrates the reduced four-order cumulants plotted versus kB T /wT for wL /wT = −1. From their intersections one gets the estimation of the critical temperature. The lattice sizes used in the simulation54 are compiled in Table I along with the values of the parameters in the simulated tempering runs. In the figure, the critical temperature is obtained from the curves of UR (T ) (calculated for different values of R and fixed L). The resulting
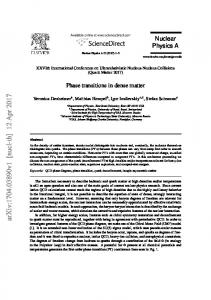
value, kB Tc /wT = 0.7817(1), agrees very well with previous determinations reported in the literature39 . In Ref.39 , a value kB Tc /wT ≈ 0.76 was obtained from the inflection on the function s(T ), being s(T ) the configurational entropy per site of the adlayer as a function of the temperature. Due to the finite-size scaling technique and the simulation procedure used in this contribution, the estimation of Tc in the present work is expected to be more accurate than that reported previously. The study was extended to repulsive longitudinal interactions. Fig. 4 shows the data for a typical case (wL/wT = 1), resulting kB Tc /wT = 0.6098(5), in well agreement with the value obtained in Ref.39 (kB Tc /wT ≈ 0.59). As indicated in Fig. 3, the parameters of the simulation are listed in Table I. Due to the presence of anisotropy (the couplings are taken to be different in the different lattice directions), it is expected that the correlation functions in transversal and longitudinal directions may be governed by correlation lengths diverging with different critical exponents55,56 . However, it is worth pointing out that we do not assume any particular value of the critical exponents for the transitions analyzed here in order to calculate their critical temperatures, since the analysis rely on the order parameter cumulant’s properties57 . In addition, the procedure shown in Figs. 4 and 5 was repeated for the curves of UL (T ), which were obtained for variable L and fixed R. As an example, Fig. 6 presents the results obtained for the case wL /wT = −1. As it is expected, identical results (within numerical errors) are obtained in both ways. Finally,
the
calculations
were
carried
out
for
wL /wT
=
−0.75, −0.50, −0.25, 0.00, 0.25, 0.50 and 0.75 and the results were collected in Table II58 . As it can be observed, the critical temperature presents an non-trivial behavior as a function of wL /wT . An understanding of the dependence of kB Tc /wT on wL /wT can be developed by following the subtle interdependence of energetic and entropic cost necessary to alter the ordered phase. This will be discussed in Section III. III.
THEORETICAL APPROACH: FREE ENERGY MINIMIZATION CRITERION
Hereafter, we will use FEMCA22 in order to discuss the dependence of kB Tc /wT vs. wL /wT obtained from MC simulation. In a closed system of adsorbed particles with repulsive interactions, the phase transition occurring in the adsorbate is a continuous (second-order) phase transition. In other words,
the entropy, S, varies continuously from a completely ordered state (when T → 0) to a
disordered state (when T → ∞). Around Tc , S changes abruptly (but continuously)21 . Then, it’s possible to analyze the phase transition taking into account the Helmholtz free energy, F = E − T S (being E the mean energy), in the two extreme states (maximum order and maximum disorder). Accordingly,
F∞ = lim F T →∞
and
F0 = lim F T →0
(7)
then
F∞ Tc
(8)
F∞ >> F0 ⇒ T < Tc
(9)
F∞ = F0 ⇒ T ≈ Tc
(10)
The last equation allows to determine Tc . This calculation is not exact due to the system does not pass from an extreme order to an extreme disorder. There exist intermediate states between the two extreme states. However, as we will show in the following analysis, the eq. (10) provides a very good approximation for Tc . Interested readers are referred to Ref.22 for a more complete description of FEMCA. In general, for a system of interacting particles at temperature T results:
f0 = e0 − T s0
and
f∞ = e∞ − T s∞
(11)
where e and s represent the mean energy per site and the entropy per site in the thermodynamical limit, respectively, E M →∞ M
e = lim
and
S M →∞ M
s = lim
(12)
If f0 = f∞ , this is e0 − T s0 = e∞ − T s∞
(13)
then T ≈ Tc and Tc ≈
e∞ − e0 ∆e = ∆s s∞ − s0
(14)
From eq. (14), it is possible to calculate the critical temperature and to interpret the dependence of kB Tc /wT with wL/wT obtained from simulations. As in Section II, we restrict the study to θ = 1/3(2/3) and −1 < wL /wT < 1. Case I: θ = 1/3 and wL /wT > 0 In general, e∞ (θ) can be calculated from mean-field approximation. Thus,
e∞ (θ) =
1 (6NθwT + 2NθwL ) 2M
(15)
In this case θ = N/M = 1/3, and
1 1 e∞ (1/3) = wT + wL 3 9
(16)
In order to calculate the entropy of the disordered state, the configurational factor of monomers Ω, is employed
Ω=
M! N!(M − N)!
(17)
kB ln Ω M
(18)
Thus,
s∞ = lim
M →∞
In the particular case of θ = 1/3, the entropy per site of the disordered state results,
s∞ (1/3) = −kB
1 2 ln + ln 2 3 3
�
�
(19)
In addition, the mean energy per site and the entropy per site for the ordered state at θ = 1/3 and T = 0 are e0 (1/3) = s0 (1/3) = 0. Then, the critical temperature depends on the mean energy and the entropy of the disordered state. From eqs. (16), (19) and (14), we obtain Tc (1/3):
Tc (1/3) ≈ ≈
e∞ (1/3) s∞ (1/3) 1 w + 91 wL 3 T �
−kB ln 31 + 23 ln 2
�
(20)
Finally, 1 + 91 wwTL kB Tc (1/3) 3 ≈ wT − ln 31 − 23 ln 2
(wT > 0 and wL /wT > 0)
(21)
Case II: θ = 1/3 and wL /wT < 0 The mean energy and the entropy of the disordered system are as in eqs. (15) and (18). On the other hand, for the ordered system, s0 (1/3) = 0 and e0 (1/3) = wL /3. Then, 1 − 29 wwTL kB Tc (1/3) 3 ≈ wT − ln 31 − 23 ln 2
(wT > 0 and wL /wT < 0)
(22)
As it is expected, the calculations for θ = 2/3 (do not shown here) provide identical results as Cases I and II. Fig. 6 shows the comparison between the simulated results previously presented in Table II and the theoretical predictions obtained from FEMCA for the critical temperature as a function of wL /wT . The MC simulations reveal the main characteristics for the behavior of the critical temperature versus wL /wT : i) the curve presents a minimum for wL /wT = 0; and ii) for negative values of wL /wT , the critical temperatures are higher than the corresponding ones for positive wL /wT ’s. Both characteristics are very well reproduce by FEMCA. The physical meaning of the main features of the critical temperature can be interpreted from the theoretical approach. In this framework, the eq. (14) shows that kB Tc /wT depends on the mean energy and the entropy of the disordered state. The behavior of these quantities as a function of wL /wT allows to understand the arguments presented in the previous paragraph. Thus, the values of s∞ , s0 and e∞ are identical for repulsive and attractive longitudinal interactions. In addition, the magnitude of e0 is constant (e0 = 0) for wL > 0 and increases with wL (e0 = wL /3) for wL < 0. Now we can interpret the difference between the two regimes in Fig. 6. From −1 < wL /wT < 1, the variation in
the entropy is constant. On the other hand, the variation of the mean energy increases linearly with wL , being higher for wL < 0 than for wL > 0. IV.
CONCLUSIONS
In the present work, we have addressed the critical properties of a simple lattice-gas model, which mimics a nanoporous environment, where each nanotube or unit cell is represented by a one-dimensional array. The results were obtained by using MC simulations, finite-size scaling theory and the recently reported FEMCA, which is based on a free energy minimization criterion. The system was characterized by two parameters wL /wT and kB T /wT , being wL and wT , the longitudinal and transversal energy, respectively. We focused on the case of repulsive transversal interaction energy among adsorbed particles (wT = 1) and θ = 1/3(2/3), in such a way that a rich variety of ordered phases are observed in the adlayer: • For wL /wT = 0, the system is equivalent to the well-known triangular lattice in 2D. • For wL/wT < 0, the formation of pairs of nearest-neighbor adsorbed particles along √ √ √ √ the nanotubes is favored. Consequently, the ( 3 × 3) and ( 3 × 3)∗ phases are reinforced and extend along the channels. The critical temperature decreases from 0.7817(1) for wL /wT = −1 to 0.3354(1) for wL /wT = 0.
√ √ √ √ • For wL/wT > 0, the ( 3 × 3) and ( 3 × 3)∗ structures are formed in the planes at low-temperatures and order along the channels in a array of alternating particles. The critical temperature increases from 0.3354(1) for wL /wT = 0 to 0.6098(5) for wL /wT = 1. With respect to the analytical approach, FEMCA provides results in very good qualitative agreement with MC simulations and constitutes a theoretical framework in order to interpret the behavior of kB Tc /wT vs wL /wT in the critical concentrations. Future efforts will be directed to (a) include attractive wT longitudinal interactions between the adparticles, (b) obtain the phase diagram kB Tc /wT versus θ in the whole range of coverage, and (c) develop an exhaustive study on critical exponents and universality.
Acknowledgment
This work was supported in part by CONICET (Argentina) under project PIP 6294 and the Universidad Nacional de San Luis (Argentina) under the projects 328501 and 322000. One of the authors (AJRP) is grateful to the Departamento de Qu´ımica, Universidad Aut´onoma Metropolitana-Iztapalapa (M´exico, D.F.) for its hospitality during the time this manuscript was prepared.
1
R. H. Fowler and E. A. Guggenheim, Statistical Thermodynamics (Cambridge University Press, Cambridge, 1949).
2
T. L. Hill, An Introduction to Statistical Thermodynamics (Addison Wesley Publishing Company, Reading, MA, 1960).
3
H. E. Stanley, Introduction to Phase Transitions and Critical Phenomena (Oxford University Press, New York, 1971).
4
I. Langmuir, J. Am. Chem. Soc. 34, 1310 (1912); 37, 417 (1951); 54, 2798 (1932); Gen. Electron. Rev. 29, 153 (1926); I. Langmuir and K. H. Kingdom, Proc. R. Soc. Lond. A 107, 61 (1925); I. Langmuir and K. H. Kingdom, Phys. Rev. 34, 129 (1919); I. Langmuir and J. B. Taylor, Phys. Rev. 44, 423 (1933); I. Langmuir and D. S. Villars, J. Am. Chem. Soc. 53, 486 (1931).
5
E. Ising, Z. Phys. 31, 253 (1925).
6
H. A. Kramers and G. H. Wannier, Phys. Rev. 60, 252 (1941); Phys. Rev. 60, 263 (1941).
7
E. Montroll, J. Chem. Phys. 9, 706 (1941).
8
L. Onsager, Phys. Rev. 65, 117 (1944).
9
K. Binder and D. P. Landau, Phys. Rev. B 21, 1941 (1980).
10
D. P. Landau, Phys. Rev. B 27, 5604 (1983).
11
A. J. Phares and F. J. Wunderlich, J. Math. Phys. 26, 2491 (1985); Phys. Rev. E 52, 2236 (1995); Phys. Rev. E 55, 2403 (1997); Surf. Sci. 425, 112 (1999); Surf. Sci. 452, 108 (2000); Surf. Sci. 479, 43 (2001).
12
F. Rom´ a and A. J. Ramirez-Pastor, Phys. Rev. E 69, 036124 (2004).
13
A. Patrykiejew, S. Sokolowski and K. Binder, Surf. Sci. Rep. 37, 207 (2000).
14
F. Bulnes, A. J. Ramirez-Pastor and G. Zgrablich, J. Chem. Phys. 115, 1513 (2001); Phys. Rev. E 65, 31603 (2002).
15
T. Nitta, M. Kuro-Oka and K. Katayama, J. Chem Eng. Japan 17, 45 (1984).
16
W. Rudzinki, K. Nieszporek, J.M. Cases, L.I. Michot and F. Villeras, Langmuir 12, 170 (1996).
17
M. Bor´ owko and W. R˙zysko, Journal of Colloid and Interface Science 182, 268 (1996); Ber. Bunsenges. Phys. Chem. 101, 84 (1997).
18
W. R˙zysko and M. Bor´ owko, Journal of Chemical Physics 117, 4526 (2002); Surface Science 520, 151 (2002).
19
A.J. Ramirez-Pastor, T.P. Eggarter, V.D. Pereyra, and J.L. Riccardo, Phys. Rev. B 59, 11027 (1999).
20
A. J. Ramirez-Pastor, J. L. Riccardo and V. D. Pereyra, Surf. Sci. 411, 294 (1998); Langmuir 16, 10169 (2000).
21
F. Rom´ a, A. J. Ramirez-Pastor and J. L. Riccardo, Langmuir 16, 9406 (2000); J. of Chem. Phys. 114, 10932 (2001).
22
F. Rom´ a, A. J. Ramirez-Pastor and J. L. Riccardo, Phys. Rev. B 68, 205407 (2003).
23
S. Ijima, Nature 354, 56 (1991).
24
S. Ijima and T. Ichihashi, Nature 363, 603 (1993).
25
D.S. Bethune, C.H. Kiamg, M. S. deVries, G. Gorman, R. Savoy, J. Vasquez and R. Beyers, Nature 363, 605 (1993).
26
P.M. Ajayan and S. Ijima, Nature 361, 333 (1993).
27
E. Dujardin, T. W. Ebbesen, H. Hiura and K. Tanigaki, Science 265, 1850 (1994).
28
C. Martin, J.P. Coulomb, Y. Grillet and R. Kahn, Fundamentals of Adsorption: Proceedings of the Fifth International Conference, edited by M.D. LeVan (Kluwer Academic Publishers, Boston Massachusetts, 1996),
p.587. 29
R. Radhakrishnan and K.E. Gubbins, Phys. Rev. Lett. 79, 2847 (1997).
30
A. Boutin, R.J.-M. Pellenq and D. Nicholson, Chem. Phys. Lett. 219, 484 (1994).
31
V. Lachet, A. Boutin, R.J.-M. Pellenq, D. Nicholson and A.H. Fuchs, J. Phys. Chem. 100, 9006 (1996).
32
T. Maris, T.J.H. Vlugt and B. Smit, J. Phys. Chem. 102, 7183 (1998).
33
C. Martin, N. Tosi-Pellenq, J. Patarin and J.P. Coulomb, Langmuir 14, 1774 (1998).
34
N. M. Urban, S. M. Gatica, M.W. Cole and J.L. Riccardo, Phys. Rev. B 71, 245410 (2005).
35
M. M. Calbi and J.L. Riccardo, Phys. Rev. Lett. 94, 246103 (2005).
36
Lev D. Gelb, K. E. Gubbins, R. Radhakrishnan and M. Sliwinska-Bartkowiak, Rep. Prog. Phys. 62, 1753 (1999).
37
R.A. Trasca, M.M. Calbi and M.W. Cole, Phys. Rev. E 65, 061607 (2002).
38
R.A. Trasca, M.M. Calbi, M.W. Cole and J.L. Riccardo, Phys. Rev. E 69, 011605 (2004).
39
P. M. Pasinetti, J. L. Riccardo and A. J. Ramirez-Pastor, J. Chem. Phys. 122, 154708 (2005).
40
P. M. Pasinetti, J. L. Riccardo and A. J. Ramirez-Pastor, Physica A 355, 383 (2005).
41
K. Hukushima and K. Nemoto, J. Phys. Soc. Jpn. 65, 1604 (1996).
42
D. J. Earl and M. W. Deem, e-print cond-mat/0508111.
43
M. E. Fisher, in: Critical Phenomena, edited by M. S. Green, (Academic Press, London, 1971) pp.1.
44
V. Privman, Finite Size Scaling and Numerical Simulation of Statistical Systems (World Scientific, Singapore, 1990).
45
K. Binder, Applications of the Monte Carlo Method in Statistical Physics: Topics in current Physics (Springer, Berlin, 1984), Vol. 36.
46
D. Nicholson and N. G. Parsonage, Computer Simulation and the Statistical Mechanics of Adsorption (Academic Press, London, 1982).
47
N. Metropolis, A.W. Rosenbluth, M.N. Rosenbluth, A.H. Teller and E. Teller, J. Chem. Phys. 21, 1087 (1953).
48
K. Kawasaki, in: Phase Transitions and Critical Phenomena, edited by C. Domb and M. S. Green, (Academic Press, London, 1972), Vol. 2.
49
By inspecting the Fig. 1, it’s possible to note that the configuration presented in a) was formed on the sublattice 1.
50
B. D. Metcalf, Phys. Lett. A 45, 1 (1973).
51
W. Kinzel and M. Schick, Phys. Rev. B 23, 3435 (1981).
52
K. K. Chin and D. P. Landau, Phys. Rev. B 36, 275 (1987).
53
P. M. Pasinetti, F. Rom´ a, J. L. Riccardo and A. J. Ramirez-Pastor, e-print cond-mat/0606391.
54
As it is common in MC simulations, one represents the system with a unit cell of sites that is repeated periodically. Then, the choice of appropriate sizes in the transversal direction has to be done in such a way that the ordered structures are not disturbed.
55
E. Barouch, B. M. McCoy and T. T. Wu, Phys. Rev. Lett. 31, 1409 (1973).
56
K. Binder and J. S. Wang, J. Stat. Phys. 55, 87 (1989).
57
A systematic analysis of critical exponents for each wL /wT was not carried out since this was out of the scope of the present work.
58
The calculations for wL /wT = 1.0 and wL /wT = −1.0 were carried out with an effort reaching almost the limits of our computational capabilities. In the case of intermediate values of wL /wT , the number of MCS was restricted in order to get results in a reasonably computational time. These conditions are reflected in the different values of the numerical errors reported in Table II.
V.
TABLE AND FIGURE CAPTIONS
Table I Parameters of the simulated tempering runs for two typical cases (wL /wT = −1, 1). Table II Critical temperatures corresponding to the critical coverage θ = 1/3(2/3). The data were obtained from the crossing of the cumulants. Figure 1: a) Snapshot of two successive planes, k and k + 1, for a possible configuration of the ordered phase appearing at θ = 1/3 and repulsive longitudinal interactions. Solid circles represent occupied sites. The different sublattices used in order to define a local order parameter characterizing this low temperature structure are shown in parts b)-c). Figure 2: Different sublattices defined for attractive longitudinal interactions and θ = 1/3. Figure 3: UR (T ) and UL (T ) [inset] versus kB T /wT , for a typical case of wL < 0: θ = 1/3 and wL /wT = −1. Figure 4: UR (T ) versus kB T /wT for θ = 1/3 and wL /wT = 1. Figure 5: UL (T ) versus kB T /wT for θ = 1/3 and wL /wT = −1. Figure 6: Comparison between simulated and theoretical results for kB Tc /wT vs. wL /wT at θ = 1/3(2/3). The dotted lines are a guide for the eyes.
TABLE I
wL/wT R L m n1 −1
1
n2
nM CS kB Tmin /wT kB Tmax /wT
18 60 12 103 105
105
0.780053
0.782705
24 60 20 103 105
105
0.777400
0.784600
36 60 12 103 105
105
0.780053
0.782705
48 60 11 103 105
105
0.780500
0.782500
18 60 12 103 5.105 5.105
0.601053
0.617632
24 60 12 103 5.105 5.105
0.601053
0.617632
36 60 12 103 5.105 5.105
0.601053
0.617632
48 60 12 103 5.105 5.105
0.601053
0.617632
TABLE II kB Tc /wT wL /wT θ = 1/3 (2/3) -1.00
0.7817(1)
-0.75
0.695(4)
-0.50
0.604(4)
-0.25
0.495(4)
0.00
0.3354(1)
0.25
0.436(1)
0.50
0.506(1)
0.75
0.562(1)
1.00
0.6098(5)
Fig.1: P.M.Pasinetti et al.
Fig.2: P.M.Pasinetti et al.
wL / wT = -1
0.6
UR
kBT/wT = 0.7817(1)
0.4
0.2
0.780
R = 18; L = 60 R = 24; L = 60 R = 36; L = 60 R = 48; L = 60
0.781
0.782
kBT/wT
0.783
Figure 3: P. M. Pasinetti et al.
wL / wT = 1
0.66
UR
kBT/wT = 0.6098(5)
0.64
0.62
R = 18; L = 60 R = 24; L = 60 R = 36; L = 60 R = 48; L = 60
0.604
0.608
kBT/wT
0.612
0.616
Figure 4: P. M. Pasinetti et al.
wL / wT = -1
0.6
UL
0.4
0.2
0.780
R = 36; L = 24 R = 36; L = 36 R = 36; L = 48 R = 36; L = 60 kBT/wT = 0.7817(1)
0.781
0.782
kBT/wT
0.783
Figure 5: P. M. Pasinetti et al.
1.0
kBTC / wT
0.8
θ = 1 / 3 (2 / 3)
0.6 0.4 0.2 0.0 -1.0
FEMCA MC simulation
-0.5
0.0
wL / wT
0.5
1.0
Figure 6: P. M. Pasinetti et al.