7528 • The Journal of Neuroscience, May 30, 2012 • 32(22):7528 –7537
Behavioral/Systems/Cognitive
Surprise and Error: Common Neuronal Architecture for the Processing of Errors and Novelty Jan R. Wessel,1,2 Claudia Danielmeier,3 J. Bruce Morton,4 and Markus Ullsperger2,3,5 1
University of California San Diego, La Jolla, California 92093, 2Max Planck Institute for Neurological Research, D-50931 Cologne, Germany, 3Radboud University Nijmegen, 6500 HB Nijmegen, The Netherlands, 4University of Western Ontario, London, Ontario, Canada N6A 5A5, and 5Otto-von-GuerickeUniversität Magdeburg, 39106 Magdeburg, Germany
According to recent accounts, the processing of errors and generally infrequent, surprising (novel) events share a common neuroanatomical substrate. Direct empirical evidence for this common processing network in humans is, however, scarce. To test this hypothesis, we administered a hybrid error-monitoring/novelty-oddball task in which the frequency of novel, surprising trials was dynamically matched to the frequency of errors. Using scalp electroencephalographic recordings and event-related functional magnetic resonance imaging (fMRI), we compared neural responses to errors with neural responses to novel events. In Experiment 1, independent component analysis of scalp ERP data revealed a common neural generator implicated in the generation of both the error-related negativity (ERN) and the novelty-related frontocentral N2. In Experiment 2, this pattern was confirmed by a conjunction analysis of event-related fMRI, which showed significantly elevated BOLD activity following both types of trials in the posterior medial frontal cortex, including the anterior midcingulate cortex (aMCC), the neuronal generator of the ERN. Together, these findings provide direct evidence of a common neural system underlying the processing of errors and novel events. This appears to be at odds with prominent theories of the ERN and aMCC. In particular, the reinforcement learning theory of the ERN may need to be modified because it may not suffice as a fully integrative model of aMCC function. Whenever course and outcome of an action violates expectancies (not necessarily related to reward), the aMCC seems to be engaged in evaluating the necessity of behavioral adaptation.
Introduction Because everyday life is volatile, unexpected events often occur. These events can have internal causes (e.g., mistyping a word), while, in other cases, the causes are external (e.g., being hit in the eye by a stray fly). In a research context, the former are referred to as “errors,” and are typically investigated using speeded choice reaction-time tasks. The latter are referred to as “novel events” and are typically investigated using novelty-oddball paradigms (Courchesne et al., 1975; Squires et al., 1975), in which participants monitor a series of stimuli for task-relevant “oddball” stimuli, but are occasionally presented with task-irrelevant “novel” stimuli. Although normally studied independently, errors and novel events can be viewed as similar: both are relatively infrequent, unexpected, call for ad hoc processing, and lead to rapid cognitive and behavioral adaptation. Notebaert et al. (2009) argue that errors and novel events are related in that both elicit an orienting response. The neural cir-
Received Dec. 20, 2011; revised March 28, 2012; accepted April 4, 2012. Author contributions: J.R.W., J.B.M., and M.U. designed research; J.R.W. and J.B.M. performed research; J.R.W., C.D., J.B.M., and M.U. analyzed data; J.R.W., C.D., J.B.M., and M.U. wrote the paper. This work was supported by a grant from the Gertrud Reemtsma Foundation for Brain Research to J.R.W. We thank Dr. Gerhard Jocham for constructive suggestions on the fMRI analysis; Sabrina Doering and Patricia Perez-Prat for help with EEG data collection; and E. Bannemer, U. Juchellek, A. Ru¨hling, R. Rusniak-Florath, and K. Wittenberg for help with fMRI data collection. Correspondence should be addressed to Jan R. Wessel, University of California, San Diego, Psychology Department, 3133 McGill Hall, 9500 Gilman Drive, La Jolla, CA 92103. E-mail:
[email protected]. DOI:10.1523/JNEUROSCI.6352-11.2012 Copyright © 2012 the authors 0270-6474/12/307528-10$15.00/0
cuitry underlying this common orienting response possibly includes the anterior midcingulate cortex (aMCC), part of posterior medial frontal cortex (pMFC). According to one recent computational account (Alexander and Brown, 2011), the aMCC functions as a comparator of action outcomes and their relative likelihood, regardless of whether outcomes are better or worse than expected. Consistent with this idea, evidence indicates that the monkey homolog of the aMCC codes valence-independent reward prediction errors (Matsumoto et al., 2007; Hayden et al., 2011). Therefore, one might predict aMCC involvement in the processing of both errors and novel events, insofar as both are infrequent and unexpected. Error-related activity in the aMCC is frequently reported (Ridderinkhof et al., 2004). One important index of error-related aMCC activity in humans is the error-related negativity (ERN) (Falkenstein et al., 1991; Gehring et al., 1993), a frontocentral radial negative voltage component that has been source-localized to the aMCC (Dehaene et al., 1994; Debener et al., 2005). The ERN is followed by a positive deflection, the error-positivity (Pe; Falkenstein et al., 2000; Overbeek et al., 2005). Novel events, on the other hand, elicit the N2/P3-complex, a cascade of waveforms comprising the N2b (Na¨a¨ta¨nen and Gaillard, 1983; for review, see Folstein and Van Petten, 2008) and the P3a (Polich, 2007). Because ERN and novelty-N2b are frontocentrally distributed negativities, there has been speculation about their functional equivalence (van Veen et al., 2004). Still, direct evidence for a common neuronal coding scheme underlying errors and novelty in humans remains lacking.
Wessel et al. • Common Neural Architecture for Novelty and Errors
J. Neurosci., May 30, 2012 • 32(22):7528 –7537 • 7529
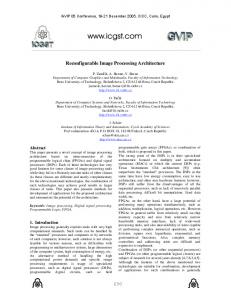
Figure 1. Experimental paradigm. After an initial fixation period, the imperative stimulus (5-letter array consisting of one target stimulus flanked by 2 distractors on each side) was displayed on the screen (the example shows an incompatible trial). Ten milliseconds after the response to that stimulus, one of three visual action effects were displayed: an upward pointing triangle, which appeared regardless of response accuracy (standard visual action effect); a downward-pointing triangle, which appeared exactly three times, at equal intervals, over the duration of the experiment (target visual action effect); or a picture of an object/animal, which occasionally appeared following correct responses (novel visual action effect).
The present study therefore measured the neuronal response to error and novelty processing using EEG (Experiment 1) and fMRI (Experiment 2). Participants were administered a hybrid flanker-novelty-oddball paradigm in which they monitored visual action effects for possible target stimuli (Fig. 1). Occasionally, the action effect was a novel stimulus. We predicted that errors and novel events would be associated with the ERN and N2b, respectively. Of interest was whether the novelty-N2b could be explained by activity in the ERN source network and whether errors and novelty would be associated with overlapping activity in the aMCC.
Materials and Methods Participants. For Experiment 1, participants included 19 volunteers (10 female; mean age, 24.8 years old; SD, 3.1; youngest, 20 years old; oldest, 30 years old; all right-handed) with normal or corrected-to-normal vision. For Experiment 2, participants included 21 volunteers (12 female; mean age, 24.7 years old; SD, 2.6; youngest, 20 years old; oldest, 30 years old; one left-handed) with normal or corrected-to-normal vision. In Experiment 2, data from two participants were excluded from the analysis because the error rate exceeded 50%. All participants were free of preexisting neurological or psychiatric conditions, provided informed consent, and received monetary compensation for participating. Both experiments were conducted in accordance with the Declaration of Helsinki. Stimuli. Subjects were presented with a letter version of the Eriksen flanker task (Eriksen and Eriksen, 1974; Fig. 1) using the Presentation Software Package (Neurobehavioral Systems). Stimuli included the letters H, Z, S, and X. Two letters mapped to a right response button, and two mapped to a left button (e.g., S and X to the left, H and Z to the right). Response mappings were counterbalanced across participants, and were displayed on the screen throughout the experiment. Each trial consisted of a fixation period, whose duration was randomly drawn from a uniform distribution consisting of the values 0, 400, 700, 900, 1100, or 1500 ms, followed by an imperative stimulus of a fixed 70 ms duration. Imperative stimuli consisted of a five-letter string in which elements of the string were drawn from the fixed set of four letters (i.e., S, X, H, Z) described above. The middle element was deemed the “imperative stimulus”; elements presented to the left and right of the target were deemed
“flankers.” On compatible trials, the imperative stimulus and the flankers specified the same response (e.g., S and X); on incompatible trials, they specified different responses (e.g., S and Z). Subjects were instructed to press the button on a two-button response box that corresponded with the imperative stimulus within an adaptive response-time window. Ten milliseconds after the response, one of three kinds of stimuli appeared for 400 ms, followed by the next trial. On most trials, a standard stimulus consisting of an upward-pointing triangle was displayed. This visual action effect was not indicative of performance, as the upwardpointing triangle appeared on correct and erroneous responses alike. Participants were instructed to monitor this visual action effect for the occurrence of a target stimulus (a downward-pointing triangle), and to indicate its appearance by pressing a third button on the response box. This target stimulus occurred exactly three times, at approximately equal intervals over the duration of the task. Its purpose was to ensure participants monitored the visual action effect of each response. Unbeknownst to the participant, novel stimuli were periodically and unexpectedly presented in lieu of the standard upward-pointing triangle. Novel stimuli consisted of 1 of 100 different black-and-white silhouettes of familiar everyday objects taken from the database of the International Picture Naming Project (Bates et al., 2003; Szekely et al., 2004). The pictures were comparable in size, quality, and graphic complexity and matched the size and quality of the triangles. Emotionally evocative pictures (e.g., spiders) were excluded. Novel stimuli were dynamically matched to performance such that (1) the frequency of novel action effects was matched to the error rate of each participant, and (2) novel and erroneous trials were matched with respect to flanker congruency. To this end, the probability of a novel action effect on a given correct trial in each flanker congruency condition (congruent and incongruent) was determined by the difference between the past error rate for that congruency condition and the past novel probability for that congruency condition (normalized by the error rate), weighted by the mean of the number of trials since the last error (divided by a constant of 3) and the number of trials since the last novel action effect (divided by a constant of 2). If the number of overall novels generated based on this algorithm happened to exceed the number of errors by ⬎3 at any given time, the probability of a novel occurring was set to 0 for the current trial. Novel and target visual action effects followed only correct responses. Together then, there were four trial types in total: correct trials with a standard visual action effect (standard trials); three correct trials with a target visual action effect (target trials);
7530 • J. Neurosci., May 30, 2012 • 32(22):7528 –7537
correct trials with a novel visual action effect (novel trials); and errors, with the latter two trial types matched with respect to frequency of occurrence and flanker compatibility. In all, the task consisted of 424 trials (plus 19 null-events for the fMRI experiment). EEG recording. The experiment was conducted in a dim, electrically and acoustically shielded chamber. EEG activity was recorded with Ag/ AgCl-sintered electrodes mounted on an elastic cap (Easycap) from 60 scalp sites of the extended 10 –20 electrode system. The ground electrode was located at F2. The electrooculogram was recorded from an electrode above the left eye, an electrode below the left eye, an electrode at the outer canthus of the right eye, and an electrode at the outer canthus of the left eye. Electrode impedance was kept ⬍5 k⍀. Potentials were online referenced to electrode CPz and rereferenced offline to an average reference. Data were recorded continuously and were converted from analog to digital with a 16 bit resolution at a sampling rate of 500 Hz using BrainAmp MR plus amplifiers (Brain Products), with recording filters set to 0.016 Hz high pass and 250 Hz low pass. EEG preprocessing. EEG analyses were conducted using custom routines under Matlab 2010a (Math Works) and routines taken from the EEGLAB Toolbox (Version 9; Delorme and Makeig, 2004). After importation into Matlab, the continuous data were filtered with a low cutoff value of 0.5 Hz and a high cutoff value of 30 Hz using two-way leastsquares finite impulse response filtering. The resulting data were subsequently cut into stimulus-locked segments spanning a time range of ⫺500 –2500 ms with respect to stimulus onset and baseline corrected with the time range immediately preceding the stimulus (⫺100 ms to stimulus onset) serving as baseline. To clean these segments of spurious gross-movement and other nonstereotyped artifacts, segments with highly improbable data patterns were identified and rejected according to the recommended sequence of preprocessing steps before the use of independent component analysis (ICA) put forward by Delorme et al. (2007). Such nonstereotyped artifact segments were identified using the joint probability of values in each segment and the joint probability distribution of all segments (both cutoff values were set to ⫾5 SD; see Delorme et al., 2007). In addition, the data were also checked visually for residual nonstereotyped artifact activity. Segments corresponding to the three target trials and misses (trials without responses) were excluded from further analyses. After rereferencing the cleaned data to a common average, the datasets were subjected to a temporal ICA (Jutten and Herault, 1991; Makeig et al., 1996) using the infomax algorithm (Bell and Sejnowski, 1995). The resulting component matrix was screened for independent components (ICs) representing stereotyped artifact activity, such as horizontal (saccades) and vertical (blinks) eye movements, and electrode artifacts. This was achieved in a multistep procedure. First, we obtained dipole solutions for all ICs using the Dipfit plug-in for EEGLAB, rejecting all ICs with dipole solutions outside the brain, and with a residual variance larger than 15% for both one and two dipole solutions, as these ICs are unlikely to represent meaningful event-related activity (Onton et al., 2006). Second, we identified ICs representing eye movements using a multistep correlational template-matching process as implemented in CORRMAP v1.02 (Viola et al., 2009). Third, residual electrode artifacts were identified by using Grubbs’ iterative test for outliers with a significance threshold of p ⬍ 0.0001 to test the IC maps for extremely focal activity. IC maps with such focal activity usually represent electrode artifacts. Finally, ICs slated for removal (i.e., those identified as artifacts by any of the above methods) and retention (i.e., the remaining ICs) were visually screened for erroneous classifications. Artifact ICs were then calculated out of the data by means of inverse matrix multiplication. Independent component identification. We used the cleaned, preprocessed EEG datasets and their respective ICA decompositions to employ automated IC identification based on the Compass algorithm (Wessel and Ullsperger, 2011). Our goal was to first identify ICs that explained a significant proportion of error-related activity in the EEG signal, and then to test whether these same ICs could also explain novelty-driven EEG deflections (for a similar logic, see Gentsch et al., 2009; Roger et al., 2010). For this, we computed difference waves between all error and all standard trials (novel trials were not included in this analysis). We subjected these difference waves to the Compass algorithm to identify elec-
Wessel et al. • Common Neural Architecture for Novelty and Errors
trodes of maximal activity in the typical ERN time range, 0 –100 ms following the response. This was computed on the basis of outlier statistics for the average voltage topography in that time range (for details, see Wessel and Ullsperger, 2011). We subsequently identified ICs that explained significant parts of the difference waveform in the ERN time range. Using this rationale, we identified 1.8 ICs on average (range, 1–2) per subject that represented error-related activity in the ERN time range. This number matches that of an earlier study using ICA on 64 channel EEG from a standard, arrow version of the flanker task without the novelty component (Danielmeier et al., 2009; Wessel and Ullsperger, 2011). We then reconstructed error-related IC activity on all trial types (standard, novel, errors) by back-projecting the activity of these ICs into channel space. That is, the original channel EEG was reconstructed based only on the error-related activity accounted for by these ICs. ERP quantification. To obtain ERN amplitudes, the segmented data were first segmented in a response-locked fashion, spanning a time-range of ⫺100 –900 ms with respect to the erroneous response. ERN amplitude in each subjects’ averaged ERP was then quantified, using a trough-topeak rationale, by computing the difference between the most negative voltage deflection in the first 100 ms following each response at electrode Cz (at which most subjects had their maximal ERN difference), and the most positive voltage deflection in the time range from 50 ms preresponse to the point of the abovementioned negative peak (notably, the results did not change when using mean amplitude quantifications). N2b amplitudes in each subject’s averaged ERP were extracted by computing the mean voltage amplitude at electrode Cz in the time range from 200 to 400 ms following each visual action effect. fMRI data acquisition. Magnetic resonance images were acquired using a 3 tesla Siemens Magnetom Trio Scanner and a standard birdcage head coil. Twenty-seven T2*-weighted slices (thickness, 3 mm; distance factor, 14%) parallel to the anterior commissure-posterior commissure axis were obtained using a single-shot gradient echo-planar imaging (EPI) sequence (parameters: TR, 2000 ms; volume acquisition, between 200 and 2000 ms; TE, 30 ms; flip angle, 90°; 64 ⫻ 64 pixel matrix; FOV, 210 mm). To assist in the localization of functional activations, a highresolution T1-weighted three-dimensional anatomical reference dataset was also acquired from each participant by means of a modified driven equilibrium Fourier transform sequence. fMRI data preprocessing. Analysis of fMRI image data was performed using the Oxford Center for Functional MRI of the Brain (FMRIB) Software Library (version 4.1.7, http://www.fmrib.ox.ac.uk/fsl; Smith et al., 2004). Nonbrain data were removed from both anatomical and functional datasets using the Brain Extraction Tool (Smith, 2002). The functional data were subsequently corrected for motion using rigid body registration to the central volume (Jenkinson et al., 2002). Data were then high-pass filtered in the temporal domain using a cutoff of 128 s, and spatially smoothed by means of a Gaussian filter with a full width at half maximum of 5 mm. The data were whitened to correct for local autocorrelations (Woolrich et al., 2001). EPI images were then coregistered with their corresponding high-resolution anatomical image and normalized into Montreal Neurological Institute (MNI) space by means of robust linear affine registration as implemented in the FMRIB’s Linear Image Registration Tool (Jenkinson and Smith, 2001). fMRI data analysis. Preprocessed imaging data were modeled by means of a general linear model (GLM) using the FMRI Expert Analysis Tool. The GLM included separate predictors for standard, novel, and error events. Predictors were generated by convolving a vector of onsets for each trial type (standard, novel, error) with a double-gamma hemodynamic response function. The temporal derivatives of these three regressors were also included in the model, as was the flanker compatibility for correct and erroneous trials separately, using regressors that were coded with ⫺1 for incompatible and ⫹1 for compatible stimuli, timelocked to stimulus onset. These regressors were modeled onto the 4D imaging data, using a cluster-based familywise error-rate correction with a cutoff threshold of z ⬎ 3.09 and a cluster p value of 0.01. Voxels that showed a larger BOLD response both to errors and novel events relative to standards were identified by means of a conjunction analysis (Nichols et al., 2005) corrected by means of a cluster-based familywise correction with a threshold of z ⱖ 2.3, and a cluster p value of 0.01.
Wessel et al. • Common Neural Architecture for Novelty and Errors
J. Neurosci., May 30, 2012 • 32(22):7528 –7537 • 7531
Figure 3. Comparison of classic and IC-based ERPs. Note that (1) the 1.8 ICs selected to represent ERN activity do indeed explain virtually all of the difference between errors and standard trials in the ERN time range, and (2) the frontocentral nature of the ERN⬘s voltage pattern is much more evident and differentiated in the IC-based analysis (compare with Fig. 2, topographies). A, Event-related potentials. B, Scalp topographies.
Figure 2. Grand mean event-related potential results. A, Response-locked waveforms at midline electrode Cz for standard (gray line), error (solid black line), and novel (dashed black line) trials. B, Topographical voltage distribution over the scalp at ERN peak latency (42 ms; upper row) and N2 peak latency (322 ms; lower row) for standard (left), error (middle), and novel (right) trials, respectively. To identify regions that showed a larger BOLD response for errors than novel events and vice versa, we contrasted both (1) differences between the errors and standard trials and (2) contrasts between novel and standard trials on the second level (clusterwise z, 2.3; cluster p value, 0.01).
Results Experiment 1: Behavior Subjects committed an average of 53.37 errors (range, 26 – 88) per 424 trials, yielding an average error rate of 12.57% (SD, 4.3%; minimum, 6.0%; maximum, 20.0%). The subjects effectively monitoring the visual action effect, indicated by an average target detection rate of 96% (all but one subject signaled all targets; one subject signaled only one of the four but showed otherwise typical behavior). The experimentally controlled matching of novel and error frequency was effective, as reflected by a Pearson correlation between error and novel numbers of r ⫽ 0.98, p ⬍ 0.0001 [average number of novel trials of 50.7 (minimum, 26; maximum, 78)]. Also, error and novel trials were matched with respect to the frequency of compatibility: mean percentage of incompatible trials on error and novel trials was 64.8% and 65.8%, respectively. Importantly, the percentage of incompatible trials on error and novel trials also correlated highly across subjects: r ⫽ 0.98, p ⬍ 0.0001. Mean reaction times were comparable among conditions (standards, 652 ms; novels, 667 ms; errors, 673 ms; F(2,36) ⫽ 1.123; p ⫽ 0.313). Correct trials following errors were significantly slower than correct trials following correct trials, indicating significant posterror slowing (PES; 674 ms for posterror trials vs 648 ms for postcorrect trials; t(18) ⫽ 3.28, p ⬍ 0.01, one-sided). Also, correct trials following novels were significantly slower than correct trials following correct trials, indicating significant postnovel slowing (PNS; 675 ms for postnovel trials vs 648 ms for postcorrect trials, t(18) ⫽ 4.12, p ⬍ 0.001, one-sided). To address the possibility that measures of PES and PNS were
Figure 4. A, Error-related IC activity also explains a significant portion of the novelty N2 (solid black line). B, Voltage topographies of the different signal compositions: the ERN ICs (middle) show the classic radial central scalp distribution at the N2 peak that is also evident for the ERN (see Fig. 3), whereas the activity of all other non-ERN ICs (left) seems to be mostly stemming from the bilateral occipital cortex, with a dipole projection onto the central scalp electrodes.
confounded by stimulus compatibility, we ran these analyses again on a subset of correct trial sequences matched to errorcorrect and novel-correct sequences with respect to flanker compatibility on preceding and current trials. Both posterror and postnovel slowing remained significant: PES; t(18) ⫽ 1.74, p ⬍ 0.05, one-sided; PNS: t(18) ⫽ 2.44, p ⫽ 0.013, one-sided. Experiment 1: EEG-event-related potentials The response-locked/visual action effect-locked ERPs were characterized by the presence of the expected waveforms for errors and novel trials. After artifact rejection, an average of 49.8 errors (range, 22– 83), 49.6 novel trials (range, 25–77), and 309.4 correct
Wessel et al. • Common Neural Architecture for Novelty and Errors
7532 • J. Neurosci., May 30, 2012 • 32(22):7528 –7537
Table 1. Anatomical regions and MNI coordinates for global and local statistical maxima for the basic contrast reflecting error processing Hemisphere x
y
Error ⬎ standard aMCC Pre-SMA dmPFC (BA 8) aMCC/pACC Anterior insula/IFG p. opercularis Anterior insula IFG p. orbitalis IFS IFJ IFG p. orbitalis IFG p. triangularis Precentral s./PMd Anterior insula/IFG p. opercularis IFG p. orbitalis IFG p. triangularis IFS Anterior insula
R/L R/L R/L R/L R R R R R R R R L L L L L
25 41 19,918 13 58 34 53 32 17 24 ⫺8 20,034 19 ⫺2 26 ⫺1 26 19 7 39 23 ⫺17 17 25 6 48 26 ⫺6 11,521 21 0 29 17 27 18 20 9 8 ⫺10 8 37 3129 ⫺58 47 7046 ⫺49 36 ⫺45 45 ⫺44 24 ⫺50 43 4362 ⫺63 48 ⫺41 44
IFJ IPS horizontal part TPJ/angular g. IPS/IPL TPJ/STS IPS horizontal part IPL, supramarginal g. STS/MTG STS Calcarine s. Calcarine s. Thalamus, VA/VLa Thalamus, MD Habenula Zona incerta/STN Midbrain, SN Midbrain Lateral geniculate/hippocampus Standard ⬎ error No significant activations
L R R R R L L R R R L L L R L R R R
0 ⫺3 3 4 40 31 52 50 47 35 55 53 ⫺34 ⫺55 ⫺58 ⫺38 ⫺33 ⫺43 ⫺47 39 57 47 58 ⫺35 ⫺33 ⫺44
11 ⫺4 ⫺13 ⫺7 6 ⫺7 6 7 23
z
Volume (mm 3) z score
Anatomical region
⫺73 7 ⫺70 9 ⫺3 7 ⫺19 8 ⫺22 0 ⫺13 ⫺2 ⫺16 ⫺13 ⫺30 ⫺6 ⫺25 ⫺8
7362 4373
5.77 5.02 3.87 3.68 5.74 5.17 5.03 4.88 4.81 4.78 4.47 4.34 5.73 4.50 3.90 3.90 3.62 3.56 4.38 4.65 4.20 4.14 3.48 4.65 4.40 3.74
4.67 4.42 4.39 4.36 4.05 3.91 3.82 3.75 3.66
No volume given for local submaxima within a larger activation. Results obtained at a threshold of z ⫽ 3.09 and p ⬍ 0.01, corrected. aMCC, anterior midcingulate cortex; BA, Brodmann area; dmPFC, dorsomedial prefrontal cortex; g., gyrus; IFG, inferior frontal gyrus; IFJ, inferior frontal junction; IFS, inferior frontal sulcus; IPL, intraparietal lobule; IPS, intraparietal sulcus; L, left; MD, mediodorsal.; MTG, middle temporal gyrus; p., pars; pACC, posterior anterior cingulate cortex; PMd, dorsal premotor; pre-SMA, pre-supplementary motor area; R, right; s., sulcus; SN, substantia nigra; STN, subthalamic nucleus; STS, superior temporal sulcus; Va, ventral anterior (nucleus); Vla, ventrolateral anterior (nucleus).
trails (range, 238 –370) were included this analysis. In the first 100 ms following an error, we noted a prominent frontocentral radial negative voltage deflection, which had its maximum amplitude at electrodes FCz/Cz for all subjects [we report results at Cz, which is where most subjects had the maximal difference between ERN and correct-related negativity (CRN), but the ERN results were qualitatively identical at electrode FCz]. The amplitude of this ERN for errors and CRN for standard and novel trials differed significantly between conditions (F(2,36) ⫽ 21.651, p ⬍ 0.001), and was significantly enlarged for errors compared with standard (t(18) ⫽ 5.6, p ⬍ 0.001) and novel trials (t(18) ⫽ 3.91, p ⫽ 0.001). CRN amplitude also differed between novel and standard trials. This effect was potentially due to an unforeseen consequence of matching novel and error trials in conflict frequency (flanker compatibility), resulting in higher conflict frequency for novel
Table 2. Anatomical regions and MNI coordinates for global and local statistical maxima for the basic contrast reflecting novelty processing Anatomical region
Hemisphere x
Novel ⬎ standard aMCC/dmPFC (BA 8) dmPFC (BA 8) Pre-SMA Pre-SMA aMCC/pre-SMA IFG p. triangularis
R/L R/L R/L R/L R/L R
IFG p. orbitalis IFJ/IFS Posterior/lateral OFC Anterior insula/IFG p. opercularis
R R R R
Precentral s. IFG p. orbitalis/lateral OFC IFG p. triangularis IFJ/IFS IFG p. orbitalis Anterior insula/IFG p. opercularis Anterior insula OFC Lateral geniculate/hippocampus Amygdalohippocampal area Hippocampus
R L L L L L L L R R R
Pulvinar Habenula Collateral s./Parahippocampal g. Occipital gyri Occipitotemporal/fusiform g. IPS SPL/PPC ITG Collateral s. Parahippocampal g. Collateral s./parahippocampal g. MTG/TPJ ITS/ITG Collateral s./parahippocampal g. Occipital gyri ITG IPS posterior part Lateral geniculate/hippocampus Occipitotemporal/fusiform g. IPS/PPC IPS Collateral s./parahippocampal g. MTG Standard ⬎ novel No significant activations
R L R R R R R R R R R R L L L L L L L L L L L
⫺6 4 ⫺4 1 ⫺2 48 51 54 43 27 36 37 53 ⫺37 ⫺47 ⫺40 ⫺50 ⫺44 ⫺29 ⫺27 19 22 26 34 10 ⫺4 31 36 43 31 33 56 30 28 26 53 ⫺41 ⫺29 ⫺41 ⫺53 ⫺29 ⫺18 ⫺35 ⫺30 ⫺33 ⫺24 ⫺56
y
z
33 35 12 23 22 33 24 32 12 32 29 28 7 36 33 12 40 23 27 29 ⫺31 ⫺8 ⫺23 ⫺16 ⫺29 ⫺28 ⫺48 ⫺88 ⫺76 ⫺67 ⫺65 ⫺60 ⫺72 ⫺35 ⫺58 ⫺53 ⫺56 ⫺58 ⫺83 ⫺69 ⫺69 ⫺31 ⫺71 ⫺80 ⫺52 ⫺47 ⫺57
42 47 53 58 45 8 19 ⫺3 26 ⫺16 ⫺9 5 46 ⫺18 2 31 ⫺12 ⫺2 ⫺5 ⫺20 ⫺3 ⫺19 ⫺9 ⫺16 2 1 ⫺12 7 ⫺5 45 59 ⫺7 ⫺6 ⫺15 ⫺7 8 ⫺8 ⫺8 1 ⫺4 40 ⫺5 ⫺5 26 48 ⫺11 5
Volume (mm 3) z-score 3071
24,332
19,251
5030
36854
26,742
4.35 3.9 3.77 3.54 3.45 6.08 5.23 4.95 4.90 4.68 4.58 3.67 4.47 5.03 4.89 4.74 4.50 4.00 3.73 3.57 4.95 4.55 3.89 3.39 3.46 3.54 6 5.99 5.90 4.94 4.88 4.51 4.47 4.46 4.45 4.44 6.18 5.67 5.56 5.37 4.91 4.83 4.78 4.61 4.20 3.87 3.79
No volume given for local submaxima within a larger activation. Results obtained at a threshold of z ⫽ 3.09 and p ⬍ 0.01, corrected. aMCC, anterior midcingulate cortex; BA, Brodmann area; dmPFC, dorsomedial prefrontal cortex; IFG, inferior frontal gyrus; IFJ, inferior frontal junction; IFS, inferior frontal sulcus; IPS, intraparietal sulcus; ITG, inferior temporal gyrus; ITS, inferior temporal sulcus; MTG, middle temporal gyrus; OFC, orbitofrontal cortex; p., pars; PPC, posterior parietal cortex; pre-SMA, pre-supplementary motor area; s., sulcus; SPL, superior parietal lobule.
trials compared with standard trials. Consistent with this interpretation, this CRN amplitude difference vanished when novel and standard trials were matched with respect to flanker compatibility (t(18) ⫽ 0.03, p ⬎ 0.9). The ERP following novel trials was characterized by a large, frontocentrally distributed (peaking at electrode Cz), radial negativity (or N2) that peaked ⬃300 ms following the visual action effect and differed significantly between trial types (F(2,36) ⫽
Wessel et al. • Common Neural Architecture for Novelty and Errors
J. Neurosci., May 30, 2012 • 32(22):7528 –7537 • 7533
t(18) ⫽ 3.9, p ⬍ 0.001; standard trials based on ERN-ICs: t(18) ⫽ 4.45, p ⬍ 0.001), meaning that the processes that explained the ERN also explained a significant part of the novelty N2. To quantify the extent of overlap, we computed two ratios: the first was the ratio of N2 amplitude for ERN ICs to N2 amplitude for all ICs; the second was the ratio of the N2 difference between novel and standard trials for ERN ICs to the N2 difference between novel and standard trials for all ICs. The average value of the first ratio was 0.46; the average of the second was 0.49. Importantly, neither the novel trials, nor any data in the N2 time range (200 – 400 ms following the response/visual action effect) were used to select error-related ICs. As expected from ratio estimates, the remaining components that did not conFigure 5. Brain areas that showed a significantly enlarged BOLD response on both error and novel trials compared with tribute to ERN activity still yielded a sigstandard trials as revealed by a conjunction analysis (see Table 3). nificant N2 amplitude compared with standard trials (standard trials based on all 44.146, p ⬍ 0.001). The amplitude of the N2 was enlarged for ICs: t(18) ⫽ 3.87, p ⫽ 0.001; standard trials based on all non-ERN novel trials compared with standard trials (t(18) ⫽ 6.3, p ⬍ 0.001), ICs: t(18) ⫽ 3.35, p ⬍ 0.01). Importantly though, their topographand also differed between errors on the one hand and standard ical distribution was characterized by bilateral positive occipital and novel trials on the other, although these latter effects were voltage activity whose underlying dipoles were in visual cortex due to the concurrent Pe that followed errors (see Fig. 2). Figure but projected to the frontocentral electrode sites (Fig. 4b), and 2 shows the waveforms at electrode Cz for all three conditions thereby contributed to N2 amplitude. Note that there was a visiand their associated voltage patterns. ble baseline shift in the waveform of this activity (Fig. 4a), which was due to the fact that this error-preceding activity was almost Experiment 1: EEG-IC-based analysis completely accounted for by the ICs underlying the ERN. Still, Figure 3 shows the activity in standard and error trials at electrode even when quantifying the “residual” N2 amplitude for non-ERN Cz for the ICs selected to represent the ERN. For comparison, the components after computing a second, response-locked baseline original data are also shown (ERPs based on all ICs). It is evident correction for the non-ERN components and the standard trials that almost all of the activity in the ERN time range was ac(⫺100 ms to response onset, respectively), N2 amplitude was still counted for by the selected ICs. In fact, the ERN-CRN difference significantly larger on novel trials than on standard trials (graphs in the ERN-ICs was virtually identical to that in the original data not shown, t(18) ⫽ 3.13, p ⬍ 0.01). (the average voltage difference in the ERN time range between the Experiment 2: Behavior ERN based on all ICs and the ERN based on the selected ICs Subjects exhibited average error rates of 11.6% (SD, 6.2%; minacross subjects was 0.47 V, with an SE of 0.23 V). As in the analysis of ERPs based on all ICs, analysis of ERPs imum, 4.2%; maximum, 23.45%), which amounts to absolute of ERN-ICs (at electrode Cz, but qualitatively identical at elecnumbers of between 18 and 93 errors. On average, subjects made trode FCz) revealed an effect of condition on ERN/CRN am48.26 errors per 424 trials. The subjects effectively attended the plitude (F(2,36) ⫽ 14.450, p ⬍ 0.001), with greater amplitude visual action effect, indicated by an average target detection rate for errors compared with standard (t(18) ⫽ 4.27, p ⬍ 0.001) of 99% (all but one subject signaled all targets; one subject sigand novel trials (t(18) ⫽ 4.25, p ⬍ 0.001). Standard and novel naled only three of them). The experimentally controlled matchtrials did not differ with respect to CRN amplitude ( p ⬎ 0.2). ing of novel and error frequency was effective as reflected by a Also, it is notable that the frontocentral radial activity was Pearson correlation between error and novel numbers of r ⫽ separated from the non-ERN activity at occipital electrodes 0.99, p ⬍ 0.0001 (average number of novel trials of 44.8 (mini(Fig. 2 vs Fig. 3, see voltage topographies). mum, 19; maximum, 79). Also, error and novel trials were Furthermore, the dipole solution of these data for the ERN matched with respect to potential response-conflict related to time range suggested the pMFC (MNI dipole coordinates: x ⫽ 0, flanker incompatibility: mean percentage of incompatible trials y ⫽ 17, z ⫽ 53) was the cortical source of the ERN, a finding on error and novel trials was 67.43 and 69%, respectively. Imporconsistent with previous studies (e.g., Debener et al., 2005). tantly, the percentage of incompatible trials on error and novel To test whether the source network underlying the ERN also trials correlated highly across subjects: r ⫽ 0.98, p ⬍ 0.0001. explained variance of the ERPs to novel trials, we reconstructed Mean reaction times were different between conditions (stanthe activity of the selected ERN ICs on novel trials. As shown in dards, 689 ms; novels, 699 ms; errors, 753 ms; F(2,36) ⫽ 7.497, p ⫽ 0.01), with errors associated with reaction times that were Figure 4, the ICs that accounted for the ERN also accounted for a unexpectedly longer than those for correct trials. As in Experilarge portion of the novelty N2. The amplitude of the N2 wave in ment 1, correct trials following errors were significantly slower the ERN ICs differed significantly between trial types (F(2,36) ⫽ 24.6, p ⬍ 0.001) and it was significantly enlarged for novel trials than correct trials following correct trials, indicating significant compared with standard trials (standard trials based on all ICs: posterror slowing (712 ms for posterror trials vs 684 ms for post-
Wessel et al. • Common Neural Architecture for Novelty and Errors
7534 • J. Neurosci., May 30, 2012 • 32(22):7528 –7537
correct trials, t(18) ⫽ 3.32, p ⬍ 0.01, one-sided). Also, correct trials following novels were significantly slower than correct trials following correct trials, indicating significant postnovel slowing (709 ms for postnovel trials vs 684 ms for postcorrect trials, t(18) ⫽ 2.00, p ⬍ 0.05, one-sided). To address the possibility that measures of PES and PNS were confounded by stimulus compatibility, we ran these analyses again on a subset of correct trial sequences matched to error-correct and novel-correct sequences with respect to flanker compatibility on preceding and current trials. Both posterror and postnovel slowing remained significant (t(18) ⫽ 2.2, p ⬍ 0.05 for PES, t(18) ⫽ 1.77, p ⬍ 0.05, both one-sided). Experiment 2: fMRI Contrasts of errors versus standard trials (Table 1) and of novel trials versus standard trials (Table 2) revealed expected patterns of activity. Errors were associated with robust bilateral activity in the pMFC (aMCC and presupplementary motor area, pre-SMA), inferior frontal cortex including inferior frontal junction (IFJ), and the anterior insula (see Table 1 for a complete list of activations). Novel trials were associated with robust bilateral activity in the aMCC; pre-SMA; inferior frontal cortex, including IFJ; and anterior insula, as well as medial temporal lobe structures (hippocampus, parahippocampal and amygdalohippocampal areas), visual cortex, and superior parietal cortex (see Table 2 for a complete list of activations). No region showed greater activity on standard trials relative to either novels or errors. To test for brain regions that were significantly activated both by errors and novel events, we calculated the conjunction of the above two contrasts. The resulting map is shown in Figure 5. Both errors and novel events were associated with bilateral activity in the aMCC, pre-SMA, lateral prefrontal cortex (PFC) and subcortical nuclei, as well as the temporoparietal junction (TPJ) and the superior temporal sulcus (see Table 3 for a full list of regions). To test for brain regions that were either more active for errors compared with novel events or more active for novel events compared with errors, we performed second-level contrasts of error versus standard trials and novel versus standard trials. Results are displayed in Figure 6, with regions more active for errors shown in warm colors, and regions more active for novel trials shown in cool colors. Regions that were more active for errors than novel trials included the aMCC, pre-SMA, and anterior insula; regions that were more active for novel trials than errors included orbitofrontal cortex, medial temporal lobe structures (hippocampus, parahippocampal cortex, amygdalae), and visual cortex (see Table 4 for a full list of regions).
Discussion Evidence from two experiments suggests important overlap in the neural circuitry underlying the processing of errors and novel events. Cortical activity associated with frequency-matched errors and novel events was measured by EEG in Experiment 1 and fMRI in Experiment 2. Blind source separation techniques applied to EEG data isolated signal components that explained an error-related negativity observed 0 –100 ms following erroneous responses. These same signal components also explained a substantial portion of a novelty-N2b potential observed 200 – 400 ms following novel events. Cortical source localization procedures suggested these components originated in the pMFC. Conjunction analysis of fMRI data provided converging evidence that errors and novel events were associated with activity in aMCC (also referred to as rostral cingulate zone; Picard and Strick, 1996, Ridderinkhof et al., 2004), and a broad constellation of cortical
Table 3. Anatomical regions and MNI coordinates of global and local statistical maxima for the conjunction analysis of error and novelty processing Hemisphere x
y
Pre-SMA/dmPFC (BA 8) aMCC/dmPFC (BA 8) Pre-SMA aMCC/pre-SMA IFG p. triangularis IFJ IFG p. opercularis/anterior insula IFG p. orbitalis Precentral s./PMd Anterior insula Anterior inferior insula a IFG p. opercularis IFG p. triangularis IFG p. opercularis/anterior insula Anterior insula Anterior inferior insula a IFG p. orbitalis IFJ Precentral s. IPS IPS/PPC STS a STS/TPJ a STS/MTG a STS/angular g./TPJ a STS/STG/TPJ a Lateral geniculate/hippocampus a Thalamus (VLa/p)/STN a Pulvinar a Thalamus (MD)a Superior colliculus a Habenula a Caudate n.a Thalamus (Va/VLa, anterior n.)a Thalamus (Va/VLa)a Thalamus (VLp)/STN a Thalamus (MD/LD)a
R/L R/L R/L R/L R R R R R R R L L L L L L L L R L R R R R R R L L R R/L L/R L R L R L
34 47 2578 31 42 12 53 22 45 26 19 8421 9 34 27 ⫺8 29 ⫺2 8 48 28 2 11 ⫺16 21 0 3733 24 18 27 ⫺5 19 ⫺2 10 ⫺13 20 6 8 37 2222 13 32 ⫺57 50 1606 ⫺52 47 1534 ⫺30 ⫺6 6017 ⫺48 17 ⫺44 0 ⫺43 37 ⫺42 19 ⫺25 ⫺8 7918 ⫺13 ⫺2 ⫺28 ⫺3 ⫺14 8 ⫺29 ⫺4 ⫺27 1 6 5 ⫺2 9 ⫺7 6 ⫺8 ⫺1 ⫺20 12
4 ⫺6 ⫺4 ⫺2 50 49 36 53 54 30 36 ⫺48 ⫺42 ⫺29 ⫺35 ⫺38 ⫺58 ⫺46 ⫺54 38 ⫺33 52 56 67 48 67 23 ⫺6 ⫺14 6 8 ⫺2 ⫺11 13 ⫺6 6 ⫺12
z
Volume (mm 3) z-score
Anatomical region
3.84 3.81 3.77 3.45 4.87 4.41 4.33 4.29 4.15 3.62 3.31 4.09 3.86 3.73 3.52 3.15 3.36 4.36 3.74 4.44 4.13 3.84 3.64 3.38 3.11 3.05 3.66 3.65 3.5 3.5 3.46 3.3 3.18 2.97 2.84 2.83 2.67
No volume given for local submaxima within a larger activation. Results obtained at a threshold of z ⫽ 3.09 and p ⬍ 0.01, corrected, unless marked otherwise. aMCC, anterior midcingulate cortex; BA, Brodmann area; dmPFC, dorsomedial prefrontal cortex; g., gyrus; IFG, inferior frontal gyrus; IFJ, inferior frontal junction; IPS, intraparietal sulcus; L, left; LD, laterodorsal (nucleus); MD, mediodorsal (nucleus); MTG, middle temporal gyrus; n., nucleus; p., pars; PMd, dorsal premotor cortex; PPC, posterior parietal cortex; pre-SMA, pre-supplementary motor area; R, right; STG, superior temporal gyrus; STN, subthalamic nucleus; STS, superior temporal sulcus; Va, ventral anterior (nucleus); VLa/p, ventrolateral anterior/ventrolateral posterior (nucleus); VLp, ventral lateral nucleus. a z ⫽ 2.3, p ⬍ 0.01, corrected.
and subcortical regions including the pre-SMA, dorsal and ventrolateral PFC, anterior insula, intraparietal sulcus, dorsomedial thalamus, and the habenula. Our findings are consistent with earlier behavioral and neurophysiological studies of error-related and noveltyrelated processing. It is well known that errors and novel events both elicit negative deflections in scalp-measured voltages at frontocentral electrode sites (Na¨a¨ta¨nen and Gaillard, 1983; Falkenstein et al., 1991; Gehring et al., 1993), and lead to comparable behavioral adjustments in the form of posterror (Rabbitt, 1966) and postsurprise (Barcelo et al., 2006; Iwanaga and Nittono, 2010) slowing, respectively. What makes the present findings important though is that they suggest that similarities in the neural and behavioral response to errors and novel events are not merely coincidental, but reflect a fundamental commonality in the way errors and novel events are processed. As such, the findings have important implications
Wessel et al. • Common Neural Architecture for Novelty and Errors
J. Neurosci., May 30, 2012 • 32(22):7528 –7537 • 7535
for recent models of error-related and novelty-related processing and aMCC function. According to Notebaert et al. (2009), for example, processing and adjustments that follow errors are part of an orienting response that occurs because of the relative infrequency of errors [although recent behavioral work shows that postnovel slowing is more contingent on the unexpectedness or perceptual change associated with the stimulus than its base rate (cf. Parmentier et al., 2011; Vachon et al., 2011)]. This account implies that there should be considerable overlap in processing of errors and infrequent/unexpected events (both of which apply to novel events in our experiments). Our findings support this account by showing that source signals that originated in the aMCC and explained error-related cortical Figure 6. Brain areas that show a significantly enlarged BOLD response on error trials versus novel trials (warm colors) or novel activity also explained a significant proportrials versus error trials (cold colors), as revealed by a second-level contrast of errors versus standards and novel versus standards tion of novelty-related cortical activity. (see Table 4). Our findings also have implications for models of aMCC function. Activity in this Table 4. Anatomical regions and MNI coordinates of global and local statistical brain region is frequently reported in models of error processing maxima for the contrasts between error and novelty trials and has been found to be the neuronal generator of the ERN Volume (Dehaene et al., 1994; Holroyd et al., 1998; Ullsperger and von 3 Anatomical region Hemisphere x y z (mm ) z-score Cramon, 2001; Gehring and Willoughby, 2002; Van Veen and Carter, 2002; Miltner et al., 2003; Debener et al., 2005). One Error ⬎ novel aMCC R/L 4 25 30 8779 4.12 hypothesis is that when suboptimal consequences follow from Pre-SMA R 11 3 59 3.29 particular actions, as in the case of errors, the aMCC signals the 3 22 51 2.96 need for an adjustment in task performance (Ridderinkhof et al., aMCC L ⫺9 7 43 2.66 2004), be it through an alteration of stimulus processing Anterior insula R 42 13 1 6510 4.25 (Danielmeier et al., 2011), or the slowing of responses on the next Anterior insula/IFG p. opercularis R 36 21 ⫺17 3.69 trial (King et al., 2010; Danielmeier and Ullsperger, 2011). The Novel ⬎ error current findings suggest that this response to errors is in many Collateral s./parahippocampal g. R 31 ⫺47 ⫺12 39,010 6.26 ways convergent with the aMCC response to novel events. As Occipital gyri R 39 ⫺88 6 6.04 such, our findings are broadly consistent with recent computaOccipitotemporal/fusiform g. R 49 ⫺56 ⫺10 5.35 tional models that suggest the aMCC signifies the degree of misAmygdala/AHA R 22 ⫺6 ⫺20 4.58 IPS posterior part R 33 ⫺76 45 4.28 match between the learned likelihood of several action outcomes Hippocampus R 38 ⫺19 ⫺19 3.99 and the actual outcome, regardless of valence (Alexander and Posterior MTG/ITS R 52 ⫺64 21 3.88 Brown, 2011), as well as evidence that neurons in the homoloPutamen R 23 1 8 3.59 gous region of the macaque anterior cingulate cortex code unOccipitotemporal/fusiform g. L ⫺40 ⫺56 ⫺8 21,688 5.54 signed reward prediction error or “surprise” (Matsumoto et al., Occipital gyri L ⫺37 ⫺92 1 5.20 2007; Hayden et al., 2011). Our findings also extend earlier eviITS/occipital gyri L ⫺51 ⫺73 ⫺2 4.55 dence implicating the error-monitoring system in the processing Collateral s./parahippocampal g./ L ⫺25 ⫺37 ⫺13 4.25 of externally induced “errors” or false feedback on otherwise corhippocampus rect motor responses (de Bruijn et al., 2004; Ullsperger et al., Posterior MTG L ⫺45 ⫺72 37 3.70 2007; Gentsch et al., 2009). They also complement early metaLateral OFC/IFG p. orbitalis L ⫺37 37 ⫺18 19,046 5.00 analyses (Duncan and Owen, 2000; Ridderinkhof et al., 2004) Lateral OFC R 28 33 ⫺16 4.81 vmPFC/medial OFC R/L 4 34 ⫺20 4.53 supporting the idea that prefrontal control areas are recruited by IFG p. orbitalis/p. triangularis L ⫺47 33 3 4.49 many different situations that demand cognitive control. Many vmPFC R/L 1 54 ⫺15 3.74 earlier theories have focused on the mechanisms driving the ERN Medial OFC L ⫺15 31 ⫺13 3.43 in particular (e.g., Botvinick et al., 2001; Coles et al., 2001; SFG/SFS L ⫺19 36 50 8956 5.04 Holroyd and Coles, 2002), but the current results suggest that dmPFC (BA 9), medial frontopolar L ⫺9 68 19 while a narrow focus on one of these event-related potentials is cortex helpful in understanding the processing of the respective event in SFS/MFG L ⫺34 22 55 question, a broader and more general approach is in order for a dmPFC (BA 9) R/L ⫺7 55 41 unified theory of aMCC function. Specifically, while the reinNo volume given for local submaxima within a larger activation. Results obtained at a threshold of z ⫽ 2.3 and p ⬍ forcement learning theory of the ERN (Holroyd and Coles, 2002) 0.01, corrected. AHA, amygdalohippocampal area; aMCC, anterior midcingulate cortex; BA, Brodmann area; dmPFC, dorsomedial prefrontal cortex; g., gyrus; IFG, inferior frontal gyrus; IPS, intraparietal sulcus; ITS, inferior temporal may account for many findings pertaining to response and feedsulcus; MFG, middle frontal gyrus; MTG, middle temporal gyrus; OFC, orbitofrontal cortex; p., pars; pre-SMA, preback ERN, it may not suffice as a fully integrative model of aMCC supplementary motor area; s., sulcus; SFG, superior frontal gyrus; SFS, superior frontal sulcus; vmPFC, ventromedial prefrontal cortex. function. Rather, it seems that the aMCC responds to any expec-
Wessel et al. • Common Neural Architecture for Novelty and Errors
7536 • J. Neurosci., May 30, 2012 • 32(22):7528 –7537
tancy violation in course and outcome of actions, independent of its relation to reward, and evaluates whether adjustments are necessary. The current findings are also important in showing that, beyond the pMFC, error and novelty-related processing was associated with activity in a broad constellation of cortical and subcortical regions, including anterior insula, the inferior frontal junction, and inferior frontal gyrus. It is conceivable that these regions have individuated functions related to salience processing, awareness, attention control, and the initiation of motor caution, all of which might be expected to occur in response to an error or a novel event. Interestingly, errors and novel events were also associated with activity in habenula (Ullsperger and Von Cramon, 2003; Bromberg-Martin and Hikosaka, 2011), and the ventrolateral anterior, ventral anterior, and mediodorsal nuclei of the thalamus (Peterburs et al., 2011; Seifert et al., 2011). Activity in these regions is often observed but rarely discussed in studies of error processing. It is interesting that the convergence of the neural response to errors and novel events extends at least to subcortical brain areas. The ERN is supposed to be the main electrophysiological “output signal” of this performancemonitoring network. Indeed, it has been shown that lesion damage to many of the regions found in our conjunction analysis severely attenuate or fully diminish the ERN (Ullsperger et al., 2002; Stemmer et al., 2004; Seifert et al., 2011), and the same is true for the white-matter tracts connecting these areas (Hogan et al., 2006). Similar effects could be predicted for the novelty-N2. In addition to the mediofrontal neuronal circuits involved in both error and novelty processing, there was another cluster of activity in the event-related EEG that contributed to the frontocentral novelty-N2. Judging from the voltage topography, this activity likely did not originate in the medial prefrontal cortex, but rather the bilateral occipital cortices. This was confirmed by an exploratory analysis of the independent components underlying this part of the N2 (data not shown), which was performed in the same fashion as the IC selection procedure for the ERN ICs in Experiment 1. The dipole solutions for these ICs primarily clustered along occipital cortex. Interestingly, the bilateral occipital cortices also showed a largely increased BOLD response on novel trials in the fMRI experiment (Table 2). Together, it appears that the brain response to novelty consisted of activity in (1) prefrontal regions particularly encompassing (but not limited to) the pMFC, which signaled a violation of an expectation; (2) hippocampus known to respond specifically to novel events (Knight and Nakada, 1998; Yamaguchi et al., 2004); (3) occipital cortex, potentially owing to the higher complexity of the stimulus material delivered on novel trials; (4) orbitofrontal cortex and amygdala putatively involved in valuation of the meaningful novel stimuli; and (5) the temporoparietal junction. The latter activation might stem from the fact that this area is putatively engaged in the generation of the (novelty-)P300 potential of the EEG (Dien et al., 2003), which was also explained partially by the ERN source activity that explained part of the N2 in the current study (data not shown; see Fig. 4). While it is outside the focus of this paper to speculate on the function of the TPJ or the P300, it is important to note that the source activity that explained the ERN and also much of the Pe following erroneous trials also explained both the N2 and the subsequent P300 following novels. This suggests that the parallels in processing between both trial types extend beyond the early stages into even later processes (see Overbeek et al., 2005, for a speculation on Pe/P300 equivalency). Finally, we found areas that were more active in response to errors compared with novels and vice versa, which may reflect the
specific nature of the “surprise” component of the respective event. Novel events were associated with stronger activity in primary and secondary visual cortices, whereas errors elicited greater activity in the pMFC structures (aMCC and presupplementary motor area), potentially because the source of surprise was more directly related to the motor system. Interpretation has to be made with caution, since these findings obviously do not imply that the respective areas are unrelated to the particular other process, but only that they were more active in one condition compared with the other. Nevertheless, this pattern corresponds well with the nature of the surprise elicited by errors on the one hand and novel events on the other. Together, the current study provides the first empirical evidence for an overlap in neuronal circuits involved in processing error and novel events in humans. These findings implicate a role for a subcortical-frontomedial network in processing unexpected or surprising action effects, independent of valence.
References Alexander WH, Brown JW (2011) Medial prefrontal cortex as an actionoutcome predictor. Nat Neurosci 14:1338 –1344. Barcelo F, Escera C, Corral MJ, Peria´n˜ez JA (2006) Task switching and novelty processing activate a common neural network for cognitive control. J Cogn Neurosci 18:1734 –1748. Bates E, D’Amico S, Jacobsen T, Sze´kely A, Andonova E, Devescovi A, Herron D, Lu CC, Pechmann T, Ple´h C, Wicha N, Federmeier K, Gerdjikova I, Gutierrez G, Hung D, Hsu J, Iyer G, Kohnert K, Mehotcheva T, OrozcoFigueroa A et al. (2003) Timed picture naming in seven languages. Psychon Bull Rev 10:344 –380. Bell AJ, Sejnowski TJ (1995) An information-maximization approach to blind separation and blind deconvolution. Neural Comput 7:1129 –1159. Botvinick MM, Braver TS, Barch DM, Carter CS, Cohen JD (2001) Conflict monitoring and cognitive control. Psychol Rev 108:624 – 652. Bromberg-Martin ES, Hikosaka O (2011) Lateral habenula neurons signal errors in the prediction of reward information. Nat Neurosci 14:1209 – 1216. Coles MG, Scheffers MK, Holroyd CB (2001) Why is there an ERN/Ne on correct trials? Response representations, stimulus-related components, and the theory of error-processing. Biol Psychol 56:173–189. Courchesne E, Hillyard SA, Galambos R (1975) Stimulus novelty, task relevance and the visual evoked potential in man. Electroencephalogr Clin Neurophysiol 39:131–143. Danielmeier C, Ullsperger M (2011) Post-error adjustments. Front Psychol 2:233. Danielmeier C, Wessel JR, Steinhauser M, Ullsperger M (2009) Modulation of the error-related negativity by response conflict. Psychophysiology 46:1288 –1298. Danielmeier C, Eichele T, Forstmann BU, Tittgemeyer M, Ullsperger M (2011) Posterior medial frontal cortex activity predicts posterror adaptations in task-related visual and motor areas. J Neurosci 31:1780 –1789. Debener S, Ullsperger M, Siegel M, Fiehler K, von Cramon DY, Engel AK (2005) Trial-by-trial coupling of concurrent electroencephalogram and functional magnetic resonance imaging identifies the dynamics of performance monitoring. J Neurosci 25:11730 –11737. de Bruijn ERA, Mars RB, Hulstijn W (2004) It wasn’t me, or was it? How false feedback affects performance. In: Errors, conflicts, and the brain. Current opinions on performance monitoring (Ullsperger M, Falkenstain M, eds.), pp. 118 –124. Leipzig, Germany: Max-Planck Institute for Human Cognitive and Brain Sciences. Dehaene S, Posner MI, Tucker DM (1994) Localization of a neural system for error-detection and compensation. Psychol Sci 5:303–305. Delorme A, Makeig S (2004) EEGLAB: an open source toolbox for analysis of single-trial EEG dynamics including independent component analysis. J Neurosci Methods 134:9 –21. Delorme A, Sejnowski T, Makeig S (2007) Enhanced detection of artifacts in EEG data using higher-order statistics and independent component analysis. Neuroimage 34:1443–1449. Dien J, Spencer KM, Donchin E (2003) Localization of the event-related potential novelty response as defined by principal components analysis. Brain Res Cogn Brain Res 17:637– 650.
Wessel et al. • Common Neural Architecture for Novelty and Errors Duncan J, Owen AM (2000) Common regions of the human frontal lobe recruited by diverse cognitive demands. Trends Neurosci 23:475– 483. Eriksen BA, Eriksen CW (1974) Effects of noise letters upon identification of a target letter in a nonsearch task. Percept Psychophys 16:143–149. Falkenstein M, Hohnsbein J, Hoormann J, Blanke L (1991) Effects of crossmodal divided attention on late ERP components. II. Error processing in choice reaction tasks. Electroencephalogr Clin Neurophysiol 78:447– 455. Falkenstein M, Hoormann J, Christ S, Hohnsbein J (2000) ERP components on reaction errors and their functional significance: a tutorial. Biol Psychol 51:87–107. Folstein JR, Van Petten C (2008) Influence of cognitive control and mismatch on the N2 component of the ERP: a review. Psychophysiology 45:152–170. Gehring WJ, Willoughby AR (2002) The medial frontal cortex and the rapid processing of monetary gains and losses. Science 295:2279 –2282. Gehring WJ, Goss B, Coles MGH, Meyer DE, Donchin E (1993) A neural system for error-detection and compensation. Psychol Sci 4:385–390. Gentsch A, Ullsperger P, Ullsperger M (2009) Dissociable medial frontal negativities from a common monitoring system for self- and externally caused failure of goal achievement. Neuroimage 47:2023–2030. Hayden BY, Heilbronner SR, Pearson JM, Platt ML (2011) Surprise signals in anterior cingulate cortex: neuronal encoding of unsigned reward prediction errors driving adjustment in behavior. J Neurosci 31:4178 – 4187. Hogan AM, Vargha-Khadem F, Saunders DE, Kirkham FJ, Baldeweg T (2006) Impact of frontal white matter lesions on performance monitoring: ERP evidence for cortical disconnection. Brain 129:2177–2188. Holroyd CB, Coles MG (2002) The neural basis of human error processing: reinforcement learning, dopamine, and the error-related negativity. Psychol Rev 109:679 –709. Holroyd CB, Dien J, Coles MG (1998) Error-related scalp potentials elicited by hand and foot movements: evidence for an output-independent errorprocessing system in humans. Neurosci Lett 242:65– 68. Iwanaga M, Nittono H (2010) Unexpected action effects elicit deviancerelated brain potentials and cause behavioral delay. Psychophysiology 47:281–288. Jenkinson M, Smith S (2001) A global optimisation method for robust affine registration of brain images. Med Image Anal 5:143–156. Jenkinson M, Bannister P, Brady M, Smith S (2002) Improved optimization for the robust and accurate linear registration and motion correction of brain images. Neuroimage 17:825– 841. Jutten C, Herault J (1991) Blind separation of sources. 1. An adaptive algorithm based on neuromimetic architecture. Signal Process 24:1–10. King JA, Korb FM, von Cramon DY, Ullsperger M (2010) Post-error behavioral adjustments are facilitated by activation and suppression of taskrelevant and task-irrelevant information processing. J Neurosci 30:12759 –12769. Knight RT, Nakada T (1998) Cortico-limbic circuits and novelty: a review of EEG and blood flow data. Rev Neurosci 9:57–70. Makeig S, Bell AJ, Jung TP, Sejnowski TJ (1996) Independent component analysis of electroencephalographic data. Adv Neural Inf Process Sys 8:145–151. Matsumoto M, Matsumoto K, Abe H, Tanaka K (2007) Medial prefrontal cell activity signaling prediction errors of action values. Nat Neurosci 10:647– 656. Miltner WH, Lemke U, Weiss T, Holroyd C, Scheffers MK, Coles MG (2003) Implementation of error-processing in the human anterior cingulate cortex: a source analysis of the magnetic equivalent of the error-related negativity. Biol Psychol 64:157–166. Na¨a¨ta¨nen R, Gaillard AW (1983) The orienting reflex and the N2 deflection of the event-related potential (ERP). In: Tutorials of ERP research: endogenous components (Gaillard AW, Ritter W, eds), pp 119 –141. Amsterdam: Elsevier. Nichols T, Brett M, Andersson J, Wager T, Poline JB (2005) Valid conjunction inference with the minimum statistic. Neuroimage 25:653– 660. Notebaert W, Houtman F, Opstal FV, Gevers W, Fias W, Verguts T (2009) Post-error slowing: an orienting account. Cognition 111:275–279. Onton J, Westerfield M, Townsend J, Makeig S (2006) Imaging human EEG dynamics using independent component analysis. Neurosci Biobehav Rev 30:808 – 822. Overbeek TJM, Nieuwenhuis S, Ridderinkhof KR (2005) Dissociable com-
J. Neurosci., May 30, 2012 • 32(22):7528 –7537 • 7537 ponents of error processing: on the functional significance of the Pe visa´-vis the ERN/Ne. J Psychophysiol 19:319 –329. Parmentier FB, Elsley JV, Andre´s P, Barcelo´ F (2011) Why are auditory novels distracting? Contrasting the roles of novelty, violation of expectation and stimulus change. Cognition 119:374 –380. Peterburs J, Pergola G, Koch B, Schwarz M, Hoffmann KP, Daum I, Bellebaum C (2011) Altered error processing following vascular thalamic damage: evidence from an antisaccade task. PLoS One 6:e21517. Picard N, Strick PL (1996) Motor areas of the medial wall: a review of their location and functional activation. Cereb Cortex 6:342–353. Polich J (2007) Updating P300: an integrative theory of P3a and P3b. Clinical Neurophysiology 118:2128 –2148. Rabbitt PM (1966) Errors and error correction in choice-response tasks. J Exp Psychol 71:264 –272. Ridderinkhof KR, Ullsperger M, Crone EA, Nieuwenhuis S (2004) The role of the medial frontal cortex in cognitive control. Science 306:443– 447. Roger C, Be´nar CG, Vidal F, Hasbroucq T, Burle B (2010) Rostral cingulate zone and correct response monitoring: ICA and source localization evidences for the unicity of correct- and error-negativities. Neuroimage 51:391– 403. Seifert S, von Cramon DY, Imperati D, Tittgemeyer M, Ullsperger M (2011) Thalamocingulate interactions in performance monitoring. J Neurosci 31:3375–3383. Smith SM (2002) Fast robust automated brain extraction. Human Brain Mapp 17:143–155. Smith SM, Jenkinson M, Woolrich MW, Beckmann CF, Behrens TE, Johansen-Berg H, Bannister PR, De Luca M, Drobnjak I, Flitney DE, Niazy RK, Saunders J, Vickers J, Zhang Y, De Stefano N, Brady JM, Matthews PM (2004) Advances in functional and structural MR image analysis and implementation as FSL. Neuroimage 23:S208 –S219. Squires NK, Squires KC, Hillyard SA (1975) Two varieties of long-latency positive waves evoked by unpredictable auditory stimuli in man. Electroencephalogr Clin Neurophysiol 38:387– 401. Stemmer B, Segalowitz SJ, Witzke W, Scho¨nle PW (2004) Error detection in patients with lesions to the medial prefrontal cortex: an ERP study. Neuropsychologia 42:118 –130. Szekely A, Jacobsen T, D’Amico S, Devescovi A, Andonova E, Herron D, Lu CC, Pechmann T, Ple´h C, Wicha N (2004) A new on-line resource for psycholinguistic studies. J Memory Language 51:247–250. Ullsperger M, von Cramon DY (2001) Subprocesses of performance monitoring: a dissociation of error processing and response competition revealed by event-related fMRI and ERPs. Neuroimage 14:1387–1401. Ullsperger M, von Cramon DY (2003) Error monitoring using external feedback: specific roles of the habenular complex, the reward system, and the cingulate motor area revealed by functional magnetic resonance imaging. J Neurosci 23:4308 – 4314. Ullsperger M, von Cramon DY, Mu¨ller NG (2002) Interactions of focal cortical lesions with error processing: Evidence from event-related brain potentials. Neuropsychology 16:548 –561. Ullsperger M, Nittono H, von Cramon DY (2007) When goals are missed: dealing with self-generated and externally induced failure. Neuroimage 35:1356 –1364. Vachon F, Hughes RW, Jones DM (2011) Broken expectations: violation of expectancies, not novelty, captures auditory attention. Van Veen V, Carter CS (2002) The timing of action-monitoring processes in the anterior cingulate cortex. J Cogn Neurosci 14:593– 602. van Veen V, Holroyd CB, Cohen JD, Stenger VA, Carter CS (2004) Errors without conflict: implications for performance monitoring theories of anterior cingulate cortex. Brain Cogn 56:267–276. Viola FC, Thorne J, Edmonds B, Schneider T, Eichele T, Debener S (2009) Semi-automatic identification of independent components representing EEG artifact. Clin Neurophysiol 120:868 – 877. Wessel JR, Ullsperger M (2011) Selection of independent components representing event-related brain potentials: a data-driven approach for greater objectivity. Neuroimage 54:2105–2115. Woolrich MW, Ripley BD, Brady M, Smith SM (2001) Temporal autocorrelation in univariate linear modeling of FMRI data. Neuroimage 14:1370 –1386. Yamaguchi S, Hale LA, D’Esposito M, Knight RT (2004) Rapid prefrontalhippocampal habituation to novel events. J Neurosci 24:5356 –5363.