Alcohol and error processing
1
Running Head: ALCOHOL AND ERROR PROCESSING
Alcohol Effects on Performance Monitoring and Adjustment: Affect Modulation and Impairment of Evaluative Cognitive Control
Bruce D. Bartholow, Erika A. Henry, Sarah A. Lust, J. Scott Saults, & Philip K. Wood University of Missouri
To appear in Journal of Abnormal Psychology (© American Psychological Association)
http://www.apa.org/pubs/journals/index.aspx This article may not exactly replicate the final version published in the APA journal. It is not the copy of record.
Authors‟ Note Bruce D. Bartholow, Erika A. Henry, Sarah A. Lust, J. Scott Saults, and Philip K. Wood, Department of Psychological Sciences, University of Missouri. This research was supported by a grant from the University of Missouri Research Board and by grants R21-AA017282 and T32-AA013526 from the National Institute on Alcohol Abuse and Alcoholism. Address correspondence to Bruce D. Bartholow, Department of Psychological Sciences, 210 McAlester Hall, University of Missouri, Columbia, MO 65211. Email:
[email protected]
Alcohol and error processing
2
Abstract Alcohol is known to impair self-regulatory control of behavior, though mechanisms for this effect remain unclear. Here, we tested the hypothesis that alcohol‟s reduction of negative affect (NA) is a key mechanism for such impairment. This hypothesis was tested by measuring the amplitude of the error-related negativity (ERN), a component of the event-related brain potential (ERP) posited to reflect the extent to which behavioral control failures are experienced as distressing, while participants completed a laboratory task requiring self-regulatory control. Alcohol reduced both the ERN and error positivity (Pe) components of the ERP following errors and impaired typical post-error behavioral adjustment. Structural equation modeling indicated that effects of alcohol on both the ERN and post-error adjustment were significantly mediated by reductions in NA. Effects of alcohol on Pe amplitude were unrelated to post-error adjustment, however. These findings indicate a role for affect modulation in understanding alcohol‟s effects on self-regulatory impairment, and more generally support theories linking the ERN with a distress-related response to control failures.
Key words: Alcohol, cognitive control, negative affect, self-regulation, event-related potentials
Alcohol and error processing
3
The ability to monitor ongoing interactions with the environment, and make adjustments when necessary, is an adaptive, critical function of the human information-processing system (see Holroyd & Coles, 2002). This performance monitoring ability underlies virtually all selfregulatory processes (see Botvinick, Braver, Barch, Carter, & Cohen, 2001), from maintaining one‟s diet to responding appropriately in social situations. Thus, understanding factors that influence performance monitoring and adjustment can provide insight into the control of behavior across a broad range of domains. Alcohol ingestion has long been known to impair motor performance and dysregulate social behaviors, often leading to increased aggression (see Giancola, 2000), risk-taking (e.g., Leigh & Morrison, 1991; Wiers et al., 2007) and accidents (e.g., National Highway Traffic Safety Administration, 2009), among other problems. Numerous theories (Giancola, 2000; Steele & Josephs, 1990) and empirical observations (Bartholow, Dickter, & Sestir, 2006; Casbon, Curtin, Lang, & Patrick, 2003; Curtin & Fairchild, 2003; Fillmore & Vogel-Sprott, 1999; Fillmore, VogelSprott, & Gavrilescu, 1999) have linked alcohol‟s deleterious effects to impairments in selfregulatory control. Still, important questions remain concerning the specific mechanisms for these effects, owing largely to the fact that “cognitive control” is not a single or simple construct (see Miyake et al., 2000). The purpose of the current research was to begin to identify these mechanisms by testing specific, hypothesized pathways by which alcohol might interfere with basic aspects of performance monitoring and adjustment. Recent advances in cognitive neuroscience have been influential in refining hypotheses concerning effects of alcohol on sub-components of information processing, and how impairment of those sub-components might influence behavioral outcomes. In particular, Botvinick et al. (2001) proposed a model positing two complimentary components of cognitive
Alcohol and error processing
4
control that together facilitate self-regulation. The first, evaluative component monitors ongoing performance for instances of conflict between opposing response possibilities. Evidence from event-related potential (ERP) and functional brain imaging studies has associated this evaluative, conflict-monitoring process with activity in the anterior cingulate cortex (ACC; see Carter et al., 1998; Yeung, Botvinick, & Cohen, 2004). When response conflict is detected by the evaluative component, a second, regulative component is alerted that increased control is needed to implement an intended response; brain imaging data have localized this regulative control process in the dorsolateral prefrontal cortex (e.g., Kerns et al., 2004). Previous efforts at investigating alcohol‟s effects on cognitive control have focused primarily on the regulative component. For example, Curtin and Fairchild (2003) found that alcohol impairs Stroop-task performance, and used ERPs to demonstrate that this impairment is evident in reduced implementation of regulative control. Bartholow et al. (2006) similarly showed that alcohol increases expression of race bias in a racial priming task by impairing regulative control. In theory, it is possible that effects of alcohol on regulative control observed in these previous studies stem, at least in part, from a failure of the evaluative control system to signal the regulative system that increased control is needed. Evidence supporting this perspective was provided by Ridderinkhof et al. (2002), who showed that alcohol ingestion significantly reduced the amplitude of the error-related negativity (ERN), a scalp-recorded manifestation of the ACC‟s response to errors (see Holroyd & Coles, 2002; Yeung et al., 2004), and eliminated the adjustment of performance that typically follows error commission (e.g., Kerns et al., 2004; Li et al., 2008; Rabbitt, 1966). Based on these findings, and influenced by theory linking the ERN with error detection (see Coles, Scheffers, & Holroyd, 2001; Falkenstein, Hoorman, Christ, & Hohnsbein, 2000; Gehring, Goss, Coles, Meyer, & Donchin, 1993) and work indicating that typical post-error adjustment does not occur when
Alcohol and error processing
5
errors go unnoticed (Nieuwenhuis, Ridderinkhof, Blom, Band, & Kok, 2001), Ridderinkhof et al. concluded, “alcohol consumption… compromises performance by attenuating the brain‟s capacity to detect action slips” [i.e., errors] (p. 2210). Despite the intuitive appeal of this conclusion, Ridderinkhof et al. (2002) failed to consider a number of factors that could provide alternative explanations for their findings, and, thus, could suggest alternative mechanisms for alcohol‟s effects on self-regulatory control. For example, Yeung and colleagues (Holroyd & Yeung, 2003; Yeung & Cohen, 2006; Yeung, Ralph, & Nieuwenhuis, 2007) have hypothesized that alcohol might impair visual processing, thereby making it difficult for drinkers to identify a given target and therefore to know whether they have responded correctly to it. Consistent with this idea, Yeung et al. (e.g., 2007) have shown that, like alcohol, visual degradation of target stimuli reduces the amplitude of the ERN and leads to impaired post-error adjustment. However, to date the primary tenets of this theory have never been tested directly. That is, although both alcohol and degraded stimuli can impair error processing and subsequent behavioral adjustment, Yeung et al. have never actually demonstrated that alcohol degrades visual processing, or that this presumed alcohol effect is responsible for the drug‟s impairment of behavioral adjustment. A second potential problem with the conclusions of Ridderinkhof et al. (2002) rests with their interpretation of the ERN. In recent years the error-detection theory of the ERN has been challenged by the observation of ERN-like brain activity on certain types of correct-response trials (e.g., Bartholow et al., 2005; Vidal, Hasbroucq, Grapperon, & Bonnet, 2000), and by alternative theories positing that the ERN reflects, for example, conflict monitoring (Yeung et al., 2004) or an affective response to errors (see Bush, Luu, & Posner, 2000; Gehring & Willoughby, 2002; Hajcak & Foti, 2008).
Alcohol and error processing
6
An alternative possibility ignored by both Ridderinkhof et al. (2002) and Yeung and colleagues (e.g., Holroyd & Yeung, 2003; Yeung et al., 2007) is that alcohol limits error processing and post-error behavioral via its blunting of negative affect. Alcohol consumption has long been associated with anxiolysis (see Sayette, 1999), and experimental tests of the “stress-response dampening hypothesis” (Levenson, Sher, Grossman, Newman, & Newlin, 1980) generally support the efficacy of alcohol to limit both subjective (e.g., Sher & Walitzer, 1986; Sher, Bartholow, Peuser, Eriksen, & Wood, 2007; Sher, Bylund, Walitzer, Hartman, & Ray-Prenger, 1994; Steele & Josephs, 1988) and physiological correlates (e.g., Curtin, Lang, Patrick, & Strizke, 1998; Curtin, Patrick, Lang, Cacioppo, & Bierbaumer, 2001; Sayette, Smith, Breiner, & Wilson, 1992; Sher et al., 2007; 1994) of negative affect and/or stress, at least under some conditions (see Greely & Oei, 1999; Sayette, 1993). The affect-modulatory effects of alcohol are important to consider in this context given that the neural generator of the ERN – the ACC – has long been known to play a key role in the evaluation of distress (e.g., Ballantine, Cassidy, Flanagan, & Marino, 1962; Corkin & Hebben, 1981; Rainville, Duncan, Price, Carrier, & Bushnell, 1997; Talbot et al., 1991). In particular, Rainville et al. showed that the ACC is sensitive to the perceived unpleasantness of noxious stimuli, and importantly distinguished the somatosensory experience of pain (i.e., whether a stimulus is painful) from the evaluation of whether pain is distressing, associating the ACC only with the latter process (see also Peyron et al., 2000). This property of ACC activation is consistent with data showing that error commission is aversive (Hajcak & Foti, 2008) and that ERN amplitude covaries with the motivational significance of errors (Gehring et al., 1993; Gehring & Taylor, 2004; Hajcak, Moser, Yeung, & Simons, 2005). Moreover, a prominent theory (Holroyd & Coles, 2002) posits that the ERN reflects ACC activity covarying with phasic decreases in dopamine in the mesencephalic dopamine system that accompany evaluations of
Alcohol and error processing
7
behavioral outcomes as “worse than expected” (p. 680). Alcohol is known to increase dopamine levels in many parts of this system (Fromme & D‟Amico, 1999), a fact often linked to alcohol‟s anxiolytic effects (Koob et al., 1998). Taken together, these data and theory suggest that alcohol might reduce the amplitude of the ERN by reducing the extent to which errors are evaluated as distressing. If so, then alcohol‟s impairment of self-regulatory behavioral adjustment might stem from diminished concern over self-regulatory failures (i.e., errors). In short, intoxicated individuals might experience errors as less distressing, which in theory would limit the extent to which the evaluative control function of the ACC signals other parts of the performance monitoring system that increased control is needed. In addition to the ERN, a later-occurring positive component (the error positivity; Pe) also has been associated with error processing and performance monitoring, and therefore could be informative concerning alcohol‟s effects on this process. The Pe typically follows the ERN on error trials and appears to be more error-specific than the ERN (see Bartholow et al., 2005; Vidal et al., 2000). Recent data and theory suggest that Pe amplitude could represent the extent to which errors are consciously detected (Hester, Foxe, Molholm, Shpaner, & Garavan, 2005; Nieuwenhuis et al., 2001). Thus, examining this component, perhaps more than the ERN, provides an opportunity to test the hypothesis that alcohol limits error awareness, and importantly whether potential reduction in error awareness contributes to alcohol‟s impairment of self-regulatory behavioral adjustment. The purpose of this research was to assess the extent to which alcohol‟s acute effects on self-regulation are associated with impairment of the evaluative component of cognitive control (Botvinick et al., 2001), and to test the role of specific mechanisms of that impairment. In particular, we sought to test whether alcohol-related reduction of the ERN reflects impaired error awareness (Ridderinkhof et al., 2002) and/or is associated with alcohol‟s posited
Alcohol and error processing
8
modulation of negative affect (see Greely & Oei, 1999). In addition, we tested whether alcohol also reduces the Pe, and whether reductions in the amplitude of either of these error-processing signals are associated with impaired behavioral adjustment. Participants consumed one of three beverages (alcohol, placebo or control) prior to completing a cognitive control task while ERPs were recorded. Following their task-related behavioral response on each trial, participants made accuracy judgments of their responses (akin to error awareness judgments used in previous research; Hester et al., 2005; Nieuwenhuis et al., 2001; Payne, Shimizu, & Jacoby, 2005). We hypothesized that alcohol would reduce ERN amplitude (Ridderinkhof et al., 2002) but would not impair response accuracy judgments. Our decision to test both control and placebo beverage groups was informed by studies indicating that placebo consumption often produces unique effects on cognitive and affective responses (see Testa et al., 2006). In particular, it has been theorized that placebo participants often attempt to compensate for anticipated cognitive impairment by increasing vigilance (e.g., Fillmore & Blackburn, 2002). If so, it is possible that placebo participants might experience errors as particularly distressing, leading to larger ERNs compared to the control group. We also hypothesized that alcohol would reduce negative affect, and that this effect would be associated both with alcohol‟s effects on ERN amplitude and with differences in post-error adjustment. It was not clear whether alcohol would also reduce Pe amplitude, or if it does, whether this effect would be associated with post-error behavioral adjustment. Finally, we predicted that performance following alcohol ingestion would reflect increased reliance on prepotent response tendencies (e.g., Bartholow et al., 2006; Casbon & Curtin, 2003; Fillmore et al., 1999), and that this effect would be due to impairment of control-related processes and not to increased reliance on automatic processes. Method
Alcohol and error processing
9
Participants Sixty-seven healthy adults (34 women), all white/non-Hispanic and between the ages of 21 and 35 years (M = 25.6 years), were recruited from the Columbia, MO community using mass email announcements and advertisements in local periodicals. Eligibility was determined using a structured telephone interview. Individuals who indicated any condition that would contraindicate alcohol administration (pregnancy; abstention; symptoms of alcohol or drug dependence; history of serious mental or physical illness; prescription medication other than oral contraception), or who reported history of head trauma or neurological disorder were excluded from the sample, as were individuals who reported drinking less than an average of 2 or more than an average of 25 drinks per week in the past 3 months. Eligible participants were scheduled for individual lab appointments and instructed to abstain from alcohol and drugs for 24 hours prior and to eat a light meal 4-6 hours prior to their appointment. All lab sessions began between 12:00pm and 4:00pm. Affidavits completed upon participants‟ arrival at the lab were used to ensure compliance with pre-session protocols and maintenance of study eligibility since the interview. Participants were compensated $12 per hour for their time. Beverage Administration Participants were randomly assigned to consume either a no-alcohol control beverage (n = 22 [11 women]), an active placebo beverage (n = 22 [11 women]), or an alcohol beverage (target BrAC = .10%; n = 23 [11 women]). Participants in the control condition were informed that their beverage contained no alcohol; those in the other two conditions were told that their beverage contained “a moderate amount of alcohol.” In the alcohol and placebo conditions, an experimenter ostensibly prepared a beverage containing a moderate dose of alcohol mixed in a 5:1, tonic to vodka ratio. The placebo dose was achieved with diluted vodka (9 parts flattened tonic to 1 part 100-proof vodka, poured from a Smirnoff Blue Label bottle) and tonic; the
Alcohol and error processing
10
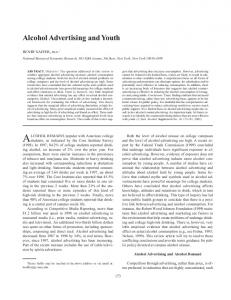
alcohol dose was achieved using 100-proof vodka and tonic, calculated based on total body water volume (estimated using age, gender, height, and weight) and the duration of the drinking period (15 min), using published formulas (see Curtin & Fairchild, 2003; Watson, 1989). Total beverage was isovolemic across conditions. In each condition, the beverage was divided into three equal-size drinks and participants were given 5 min to consume each one. After drinking, participants sat idle for 15 min, which in the alcohol condition allowed the alcohol to begin absorption into the blood. Measures Positive and negative affect. State levels of positive and negative affect were assessed at baseline and several post-drinking periods using the Positive and Negative Affect Scales (PANAS; Watson, Clark, & Tellegen, 1988). The PANAS is a 20-item, self-report measure on which respondents indicate (using scales anchored at 1 [very slightly or not at all] and 5 [extremely]) the extent to which they currently feel 10 positive states (PA; e.g., interested, excited) and 10 negative states (NA; e.g., distressed, nervous). Internal consistency was good for both the PA (α = .90) and NA (α = .81) subscales. Cognitive control task. Participants completed 384 experimental trials of the Weapons Identification Task (WIT; Payne, 2001) (see Figure 1). On each trial of the WIT, a 1sec visual pattern mask precedes a briefly-presented (200 ms) picture of a white or black man‟s face, followed immediately by presentation (200 ms) of either a gun or tool (i.e., target), which is then hidden by a second visual mask. Trials were divided into 6 blocks of 64 trials each (16 each of black-tool, black-gun, white-tool, and white-gun). Participants‟ task was to categorize each target as a gun or a tool as quickly as possible by pressing one of two buttons (counterbalanced across participants). Responses made following a 500 ms response deadline elicited a “Too Slow!” message to encourage participants to respond faster. Similar to previous research
Alcohol and error processing
11
testing error awareness and the ERN and Pe components (Hester et al., 2005; Nieuwenhuis et al., 2001; Scheffers & Coles, 2000), the WIT was modified here such that participants rated their perception of the accuracy of their response on each trial (immediately following their response) using 1 of 3 response keys, labeled “sure correct,” “don‟t know,” and “sure incorrect,” respectively (see Payne et al., 2005). Following the accuracy judgment response, a randomlyvarying inter-trial interval (1,000, 1,250 or 1,500 ms) elapsed prior to the onset of the next trial. The WIT shares many key features with other tasks often used to assess performance monitoring and adjustment processes, including a structure involving some trials that rely upon prepotent, well-learned response tendencies (i.e., congruent trials) and others that require participants to overcome prepotent response tendencies (i.e., incongruent trials). Due to prevalent racial stereotypes associating young black men with violence (e.g., Correll, Park, Judd, & Wittenbrink, 2002; Sagar & Schofield, 1980) the black face primes produce a bias toward activating the „gun‟ response (see Payne 2001, 2005). In other words, black-gun trials are congruent because racial stereotypes and the goal-relevant „gun‟ response both elicit the same response tendency. In contrast, on black-tool trials racial stereotypes favor the „gun‟ response, whereas the correct, goal-relevant response is the „tool‟ response, leading to conflict; therefore, these trials are incongruent. These features have led other researchers to conclude that performance in the WIT relies upon the same cognitive control and performance‐monitoring processes used to regulate performance in other cognitive control tasks (see Amodio et al., 2004, 2008; Payne, 2005). Use of the WIT has three additional advantages for testing the current hypotheses. First, unlike most tasks used to investigate cognitive control (e.g., standard Stroop tasks), the stimuli in the WIT have motivational relevance for participants, and therefore errors carry motivational significance (see Amodio et al., 2008). Second, inter-racial interactions (even
Alcohol and error processing
12
virtual ones) are known to produce anxiety (see Plant, 2004; Stephan & Stephan, 1985), which has been shown to influence performance on the WIT (Amodio, 2009). Thus, this task is wellsuited to testing the implications of alcohol‟s anxiety-reducing properties for self-regulatory cognitive control. Third, categorization errors in the WIT have been shown to elicit robust and reliable ERNs that predict increased response control (e.g., Amodio et al., 2004, 2008), indicating that the evaluative control system is strongly engaged during task performance. Subjective intoxication. During each of several post-drinking assessments, participants in the alcohol and placebo conditions rated their feelings of intoxication by responding to the item, “How drunk do you feel right now?”, using a scale ranging from 0 (not
drunk at all) to 10 (more drunk than I have ever been). At the study‟s end, these participants also estimated the number of standard drink equivalents they believed they had consumed using an open-ended response item. Electrophysiological recording. The electroencephalogram (EEG) was recorded from 64 tin electrodes fixed in a stretch-lycra cap (ElectroCap, Eaton, OH) placed on the scalp in standard locations (American Encephalographic Society, 1994) and referenced to the right mastoid; an average mastoid reference was derived offline. Impedance was kept below 8 k at all locations. EEG signals were amplified with Synamps2 amplifiers (Compumedics-Neuroscan, Charlotte, NC), sampled at 1000 Hz and filtered on-line at 0.05 to 40 Hz. Ocular artifacts were removed from the EEG signal off-line using a regression-based procedure (Semlitsch, Anderer, Schuster, & Presslich, 1986), after which a bandpass filter of 1 to 15 Hz was applied before response-locked epochs of -400 to 600 ms were derived. After artifact removal and rejection, EEG data were averaged according to participant, electrode, and stimulus conditions. The ERN and Pe components were quantified as the average amplitudes occurring 0-150 ms postresponse, and 150-250 ms post-response, respectively, at all scalp electrodes.
Alcohol and error processing
13
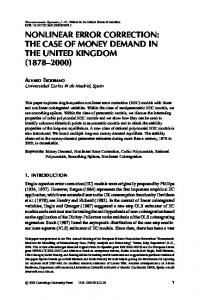
Procedure Figure 2 depicts the timing of key events occurring during lab sessions. Upon arrival at the lab, participants read and signed an informed consent form, completed a number of questionnaire measures not relevant to this report, and were randomly assigned to one of the three beverage conditions. Women self-administered a urine-stream pregnancy test (all were negative). Participants then were escorted to a sound-proof recording chamber where baseline breath alcohol concentration (BrAC) and PANAS measures were taken, after which experimenters placed and tested recording electrodes. Next, participants completed a short block of practice trials (24 trials, 6 of each type) to ensure their familiarity with the WIT. An experimenter (unaware of the true contents of the beverage in the alcohol and placebo conditions) then mixed (in view of participants) and served the beverage. Following beverage consumption and the absorption period, a second BrAC and PANAS were administered. Participants then completed the WIT, stopping for a short break (around 30 sec) between blocks. A longer break was given half-way through the task (after block 3), during which a third BrAC and PANAS were given. Following the remaining WIT trials (and another BrAC and PANAS measure), participants completed a few post-experimental questionnaire items, after which electrodes were removed and participants were shown to a private restroom to clean the electrode gel from their face and hair. Participants were then debriefed, after which control and placebo participants were dismissed. Alcohol group participants were retained in the lab until a breathalyzer test indicated that they were sober (BrAC ≤ .02%). Results Analytic Approach To reduce the influence of a few outlying data points (< 1% of trials) and to eliminate fast “guessing” responses, analysis of reaction times (RTs) was limited to correct responses
Alcohol and error processing
14
made between 100 ms and 1200 ms following target onset. Correct responses made after the 500 ms response deadline (but prior to 1200 ms) were retained for analyses of RTs, and all responses made between 100 and 1200 ms were coded for categorization accuracy and included in analyses of accuracy rates. Preliminary analyses indicated that participants‟ sex was unrelated to any of the effects of interest, and therefore was not included in the main analyses. ERP analyses were limited to a core set of 15 electrodes representing 5 midline scalp locations from frontal to parietal areas (Fz, FCz, Cz, CPz, and Pz), 5 lateral locations left of midline (F3, FC3, C3, CP3, and P3) and their right-hemisphere homologues. Greenhouse-Geisser-adjusted
p-values are given for all effects involving repeated measures with more than 2 levels. Manipulation Checks Intoxication. Baseline BrAC was 0.0 in all participants, and remained that way throughout the experiment for placebo participants (after the baseline assessment BrAC was not measured in control group participants). For alcohol participants, BrAC increased from pretask (M = .087) to mid-task (M = .092) to post-task (M = .094), F(2, 44) = 3.44, p < .05, indicating that on average the entire task was completed as participants approached peak BrAC. Post-experiment estimates of the number of standard drinks consumed higher in the alcohol group (M = 3.52) than the placebo group (M = 2.41), F(1, 41) = 8.30, p < .01. That placebo participants believed that they had consumed nearly two-and-a-half standard drinks supports the effectiveness of our placebo manipulation. Alcohol group participants reported feeling more intoxicated throughout the study (M = 3.62) than placebo participants (M = 2.26), F(1, 43) = 14.23, p < .01. However, the pattern of responses across assessments (increasing from pretask to mid-task and decreasing thereafter; F(2, 86) = 11.62, p < .01) did not vary by beverage group (Beverage x Time interaction: F < 1).
Alcohol and error processing
15
Self-reported affect. Affect change scores were calculated by subtracting baseline reports of NA and PA from second reports, measured 15 minutes after completion of beverages (alcohol group BrAC = .087). Using this change score approach controls for individual differences in pre-existing (baseline) levels of PA and NA, which are not relevant for testing current hypotheses, and focuses analyses on effects associated with the beverage group manipulation. Mean levels of PA and NA at baseline and post-drinking are reported in Table 1. Affect change scores were subjected to a 3 (Beverage) x 2 (Scale; NA, PA) mixed factorial ANOVA, which showed a significant Beverage x Scale interaction, F(2, 64) = 13.63, p < .001. This interaction was probed using separate one-way ANOVAs for NA and PA. The ANOVA on NA change scores showed a significant Beverage effect, F(2, 64) = 5.20, p < .01. Dependent ttests showed that alcohol group participants reported feeling less negative affect post‐drinking compared to baseline (M = ‐1.52), t(22) = ‐2.82, p = .01, whereas placebo participants reported feeling somewhat (though not significantly) more negative affect post‐drinking (M = 0.95), t(21) = 1.70, p = .10. NA did not change reliably from baseline in the control group (M = ‐0.22), t(21) = ‐0.43, p > .50. Additional paired t-tests showed that the means in the alcohol and placebo groups differed significantly from each other, t(43) = 3.22, p < .01, but neither differed significantly from the control group, ts < 1.69, ps > .09. These findings generally support the notion that alcohol dampens negative affect (e.g., Greely & Oei, 1999), and provide a basis for testing the hypothesis that effects of alcohol on error processing are related to changes in NA. The ANOVA on PA change scores also showed a significant Beverage effect, F(2, 64) = 9.17, p < .01. Dependent t-tests showed that alcohol group participants reported somewhat more positive affect post‐drinking compared to baseline (M = 2.30), t(22) = 1.77, p < .09, whereas participants in the control (M = -2.60) and placebo groups (M = -3.68) reported
Alcohol and error processing
16
feeling less positive affect post-drinking relative to baseline, ts(21) = -2.94 and -3.98, respectively, ps < .01. Additional paired t-tests showed that the alcohol group mean differed significantly from both the control and placebo group means, ts(43) > 3.25, ps < .01, which did not differ from each other (t < 1). Target Categorization Performance RTs. RT data were submitted to a 2 (Prime; black, white) x 2 (Target; gun, tool) x 3 (Beverage; alcohol, placebo, control) mixed-factorial ANOVA with repeated measures on the first two factors. Previous research has shown that participants are faster to categorize guns and slower to categorize tools on black-prime compared to white-prime trials (e.g., Amodio et al., 2004; Payne, 2001, 2005), revealing a stereotype-congruency effect. This Prime x Target interaction effect was replicated here, F(1, 64) = 20.2, p < .001, and was not moderated by beverage group, F(2, 64) = 1.63, p = .20 (see Figure 3A). Thus, as in previous work using a flanker task (Ridderinkhof et al., 2002) alcohol did not modulate typical reaction-time congruency effects. Reaction times overall also did not differ as a function of beverage group (F < 1). Accuracy. Accuracy rates were analyzed using a similar 2 (Prime) x 2 (Target) x 3 (Beverage) mixed factorial ANOVA.2 A significant Beverage effect, F(2, 64) = 13.81, p < .001, indicated that alcohol group participants were less accurate (M = .80) than participants in the control (M = .88), t(43) = -3.27, p < .01, and placebo groups (M = .91), t(43) = -4.58, p < .001, whose accuracy rates did not differ reliably, t(42) = 1.30, p = .20. A significant Prime x Target interaction, F(1, 64) = 28.34, p < .001, indicated that participants generally were more accurate at identifying guns and less accurate at identifying tools on black-prime compared to white-prime trials (see also Amodio et al., 2004, 2008; Payne, 2001, 2005). This effect was qualified by a significant Prime x Target x Beverage interaction, F(2, 64) = 3.30, p < .05.
Alcohol and error processing
17
Follow-up 2 (Prime) x 2 (Target) ANOVAs within each beverage group showed significant Prime x Target interactions in each group (ps < .05). However, inspection of the means associated with this effect (see Figure 3B) shows that participants in the alcohol group showed a particularly robust bias effect (more accurate for guns than tools on black-prime trials; d = 1.57) relative to those in the other groups (ds = 0.96 and 0.72 for control and placebo, respectively). Additionally, the difference in accuracy between black-tool and white-tool trials was larger in the alcohol group (M = -.08) than in the control (M = -.01) and placebo groups (M = -.03). Influence of automatic and controlled processes on performance. To determine the extent to which the increased race bias seen in the alcohol group reflects differences in the influence of automatic or controlled processes, we calculated estimates of these processes using the process dissociation procedure (PDP) approach first outlined by Jacoby (e.g., 1991), and applied to WIT performance by Payne (2001, 2005). As explained by Payne (2005), the PDP approach assumes that any given behavior is determined by both automatic and controlled processes. The relative influence of these processes can be estimated in tasks in which some trials allow these processes to act in concert while others place these processes in opposition. On black-gun trials in the WIT, both automatic stereotyping and the goal-driven “gun” response call for the same behavior (i.e., congruent trials). In contrast, on black-tool trials automatic stereotyping calls for the “gun” response, which opposes the goaldirected “tool” response (i.e., incongruent trials). The critical set of equations for deriving PDP estimates of controlled (C) and automatic (A) processing components are: C = P(correct|congruent trials) – P(stereotypic error|incongruent trials) A = P(stereotypic error|incongruent trials)/(1 – C)
Alcohol and error processing
18
That is, for each participant, C is computed as the proportion of congruent trials on which they responded correctly minus the proportion of incongruent trials on which they committed a stereotype-related error (e.g., responding with the “gun” key on black-tool trials), and A is that same proportion of incongruent error trials divided by the inverse of C. (The full set of PDP equations can be found in Payne, 2005.) These PDP estimates were submitted to a 3 (Beverage) x 2 (Process; automatic, controlled) mixed factorial ANOVA. This analysis showed a main effect of Process, F(2, 64) = 7.30, p < .01, which was qualified by a significant Beverage x Process interaction, F(2, 64) = 3.46, p < .05. Follow-up simple effect tests showed that whereas the automatic estimate was unaffected by beverage (Ms = 0.55, 0.58, and 0.57 for the alcohol, control and placebo groups, respectively), ts < 1, the controlled estimate was significantly reduced in the alcohol group ( M = 0.59) compared to both the control group (M = 0.75), t(43) = 4.08, p < .001, and the placebo group (M = .80), t(42) = 4.96, p < .001, which did not differ reliably, t(22) = 1.21, p > .20. These findings suggest that alcohol increases expression of race bias by limiting the extent to which control can be brought to bear once automatic stereotypes are activated (see also Bartholow et al., 2006). Beverage Effects on Error Processing Recent work shows that both ERN and Pe amplitudes stabilize after around 6 error trials (Hajcak & Simons, 2008; Olvet & Hajcak, 2009). Thus, only participants who committed at least 6 errors were included in the ERN and Pe analyses (3 placebo participants and 1 alcohol participant were excluded). Figure 4 displays response-locked ERP waveforms for error trials (upper panel) and correct trials (lower panel) as a function of beverage group. ERN amplitude. A preliminary 5 (Coronal location) x 3 (Lateral location) ANOVA revealed a Coronal x Lateral interaction, F(8, 480) = 35.9, p < .0001, indicating that the ERN
Alcohol and error processing
19
was larger at midline than lateral locations, and was particularly pronounced at the midline fronto-central electrode (FCz). Thus, the primary analysis was focused on data from FCz, using a 2 (Prime) x 2 (Target) x 3 (Beverage group) mixed ANOVA. This analysis showed a main effect of Beverage group, F(2, 60) = 14.2, p < .001; planned contrasts indicated that the ERN was significantly smaller in the alcohol group (M = -4.72 V) than in the control (M = -7.51 V),
t(42) = 2.31, p < .05, and placebo groups (M = -11.40 V), t(39) = 5.32, p < .001. The ERN also was larger in the placebo group than in the control group, t(39) = 3.10, p < .001. No other effects of interest were significant in this analysis. 3 Pe amplitude. A preliminary 5 (Coronal location) x 3 (Lateral location) ANOVA revealed a Coronal x Lateral interaction, F(8, 480) = 13.13, p < .0001, indicating that the Pe was largest at midline electrodes, particularly the midline central site (Cz). Thus, data measured at Cz were submitted to a 2 (Prime) x 2 (Target) x 3 (Beverage group) mixed ANOVA. This analysis showed a significant effect of Beverage group, F(2, 60) = 4.14, p < .05. Planned contrasts indicated that the Pe was smaller in the alcohol group (M = 5.07 V) than in the control group (M = 8.53 V), t(42) = -2.75, p < .05, and the placebo group (M = 7.77 V),
t(39) = -2.07, p < .05, whose means did not differ reliably (t < 1). No other effects of interest were significant in this analysis. Post-error behavioral adjustment. In order to test the hypothesis that alcohol impairs post-error behavioral adjustment (Ridderinkhof et al., 2002), we calculated behavioral interference effects (RT on incongruent trials [e.g., black-tool] minus RT on congruent trials [e.g., black-gun]) and compared their magnitude on trials that followed correct responses to trials that followed errors using a 3 (Beverage group) x 2 (Trial type: post-error, post-correct) mixed factorial ANOVA. A significant Beverage group x Trial type interaction, F(2, 64) = 3.16, p < .05 (see Figure 5), showed that RT interference effects were smaller on trials following errors
Alcohol and error processing
20
compared to trials following correct responses for participants in the placebo group, t(21) = 2.38, p = .02, consistent with previous findings (Ridderinkhof et al., 2002) and with the general notion of post-error adjustment (e.g., Rabbitt, 1966). Control group participants showed a pattern similar to those in the placebo group, but the means did not differ reliably ( t < 1). No such differences were apparent for participants in the alcohol group, however, t(22) = -1.33, p = .25. Additional contrasts showed that, whereas post-correct interference effects were unaffected by beverage group (F < 1), post-error interference effects were larger in the alcohol group (M = 26.3 ms) than in the placebo group, (M = 12.3 ms), t(43) = 2.39, p = .02, indicating that post-error adjustments were larger in the placebo group. ERN and response control. Previous research has shown that individuals who exhibit larger ERNs on error trials tend to display better response control, as reflected in PDP control estimates (e.g., Amodio et al., 2004, 2008). Such an association is consistent with the view that the ERN reflects an evaluative signal to other cortical structures that more regulative control is needed (Botvinick et al., 2001, 2004; Kerns et al., 2004). Given that alcohol diminishes this evaluative control signal, the typical association between the ERN and response control also is likely to be disrupted. To test this idea, we computed correlations between ERN amplitudes and PDP control estimates, separately by beverage group (see Figure 6). For participants who did not consume alcohol (i.e., placebo and control groups), the typical association was observed – larger ERNs were associated with increased PDP control ( rs ≥ -.47,
ps < .05). This association was absent in the alcohol group, however (r = -.09, p > .30). A multiple regression model in which PDP control scores were regressed on beverage group (coded 0=alcohol, 1=no alcohol), ERN amplitude (mean centered) and their interaction showed a marginal interaction effect, β = -.36, p = .07, indicating that the associations differed as a function of alcohol.
Alcohol and error processing
21
Overt response accuracy judgments. To test the hypothesis that alcohol impairs error detection (Ridderinkhof et al., 2002), we calculated the proportion of both correctresponse and error trials on which participants correctly judged the accuracy of their responses, and tested whether these proportions differed across beverage groups using one-way ANOVAs. Accuracy judgment data from two participants (1 alcohol, 1 placebo) were not recorded due to software problems, leaving the sample size for these analyses at 65. For ease of interpretation, only trials for which participants made “sure correct” and “sure incorrect” judgments were included. Inspection of the means in Figure 7 (right-hand side) suggests that participants in the alcohol group were no less aware of their errors than participants in the other groups. Indeed, a significant effect of Beverage, F(2, 62) = 3.51, p < .05, indicated that participants in the alcohol group were more accurate (M = .87) than control group participants (M = .72), t(43) = 2.65, p < .05, and just as accurate as placebo group participants (M = .81), t(43) = 1.34, p = .19, at detecting when they had responded incorrectly. An additional analysis on judgments made about correct-response trials (left-hand side of Figure 7) showed that participants in all beverage groups were equally able to recognize their correct responses, F(2, 62) = 1.82, p = .17. Another possibility suggested by the error detection hypothesis is that alcohol participants might be more likely than those in the other groups to mistakenly judge some of their incorrect responses as correct. However, participants in all beverage groups were equally unlikely to make this mistake (F < 1). Accounting for Alcohol Effects on Error Processing and Performance Adjustment The primary aim of this research was to test potential mechanisms of the effects of alcohol on neurophysiological manifestations of error processing and impairment in selfregulatory control that previously have been observed (e.g., Ridderinkhof et al., 2002) or theorized (e.g., Holroyd & Yeung, 2003; Yeung & Cohen, 2006; Yeung et al., 2007).
Alcohol and error processing
22
Addressing this aim requires examination of the relations among the variables to test for potential mediation of outcomes (e.g., ERN amplitude, post-error adjustment) by theorized mechanisms (e.g., error recognition, affect changes). To do so, we constructed a structural equation model and tested the significance of indirect effects related to hypothesized mechanisms. As discussed by Kenny (2009), using a structural equation model to test for potential mediation is advantageous because it permits tests of multiple mediators simultaneously, which can show whether a given indirect or mediated effect is independent of other indirect or mediated effects on the outcome of interest (see also MacKinnon, Fairchild, & Fritz, 2007). The full model (constructed using Mplus version 5.21; Muthen & Muthen, 2007) is presented in Figure 8. The beverage group variable was dummy coded using the placebo group as the comparison for the alcohol and control groups. Thus, effects presented in the model for Alcohol and Control represent effects of those beverages relative to the placebo beverage. This approach highlights both pharmacological effects (alcohol vs. placebo) as well as any expectancy-related effects (control vs. placebo). Two primary meditational hypotheses were investigated. First, the error-detection view of the ERN (Coles et al., 2001) suggests that alcohol‟s reduction of ERN amplitude, and subsequent impairment of post-error adjustment, reflect impaired awareness of errors (Ridderinkhof et al., 2002). Although the response accuracy judgment findings presented previously have suggested that error awareness was intact in the alcohol group, it remains possible that variability in this outcome could play a role in alcohol‟s effects on post-error adjustment. In addition, the Pe component, associated in previous work with error awareness (Hester et al., 2005; Nieuwenhuis et al., 2001), also was reduced by alcohol, suggesting some support for the impaired error detection hypothesis. However, inspection of the path coefficients in Figure 8 shows that neither overt error
Alcohol and error processing
23
recognition nor the purported neurophysiological signal of error awareness is a plausible mediator of alcohol‟s effects on post-error adjustment. Specifically, although alcohol reduced Pe amplitude, the Pe was not associated with post-error adjustment. Also, the nonsignificant path from overt error recognition to post-error adjustment, coupled with the fact that alcohol did not reduce error recognition, means that impaired recognition of errors was not responsible for significant variance in the effects of alcohol on post-error adjustment. Thus, the errordetection hypothesis was not supported by these data. The second meditational hypothesis was that alcohol‟s effects on the ERN are at least partially derived from reduction of negative affect. In support of this hypothesis, Figure 8 shows that the indirect effect of alcohol on the ERN via NA change was significant (standardized estimate = .21, p < .01). The model also showed two other significant indirect effects. First, the effect of alcohol on post-error adjustment via the ERN was significant (standardized estimate = .21, p = .01), indicating that the reduction of evaluative control reflected in the ERN accounts for significant variability in alcohol‟s impairment of post-error adjustment. Second, the model shows that significant additional variability in post-error adjustment is accounted for by inclusion of the NA change variable in the model, as indicated by the compound path from alcohol to NA change, from NA change to the ERN, and from the ERN to post-error adjustment (standardized estimate = 0.10, p = .02). No other process variables in the model provided significant explanatory power. However, it should be noted that the indirect effect linking the control beverage variable with post-error adjustment via the ERN approached significance, standardized estimate = 0.10, p = .06, suggesting that the observed difference in the ERN between the control and placebo groups also had implications for post-error adjustment. Discussion
Alcohol and error processing
24
Previous research has demonstrated that alcohol impairs both the evaluative (Ridderinkhof et al., 2002) and regulative (Bartholow et al., 2006; Casbon et al., 2003; Curtin & Fairchild, 2003) components of cognitive control (see Botvinick et al., 2001), but has not directly addressed how alcohol affects these processes. The purpose of this research was to begin to address this question, focusing on the evaluative component of control that previous research and theory have identified as critical for performance monitoring and adjustment (Botvinick et al., 2001, 2004; Carter et al., 1998; Yeung et al., 2004). By including multiple measures of error-related processing assessed at multiple levels, and by simultaneously testing multiple potential mediators of alcohol‟s effects on a commonly-used laboratory index of selfregulatory control, this study provided a more comprehensive assessment of potential mechanisms of alcohol‟s self-regulatory impairment than has been provided in previous studies (e.g., Bartholow et al., 2006; Casbon et al., 2003; Curtin & Fairchild, 2003; Ridderinkhof et al., 2002). In particular, this study was designed to test two primary hypothesized mechanisms for alcohol‟s effects on evaluative cognitive control and behavioral adjustment, the first being that alcohol limits error detection. This hypothesis was tested by including a self-report measure of overt error recognition and by measuring the Pe component of the ERP, theorized to reflect awareness of errors (Hester et al., 2005; Nieuwenhuis et al., 2001). The current data provided some limited evidence that alcohol might limit error awareness. Specifically, although the behavioral error recognition data indicated that alcohol did not limit awareness of incorrect responses, alcohol did reduce the amplitude of the Pe. These findings suggest that alcohol might limit awareness of errors at an immediate, automatic level, but that subsequent processes leading to overt recognition, perhaps associated with further reflection on the response outcome, are not impaired by alcohol. In any case, however, there was no evidence
Alcohol and error processing
25
here that either Pe amplitude or overt error recognition were related to post-error behavioral adjustment. Thus, even if alcohol can be said to limit error awareness to some extent, this process appears not to be responsible for alcohol‟s self-regulatory impairment. The second hypothesis tested here was that alcohol‟s effects on performance monitoring and adjustment are related to alcohol-induced decreases in NA. This hypothesis was based on three converging lines of evidence: (1) that alcohol consumption can reduce negative affect and distress (see Greely & Oei, 1999; Sayette, 1993); (2) that the ERN covaries with the motivational significance of errors (Gehring et al., 1993; Gehring & Taylor, 2004; Hajcak et al., 2005) and has been associated with an aversive response to errors (Bush et al., 2000; Hajcak & Foti, 2008); and (3) that the ACC, the neural source of the ERN, plays a role in the evaluation of pain and distress (e.g., Rainville et al., 1997). These factors suggested that alcohol might limit the extent to which errors are perceived or experienced as distressing. The current data largely supported this idea. Unlike participants in the other groups, those who consumed alcohol experienced a significant decrease in NA post-drinking (relative to baseline). Importantly, given that at relatively high doses like the one used here alcohol appears to directly affect the neurocircuitry of emotion (see Donohue, Curtin, Patrick, & Lang, 2007; Moberg & Curtin, 2009), this effect likely was not mediated by higher-order cognitive processes as has been reported in previous studies using lower doses (see Curtin et al., 2001; Lang, Patrick, & Stritzke, 1999). Critically, this change in NA was significantly associated with ERN amplitude, and was a significant mediator of the effect of beverage on the ERN. Perhaps most importantly, the structural equation model analyses indicated an important role for NA change in understanding beverage effects on post-error behavioral adjustment. Specifically, the effect of alcohol on impaired post-error adjustment was mediated independently by both reduction in the ERN and by the relationship between NA change and the ERN, considering that
Alcohol and error processing
26
the multiply-mediated path contributed significantly to explaining the variance in post-error adjustment. However, it is important to acknowledge that, although the causal link from beverage consumption to both NA change and the ERN is clear, and although NA change was measured prior to the ERN, it is not clear that NA change caused changes in the ERN. Thus, although consistent with the idea of a temporally prior mediating variable, the causal direction from NA change to the ERN cannot be inferred from our analysis. The temporal ordering of the ERN relative to post-error adjustment is also unclear, and therefore a potential causal effect in that part of the model also must be interpreted with caution. A third potential mechanism for alcohol‟s reduction of the ERN posited in previous theoretical accounts (see Holroyd & Yeung, 2003; Yeung & Cohen, 2006) is that alcohol impairs visual perception, making it difficult for drinkers to identify targets and therefore to know whether their responses are incorrect. Although both uncertainty about the accuracy of one‟s response (Sheffers & Coles, 2000) and impaired target perception (see Yeung et al., 2007) can reduce ERN amplitude, the fact that alcohol did not impair overt error detection here makes it unlikely that target perception was impaired, and thus these likely are not the reasons for alcohol‟s effects on the ERN. It should be noted, however, that at substantially higher doses alcohol might impair stimulus perception and/or error detection. Still, the current work casts doubt on these mechanisms as explanations for effects of alcohol occurring at or near the legal limit for intoxication. In addition to shedding light on why alcohol reduces the ERN, the current data more generally are suggestive concerning how alcohol disrupts self-regulatory control over behavior. A number of previous studies have shown that larger ERN amplitude is associated with greater post-error behavioral adjustment (e.g., Gehring et al., 1993; Scheffers et al., 1996) and increased response control more generally (e.g., Amodio et al., 2004, 2008). The current data
Alcohol and error processing
27
suggest that alcohol disrupts this typical association. To the extent that the ERN represents a distress-related “alarm signal” (see Bush et al., 2000) indicating a control failure, it appears that alcohol effectively muffles this alarm, thereby limiting the extent to which regulative control can be implemented. In other words, perhaps alcohol impairs regulative control (see Bartholow et al., 2006; Curtin & Fairchild, 2003), at least in part, because the magnitude of the evaluative control signal (reflected in the ERN) is too weak to alert the regulative component that more control is needed. However, the fact that the critical test of the differences in ERN-Control associations across groups was marginally nonsignificant indicates that this interpretation should be viewed with caution; it seems likely that our design was simply under-powered to detect this interaction effect. The fact that ERN amplitude was larger in the placebo than in the control condition suggests a sensitivity of evaluative control processes to expectancy-related effects. Previous researchers have reported effects consistent with the idea that participants who consume placebos attempt to compensate for anticipated alcohol-induced impairment of motor responses (e.g., Fillmore, Mulvihill, & Vogel-Sprott, 1994; Fillmore & Vogel-Sprott, 1995; Saults, Cowan, Sher, & Moreno, 2007; Williams, Goldman, & Williams, 1981). If so, making errors could be particularly frustrating or distressing -- especially if participants are concerned about the implications of responses that could reveal race bias -- thereby eliciting larger ERNs. An important consideration for future research will be further specifying the extent to which differences in ERN amplitude and post-error adjustment following alcohol versus placebo consumption are attributable to a combination of the anxiolytic effects of alcohol and expectancy effects associated with placebo consumption, as well as individual differences in pre-existing expectancies concerning cognitive impairment (e.g., Fillmore & Blackburn, 2002).
Alcohol and error processing
28
The current findings also are in-line with predictions made by two prominent models of alcohol‟s acute effects on distress, namely, the appraisal-disruption model (Sayette, 1993) and the self-awareness model (Hull, 1981). The appraisal-disruption model predicts that, when consumed prior to the experience of a stressor, alcohol reduces NA by interfering with stressor appraisal. Our ERN findings are consistent with the idea that consuming alcohol limits the extent to which control failures are appraised as distressing. This finding also is consistent with the self-awareness model, which predicts that alcohol decreases negative self-evaluations following failure (e.g., Hull, Levenson, Young, & Sher, 1983). Future work should examine whether alcohol‟s effects on self-regulatory failure reflect such decreased self-evaluations. Despite its strengths, the current study suffered from two important limitations. First, our central hypothesis concerning alcohol-induced reduction of distress relied solely on a selfreported measure of NA. Ideally, additional measures of negative affect that have been used in previous studies of alcohol‟ s effects on distress, such as startle eye-blink magnitude (e.g., Curtin et al., 1998; Donohue et al., 2007) or skin conductance levels (e.g., Sher et al., 2007), should have been included. However, given that prior research has already established that doses of alcohol similar to the one used here are effective in reducing distress as indexed by those other measures, it seems safe to assume that similar effects would have been observed here. A second limitation of the current study is that requiring participants to make overt judgments of the correctness of their responses could interfere with typical error monitoring, potentially limiting effects of alcohol on error awareness. In the future, researchers should consider using a measure such as spontaneous error correction (see Fiehler, Ullsperger, & von Cramon, 2005; Rodríguez-Fornells, Kurzbuch, & Münte, 2002) to avoid this potential problem. Beyond their implications for understanding acute effects of alcohol on cognition, the current findings more generally suggest an important role for affect in self-regulatory processes.
Alcohol and error processing
29
Theorists have long argued that cognitive processes cannot be fully understood without accounting for effects of highly interdependent affective processes (Izard, 1993; LeDoux, 1996), an argument that also has been applied to understanding alcohol‟s acute effects (Curtin & Lang, 2007). The present data are wholly in-line with this view. Here, experiencing less negative affect following alcohol ingestion predicted smaller ERN amplitudes during the WIT, which in turn appeared to predict less effective performance adjustment following errors. In short, and consistent with other work (Gehring & Taylor, 2004; Hajcak & Foti, 2008; Hajcak et al., 2005), the current data suggest that the extent to which response outcomes are experienced as “worse than expected” (Holroyd & Coles, 2002) – and, therefore, activation of the ACC occurs – can critically depend upon tonic levels of negative affect.
Alcohol and error processing
30
References American Encephalographic Society (1994). Guideline thirteen: Guidelines for standard electrode position nomenclature. Journal of Clinical Neurophysiology, 11, 111-113. Amodio, D. M. (2009). Intergroup anxiety effects on the control of racial stereotypes: A psychoneuroendocrine analysis. Journal of Experimental Social Psychology, 45, 60-67. Amodio, D. M., Devine, P. G., & Harmon-Jones, E. (2008). Individual differences in the regulation of intergroup bias: The role of conflict monitoring and neural signals for control.
Journal of Personality and Social Psychology, 94, 60-74. Amodio, D. M., Harmon-Jones, E., Devine, P. G., Curtin, J. J., Hartley, S. L., & Covert, A. (2004). Neural signals for the control of unintentional race bias. Psychological Science, 15, 88–93. Ballantine, Jr., H.T., Cassidy, W.L., Flanagan, N.B., & Marino, Jr., R. (1967). Stereotaxic anterior cingulotomy for neuropsychiatric illness and intractable pain. Journal of Neurosurgery, 26, 488-495. Bartholow, B. D., Dickter, C. L., & Sestir, M. A. (2006). Stereotype activation and control of race bias: Cognitive control of inhibition and its impairment by alcohol. Journal of Personality
and Social Psychology, 90, 272-287. Bartholow, B. D., Pearson, M. A., Dickter, C. L., Sher, K. J., Fabiani, M., & Gratton, G. (2005). Strategic control and medial frontal negativity: Beyond errors and response conflict.
Psychophysiology, 42, 33-42. Botvinick, M. M., Braver, T. S., Barch, D. M., Carter, C. S., & Cohen, J. D. (2001). Conflict monitoring and cognitive control. Psychological Review, 108, 624-652. Botvinick, M. M., Cohen, J. D., & Carter, C. S. (2004). Conflict monitoring and anterior cingulate cortex: an update. Trends in Cognitive Sciences, 8, 539-546.
Alcohol and error processing
31
Bush, G., Luu, P., & Posner, M. L. (2000). Cognitive and emotional influences in anterior cingulate cortex. Trends in Cognitive Sciences, 4, 215-222. Carter, C.S., Braver, T.S., Barch, D.M., Botvinick, M., Noll, D., & Cohen, J.D. (1998). Anterior cingulate cortex, error detection, and the on line monitoring of performance. Science, 280, 747-749. Casbon, T. S., Curtin, J. J., Lang, A. R., & Patrick, C. J. (2003). Deleterious effects of alcohol intoxication: Diminished cognitive control and its behavioral consequences. Journal of
Abnormal Psychology, 112, 476-487. Coles, M. G. H., Scheffers, M. K., & Holroyd, C. B. (2001). Why is there an ERN/Ne on correct trials? Response representations, stimulus-related components, and the theory of errorprocessing. Biological Psychology, 56, 173–189. Corkin, S., & Hebben, N. (1981). Subjective estimates of chronic pain before and after psychosurgery or treatment in a pain unit. Pain, Sup. 1, S150. Correll, J., Park, B., Judd, C.M., & Wittenbrink, B. (2002). The police officer‟s dilemma: Using ethnicity to disambiguate potentially threatening individuals. Journal of Personality &
Social Psychology, 83, 1314–1329. Curtin, J. J., & Fairchild, B. A. (2003). Alcohol and cognitive control: Implications for regulation of behavior during response conflict. Journal of Abnormal Psychology, 112, 424–436. Curtin, J. J., & Lang, A. R. (2007). Alcohol and emotion: Insights and directives from affective science. In J. Rottenberg & S. Johnson (Eds.), Emotion and psychopathology: Bridging
affective and clinical science (pp. 191-213). Washington, DC: American Psychological Association.
Alcohol and error processing
32
Curtin, J. J., Lang, A. R., Patrick, C. J., & Stritzke, W. G. K. (1998). Alcohol and fear-potentiated startle: The role of competing cognitive demands in the stress-reducing effects of intoxication. Journal of Abnormal Psychology, 107, 547-557. Curtin, J. J., Patrick, C. J., Lang, A. R., Cacioppo, J. T., &. Birbaumer, N. (2001). Alcohol affects emotion through cognition. Psychological Science, 12, 527-531. Donohue, K. F., Curtin, J. J., Patrick, C. J., & Lang, A. R. (2007). Intoxication level and emotional response. Emotion, 7, 103-112. Falkenstein, M., Hoormann, J., Christ, S., & Hohnsbein, J. (2000). ERP components on reaction errors and their functional significance: A tutorial. Biological Psychology, 51, 87-107. Fiehler, K., Ullsperger, M., & von Cramon, D. Y. (2005). Electrophysiological correlates of error correction. Psychophysiology, 42, 72-82. Fillmore, M. T., & Blackburn, J. (2002). Compensating for alcohol-induced impairment: alcohol expectancies and behavioral disinhibition. Journal of Studies on Alcohol, 63, 237-246. Fillmore, M. T., Mulvihill, L. E., & Vogel-Sprott, M. (1994). The expected drug and its expected effect interact to determine placebo responses to alcohol and caffeine.
Psychopharmacology, 115, 383-388. Fillmore, M. T., & Vogel-Sprott, M. (1995). Expectancies about alcohol-induced motor impairment predict individual differences in responses to alcohol and placebo. Journal of
Studies on Alcohol, 56, 90-98. Fillmore, M. T., & Vogel-Sprott, M. (1999). An alcohol model of impaired inhibitory control and its treatment in humans. Experimental and Clinical Psychopharmacology, 7, 49–55. Fillmore, M. T., Vogel-Sprott, M., & Gavrilescu, D. (1999). Alcohol effects on intentional behavior: automatic and controlled processes. Experimental and Clinical
Psychopharmacology, 7, 372-378.
Alcohol and error processing
33
Fromme, K., & D‟Amico, E. J. (1999). Neurobiological bases of alcohol's psychological effects. In K. E. Leonard & H. T. Blane (Eds.). Psychological theories of drinking and alcoholism( 2nd ed., pp. 422-455). New York: Guilford Press. Gehring, W. J., Goss, B., Coles, M. G. H., Meyer, D. E., & Donchin, E. (1993). A neural system for error detection and compensation. Psychological Science 4, 385-390. Gehring, W. G., & Taylor, S. F. (2004). When the going gets tough, the cingulate gets going.
Nature Neuroscience, 7, 1285-1287. Gehring, W. J., & Willoughby, A. R. (2002). The medial frontal cortex and the rapid processing of monetary gains and losses. Science, 295, 2279-2282. Giancola, P. R. (2000). Executive functioning: a conceptual framework for alcohol-related aggression. Experimental and Clinical Psychopharmacology, 8, 576-597. Greeley, J., & Oei, T. (1999). Alcohol and tension reduction. In K. E. Leonard & H. T. Blane (Eds.), Psychological theories of drinking and alcoholism (2nd ed., pp. 14-53). New York: Guilford Press. Hajcak, G., & Foti, D. (2008). Errors are aversive: Defensive moti- vation and the error-related negativity. Psychological Science, 19, 103-108. Hajcak, G., Moser, J. S., Yeung, N., & Simons, R. F. (2005). On the ERN and the significance of errors. Psychophysiology, 42, 151-160. Hajcak, G. & Simons, R.F. (2008). Oops!...I did it again: An ERP and behavioral investigation of double-errors. Brain and Cognition, 68, 15-21. Hester, R., Foxe, J. J., Molholm, S., Shpaner, M., & Garavan, H. (2005). Neural mechanisms involved in error processing: A comparison of errors made with and without awareness.
NeuroImage, 27, 602 – 608.
Alcohol and error processing
34
Holroyd, C. B., & Coles, M. G. H. (2002). The neural basis of human error processing: Reinforcement learning, dopamine, and the error-related negativity. Psychological Review,
109, 679-709. Holroyd, C. B., & Yeung N. (2003). Alcohol and error processing. Trends in Neurosciences, 26, 402-404. Hull, J. G. (1981). A self-awareness model of the causes and effects of alcohol consumption.
Journal of Abnormal Psychology, 90, 586-600. Hull, J. G., Levenson, R. W., Young, R. D., & Sher, K. J. (1983). The self-awareness reducing effects of alcohol consumption. Journal of Personality and Social Psychology, 44, 461473. Jacoby, L. L. (1991). A process dissociation framework: Separating automatic from intentional uses of memory. Journal of Memory and Language, 30, 513-541. Kenny, D. A. (2009). Mediation. Retrieved from http://davidakenny.net/cm/mediate.htm#IE Kerns, J. G., Cohen, J. D., MacDonald, A. W. III, Cho, R. Y., Stenger, V. A., et al., (2004). Anterior cingulate conflict monitoring and adjustments in control. Science, 303, 10231026. Koob, G. F., Roberts, A. J., Schulteis, G., Parsons, L. H., Heyser, C. J., et al. (1998). Neurocircuitry targets in ethanol reward and dependence. Alcoholism: Clinical and
Experimental Research, 22, 3-9. Lang, A., Patrick, C., & Stritzke, W. (1999). Alcohol and emotional response: A multidimensional-multilevel analysis. In K. Leonard & H. Blane (Eds.). Psychological
theories of drinking and alcoholism - 2nd Edition (pp. 328-371). New York: Guilford.
Alcohol and error processing
35
Levenson, R. W., Sher, K. J., Grossman, L. M., Newman, J., & Newlin, D. B. (1980). Alcohol and stress response dampening: Pharmacological effects, expectancy, and tension reduction.
Journal of Abnormal Psychology, 89, 528-538. Izard, C. E. (1993). Four systems for emotion activation: Cognitive and noncognitive processes.
Psychological Review, 100, 68-90. LeDoux, J. (1996). The emotional brain: The mysterious underpinnings of emotional life . New York, NY: Touchstone. Leigh, B. C., & Morrison, D. M. (1991). Alcohol consumption and sexual risk-taking in adolescents. Alcohol Health & Research World, 15, 64-72. Li, C. R., Huang, C., Yan, P., Paliwal, P., Constable, R. T., et al. (2008). Neural correlates of post-error slowing during a stop signal task: A functional magnetic resonance imaging study. Journal of Cognitive Neuroscience, 20, 1021-1029. MacKinnon, D. P., Fairchild, A. J., & Fritz, M. S. (2007). Mediation analysis. Annual Review of
Psychology, 58, 593-614. Miyake, A., Friedman, N. P., Emerson, M. J., Witzke, A. H., Howerter, A., & Wager, T. D. (2000). The unity and diversity of executive functions and their contributions to complex “frontal lobe” tasks: A latent variable analysis. Cognitive Psychology, 41, 49-100. Moberg, C. A., & Curtin, J. J. (2009). Alcohol selectively reduces anxiety but not fear: Startle response during unpredictable vs. predictable threat. Journal of Abnormal Psychology,
118, 335-347. Muthén, L.K., & Muthén, B.O. (2007). Mplus user‟s guide (5th ed.). Los Angeles, CA: Muthén & Muthén. National Highway Traffic Safety Administration (NHTSA) (2009). Traffic Safety Facts 2008:
Alcohol-Impaired Driving. Washington, DC: NHTSA.
Alcohol and error processing
36
Nieuwenhuis, S., Ridderinkhof, K. R., Blom, J., Band, G. P. H., & Kok, Al. (2001). Error-related brain potentials are differentially related to awareness of response errors: Evidence from an antisaccade task. Psychophysiology, 38, 752-760. Olvet, D.M., & Hajcak, G. (2009). The stability of error-related brain activity with increasing trials. Psychophysiology, 46, 957-961. Payne, B. K. (2001). Prejudice and perception: The role of automatic and controlled processes in misperceiving a weapon. Journal of Personality and Social Psychology, 81, 181–192. Payne, B. K. (2005). Conceptualizing control in social cognition: How executive control modulates the expression of automatic stereotyping. Journal of Personality and Social
Psychology, 89, 488–503. Payne, B. K., Shimizu, Y., & Jacoby, L. L. (2005). Mental control and visual illusions: Toward explaining race-biased weapon identifications. Journal of Experimental Social Psychology,
41, 36-47. Peyron, R., Laurent, B., & García-Larrea, L. (2000). Functional imaging of brain responses to pain. A review and meta-analysis. Clinical Neurophysiology, 30, 263–288. Rabbitt, P. M. (1966). Errors and error correction in choice-response tasks. Journal of
Experimental Psychology, 71, 264-272. Rainville, P., Duncan, G. H., Price, D. D, Carrier, B., & Bushnell, C. M. (1997). Pain affect encoded in human anterior cingulate but not somatosensory cortex. Science, 277, 968971. Ridderinkhof, K. R., de Vlugt, Y., Bramlage, A., Spaan, M., Elton, M., et al. (2002). Alcohol consumption impairs detection of performance errors in mediofrontal cortex. Science, 298, 2209-2211.
Alcohol and error processing
37
Rodríguez-Fornells, A., Kurzbuch, A. R., & Münte, T. F. (2002). Time course of error detection and correction in humans: Neurophysiological evidence. The Journal of Neuroscience, 22, 9990-9996. Sagar, H.A., & Schofield, J.W. (1980). Racial and behavioral cues in black and white children‟s perceptions of ambiguously aggressive acts. Journal of Personality and Social Psychology,
39, 590–598. Saults, J. S., Cowan, N., Sher, K. J., & Moreno, M. V. (2007). Differential effects of alcohol on working memory: Distinguishing multiple processes. Experimental and Clinical
Psychopharmacology, 15, 576-587. Sayette, M. A. (1993). An appraisal-disruption model of alcohol's effects on stress responses in social drinkers. Psychological Bulletin, 114, 459-476. Sayette, M.A. (1999). Does drinking reduce stress? Alcohol Research and Health, 23, 250-255. Sayette, M. A., Smith, D. W., Breiner, M.J., & Wilson, G. T. (1992). The effect of alcohol on emotional response to a social stressor. Journal of Studies on Alcohol, 53, 541-545. Semlitsch, H. V., Anderer, P., Schuster, P., & Presslich, O. (1986). A solution for reliable and valid reduction of ocular artifacts, applied to the P300 ERP. Psychophysiology, 23, 695– 703. Scheffers, M. K., & Coles, M. G. H. (2000). Performance monitoring in a confusing world: Errorrelated brain activity, judgments of response accuracy, and types of errors. Journal of
Experimental Psychology: Human Perception and Performance, 26, 141-151. Scheffers, M. K., Coles, M. G. H., Bernstein, P., Gehring, W. J., & Donchin, E. (1996). Eventrelated brain potentials and error-related processing: An analysis of incorrect responses to go and no-go stimuli. Psychophysiology, 33, 42-53.
Alcohol and error processing
38
Sher, K. J., Bartholow, B. D., Wood, M. D., Peuser, K., & Erickson, D. (2007). Stress-responsedampening effects of alcohol: Attention as a mediator and moderator. Journal of Abnormal
Psychology, 116, 362-377. Sher, K. J., Bylund, D. B., Walitzer, K. S., Hartmann, & Ray-Prenger, C. (1994). Platelet MAO activity: Personality, substance use, and the stress-response-dampening effect of alcohol. Experimental and Clinical Psychopharmacology, 2, 53-81. Sher, K. J., & Walitzer, K. (1986). Individual differences in the stress-response-dampening effect of alcohol: A dose response study. Journal of Abnormal Psychology, 95, 159-167. Steele, C. M., & Josephs, R. (1988). Drinking your troubles away II: The role of activity in mediating alcohol‟s reduction of anxiety. Journal of Abnormal Psychology, 97, 196-205. Steele, C. M., & Josephs, R. A. (1990). Alcohol myopia: Its prized and dangerous effects.
American Psychologist 45, 921-933. Talbot, J. D., Marrett, S., Evans, A. C., Meyer, E., Bushnell, C. M., et al. (1991). Multiple representations of pain in human cerebral cortex. Science, 251, 1355-1358. Testa, M., Fillmore, M. T., Norris, J., Abbey, A., Curtin, J. J., & Leonard, K. E. (2006). Understanding Alcohol Expectancy Effects: Revisiting the Placebo Condition. Alcoholism:
Clinical and Experimental Research, 30, 339-348. Vidal, F., Hasbroucq, T., Grapperon, J., & Bonnet M. (2000). Is the „error negativity‟ specific to errors? Biological Psychology, 51, 109–128. Watson, D., Clark, L. A., & Tellegen, A. (1988). Development and validation of brief measures of positive and negative affect: the PANAS scales. Journal of Personality and Social
Psychology, 54, 1063-1070.
Alcohol and error processing
39
Watson, P. E. (1989). Total body water and blood alcohol levels: Updating the fundamentals. In K. Crow & R. Batt (Eds.), Human metabolism of alcohol: Vol. 1. Pharmacokinetics,
medicolegal aspects, and general interest (pp. 41–58). Boca Raton, FL: CRC Press. Wiers, R., Bartholow, B. D., van den Wildenberg, E., Thush, C., Engels, R., Sher, K. J., Grenard, J., Ames, S., & Stacy, A. (2007). Automatic and controlled processes and the development of addictive behaviors in adolescents: A review and a model. Pharmacology, Biochemistry,
and Behavior, 86, 263-283. Williams, R.M., Goldman, M.S. & Williams, D.L. (1981). Expectancy and pharmacological effects of alcohol on human cognitive and motor performance: The compensation for alcohol effect. Journal of Abnormal Psychology, 90, 267-270. Yeung, N., Botvinick, M.M., & Cohen, J.D. (2004). The neural basis of error detection: Conflict monitoring and the error-related negativity. Psychological Review, 111, 931–959. Yeung, N., & Cohen, J. D. (2006). The impact of cognitive deficits on conflict monitoring: Predictable dissociations between the error-related negativity and N2. Psychological
Science, 17, 164-171. Yeung, N., Ralph, J., & Nieuwenhuis S. (2007). Drink alcohol and dim the lights: The impact of cognitive deficits on medial frontal cortex function. Cognitive Affective & Behavioral
Neuroscience, 7, 347-355.
Alcohol and error processing
40
Footnotes 1. We opted to use a relatively high dose of alcohol in this study because previous reports have indicated that, whereas at lower doses (up to around 0.7 g/kg) alcohol‟s effects on emotion are mediated by cognitive factors such as attention (see Curtin et al., 2001; Sher et al., 2007), at higher doses alcohol appears to directly affect emotional reactivity (see Donohue et al., 2007; Moberg & Curtin, 2009).
2. We also conducted an ancillary analysis using the arcsine of the square root of the accuracy rates, and found that all effects were essentially unchanged. For ease of interpretation, we opted to present the analysis of the untransformed accuracy rates in the text.
3. Total number of errors correlated with ERN amplitude, r = .51, p < .01. However, including number of errors as a covariate did not eliminate the Beverage effect, F(2, 59) = 7.10, p < .01, and all simple comparisons remained significant ( ps < .05). The main analysis also showed a significant Beverage x Target interaction, F(2, 64) = 3.98, p = .02. Post-hoc follow-up contrasts showed that the ERN was larger on tool trials than on gun trials in the placebo group,
t(18) = 2.01, p < .05, but not in the other groups (ps > .05). This interaction is irrelevant to our primary hypothesis and so is not elaborated here. Also, a larger ancillary analysis using data from all electrode locations also showed a main effect of Beverage, F(2, 60) = 12.48, p < .001, indicating that the effect reported in the text is not limited to electrode FCz. We opted to report the simpler analysis in the text because the larger analysis also includes a number of higher-order interactions involving scalp location that are not of interest here.
Alcohol and error processing Table 1
Mean Levels of PANAS Positive and Negative Affect at Baseline and Following Beverage Consumption
Beverage
PA
NA
Post-
Post-
group
Baseline
drinking
Change
Baseline
drinking
Change
Alcohol
24.09
26.39
+2.30
12.00
10.48
-1.52
(8.03)
(9.99)
(5.23)
(2.52)
(1.65)
(2.59)
25.36
21.68
-3.68
11.50
12.45
+0.95
(5.18)
(6.33)
(4.34)
(1.79)
(2.42)
(2.84)
22.41
19.77
-2.64
11.32
11.09
-0.23
(6.22)
(5.64)
(4.10)
(3.01)
(1.77)
(2.49)
Placebo Control
Note. PA = Positive Affect; NA = Negative Affect. Numbers in parentheses are standard deviations. The post-drinking assessment was taken 10 min following the completion of beverage consumption.
41
Alcohol and error processing
42
Figure Captions
Figure 1. Schematic of the Weapon Identification Task (Payne, 2001), adapted from Amodio et al., (2004).
Figure 2. Timeline of events during experimental sessions. Figure 3. Reaction times (panel A) and accuracy rates (panel B) to categorize targets as a function of prime race, target type, and beverage group.
Figure 4. Response‐locked ERP waveforms measured at electrode FCz on error trials (top panel) and on correct trials (bottom panel), as a function of beverage group. ‟R‟ (time zero) indicates response onset. The ERN is visible as the prominent negativity peaking approximately 80 ms post‐response on error trials; the Pe is the positivity following the ERN, peaking approximately 160 ms post-response on error trials.
Figure 5. The interference effect in RT after errors and after correct responses, as a function of beverage group. Vertical bars represent ± 1 SE.
Figure 6. Scatterplots depicting associations between ERN amplitude and the PDP control estimate, as a function of beverage group. *p < .05.
Figure 7. Response accuracy judgments for correct and incorrect response trials as a function of beverage group. Analyses were carried out using the arcsine of the square root of accuracy rates (proportions), which reduces skew in the distribution and makes the data more suitable for analysis of variance. However, for ease of interpretation the untransformed data are presented here. Vertical bars represent ± 1 SE.
Figure 8. Structural equation model depicting associations among study variables. Significant associations are depicted with solid lines. Paths associated with significant indirect effects are shown in bold. Nonsignificant associations are depicted with dashed lines. Effects for the Alcohol and Control variables represent effects relative to the placebo group. NA change and
Alcohol and error processing
43
PA change = change from baseline to the first post-drinking assessment in negative affect and positive affect, respectively. ERN and Pe = average amplitude of those components at the electrode site where they were largest (FCz and Cz, respectively). Overt error recognition represents the proportion of incorrect responses judged as errors. Post-error adjust. = average RT interference effect on trials that followed errors. Error terms of the NA change and PA change variables, as well as the ERN and Pe variables, were correlated in the model (neither was significant), but those paths were not depicted in the figure in order to reduce clutter.
Alcohol and error processing
44
0:00 1:00
0 hr 1 hr 1:20
2 hr 2:15 2:50
3 hr
Timeline of experimental sessions 3:13 3:36
Debriefing
Electrode removal Post-experimental measures
Second half of WIT trials BrAC and PANAS
First half of WIT trials BrAC and PANAS
Beverage administration Absorption period BrAC and PANAS
Electrode placement Task instructions Practice block
Pregnancy test/restroom break Total body water calculations Baseline BrAC, PANAS
Arrival at the lab, consent Beverage group assignment Questionnaire measures
Alcohol and error processing
3:56 4:10
4 hr
45
Alcohol and error processing
RT (ms)
A Tools Guns
Alcohol
490 480 470 460 450 440 430 420 410 400 Black
White
Placebo
Control
Black
White
Black
White
Race of prime faces
B Accuracy (% correct)
Tools Guns
Alcohol
1.00 0.95
Control
Placebo
0.90
0.85 0.80 0.75
0.70 0.65 Black
White
Black
White
Race of prime faces
Black
White
46
Alcohol and error processing
-12.5
Amplitude (µV)
-10.0
Error trials
Placebo Control
-7.5
Alcohol
-5.0
-2.5 0.0
2.5 5.0
R
-400 -300 -200 -100 -10.0
Amplitude (µV)
-7.5
0
100 200 300 400 500 600
Time (ms)
Correct trials
-5.0 -2.5 0.0 2.5
5.0 -400 -300 -200 -100
0
100 200 300 400 500 600
Time (ms)
47
Alcohol and error processing
35
Post-correct
Post-error
Interference effect (ms)
30 25 20
15 10 5
0 Alcohol
Control
Placebo
48
Alcohol and error processing
Placebo
Control
0.0
-5.0
-5.0
-10.0
-10.0 -15.0 -15.0
r = -.49*
-20.0
-25.0
r = -.47*
-20.0 0.20
0.40
0.60
0.80
1.00
0.20
0.40
PDP Control
0.60
PDP Control
Alcohol
10.0
ERN amplitude (µV)
ERN amplitude (µV)
0.0
49
5.0
0.0 -5.0 -10.0
r = -.09
-15.0 -20.0 0.00
0.20
0.40
0.60
PDP Control
0.80
1.00
0.80
1.00
Judgment accuracy (proportion)
Alcohol and error processing
1.00 0.95
0.90 0.85
0.80
Control
0.75 0.70
Placebo
0.65
Alcohol
0.60 0.55
0.50
Correct
Incorrect
Actual response accuracy
50
Alcohol and error processing
e
e
NA change
-.46
ERN
e
Alcohol
Overt error recognition
-.51
Control
PA change
Pe
e
e
e
Post-error adjust.
51