The 8th International Renewable Energy Congress (IREC 2017)
SVC versus STATCOM for Improving Power System Loadability: A Case Study A. Qatamin, A. Etawi, G. Safasfeh, N. Ajarmah, s. AI-Jufout, I. Drous Dept. of Electrical Power Engineering Tafila Technical University Tafila, Jordan
[email protected]
c.
Keywords- FACTS; MATLABISimulink; STATCOM; SVC; transmission line; voltage drop INTRODUCTION
Flexible alternating current transmission system (FACTS) controllers are designed to improve the performance of power systems and increase the power transfer capability. Enhancement of the transmission capacity up to 40-50% can be achieved by using a FACTS device [I]. FACTS controllers have several advantages such as: power-flow control; voltage stability and control; loadability enhancement; improvement of transient stability and power oscillation damping [1 ]-[3]. Static V AR compensator (SVC) is one of these FACTS devices. SVC is a set of devices designed for providing fastacting reactive power on transmission networks. A lot of research papers have been published on SVc. In [4], optimal allocation of SVC has been determined based on its performance evaluation at different locations using four criteria: voltage profile; recovery time; improvement index and reduction of loss percentage of real and reactive powers. The small signal stability improvement of a single-machineinfinite-bus system with an SVC connected at the mid-point of the transmission line is investigated in [5]. As a supplementary signal for the SVC damping controller, line current signal was used. Results were validated by many case studies. Modeling and simulation of SVC and reactive power control are presented in [6], where SVC was modeled then configured in the power system to analyze its behavior for reactive power
978-1-5090-6751-0117/$3l.00 ©2017lEEE
A. H. Soliman Dept. of Electrical Engineering Staffordshire University Stoke-on-Trent, UK
[email protected]
Dept. of Electrical and Computer Engineering Wayne State University Detroit, USA
[email protected]
Abstract-In this work, static VAR compensator (SVC) is used to improve the 33-kV AI-Qatraneh transmission line performance. The SVC location has been determined by maintaining a better voltage profile with minimum voltage drops at the load buses of the given power system. MATLAB/Simulink has been used to simulate the operation of the transmission line and its 110 load buses. The suggested SVC and its location will enhance the transmission capability of the line and solve the problem of the expected overload in 2020. The obtained results have been compared with those results when a static compensator (ST ATCOM) is used to enhance the voltage profile of the same transmission line. The loading rise percentage has been considered 14.35% annually. The line-to-Iine voltages at different load buses with- and without FACTS controllers have been illustrated.
I.
Wang
control along with impact on voltage level. In [7], authors presented the heuristic optimization technique teaching learning based optimization for the optimal location and setting of SVC to achieve minimum installation cost, real power transfer loss and enhance the voltage profile. Authors validated their proposed algorithm in the IEEE-14 bus system with load flow equation based on Newton-Raphson algorithm. A comparative study of voltage profile improvement of a grid connected distributed generation using a unified power flow controller (UPFC) and SVC to make the system stable and more reliable is presented in [8]. Authors in [9] used the method of sensitivity indices to investigate the performance improvement of power system with SVc. In [10], genetic algorithm has been used to find the optimal location of SVC in power systems. The behavior of STATCOM and SVC in power systems is presented in [II]. Authors concluded with guidelines that can be used by the power companies. Different control methods for damping undesirable inter-area oscillation using power system stabilizers (PSS), SVC and STATCOM are found in [12]. IEEE 50-machine, 145-bus test system has been used to compare these control techniques. Authors in [13] provide a comprehensive analysis of the effects of FACTS devices: thyristor-controlled series compensator (TCSC); UPFC; SVC and STA TCOM. They based their analysis on lEEE-14 bus system and showed how FACTS devices enhance the voltage profile and the loadability of power systems. IT.
POWER SYSTEM MODELLING
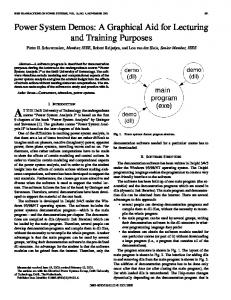
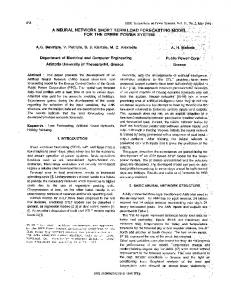
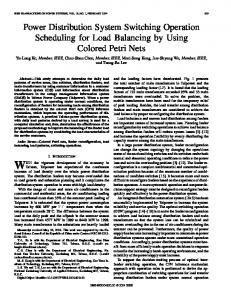
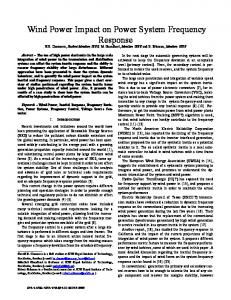
132-kV and 400-kV transmission lines interconnect the load centers with the electrical stations at different regions in Jordan. 400-kV tie-line connects Jordan with Egypt by the 400kV cable through the Red Sea; 230-kV and 400-kV tie-lines connect it with Syria (Fig. 1).3366 MW is the total Jordanian power system installed capacity. 10303 MVA is the total installed capacity of the substations [14]. AI-Qatraneh is a town, located in the southern region of Jordan, about 85 km to the south of Amman, the capital city of Jordan. AI-Qatraneh 132/33 kV electrical bulk substation supplies three transmission lines: AI-Ljoun; AI-Sultani and AIQatraneh transmission lines. This paper will consider AlQatraneh transmission line only, configuration of which is shown in Fig. 2. AI-Qatraneh 33-kV transmission line feeds 110 load buses with distribution transformers of 33/0.4 kV, 50-
1500 kVA. Its total length is 60 km. The load data for the year 2013 was obtained from the Electrical Distribution Company (EDCO), where the total load connected to the given transmission line is 15.09 MVA. The annual demand increase is about 14.35%. After four years, in 2020, AI-Qatraneh transmission line will be overloaded.
Nililonal EIectrk: Po .. er Co . (NEPCOJ
the distribution transformers. Loads are modeled by resistiveinductive-capacitive branches using load model in the library of MA TLAB/Simulink. Series resistive-inductive equivalent circuits represent the short transmission lines [16]-[ 19]. The input data of this model is the data obtained by EDCO, which includes the ratings of the bulk substation 132/33 kV, the type, parameters and length for all parts of AI-Qatraneh 33k V transmission line as listed in Table 1. The rating of the 11 0 distribution transformers and the power of all 110 loads are shown in Table 11.
National Transm ission Grid
TABLE 1. TRANSMISSION LINE PARAMETERS
Type ACSR ACSR AAAC AAAC
Mltin Bulk Substatoonl OHTL 112 leV U .G.~tlle
L-~
132 1(\1
________________________
Fig. 1. Jordanian transmission grid [14].
~
lZ!J
This work aims at improving the voltage profile, increasing the transmission capability of the given transmission line using SVC, overcoming the expected overload in 2020 and comparing the results with those when STA TCOM is used [15]. Maximum average line-to-line voltage is proposed as a criterion to determine the optimum location of the FACTS controller.
.' ,'!
...
,
,.
",
Name Rabbit Dog Oak Hazel
Rdc, U/km 0.5426 0.2733 0.2769 0.5498
L,mh/km
Rac,U/km
0.603 0.533 0.533 0.603
0.6082 0.3036 0.3104 0.6163
TABLE II. POWER AT THE SYSTEM LOAD BUSES Bus# I 2 3 4 5 6 7 8 9 10 \I 12 13 14 15 16 17 18 19 20 21 22 23 24 25 26 27 28 29 30 31 32 33 34 35 36 37
Power, kVA 87.333 98.93 62.173 98.931 98.92 3.544 25.048 98.93 1.173 0.809 29.872 1.148 4.244 0.763 33 98.8 4.785 98.8 98.7 1.876 98.452 82.433 98.93 98.93 98.93 98.93 98.93 98.93 98.934 98.93 82.442 10.712 98.93 45.617 76.422 6.647 85.4 78
Bus# 38 39 40 41 42 43 44 45 46 47 48 49 50 51 52 53 54 55 56 57 58 59 60 61 62 63 64 65 66 67 68 69 70 71 72 73 74
Power, kVA 85.629 98.933 88.312 141.368 1.477 98.920 70.199 511.688 69.373 88 101.918 82.433 36.582 100.848 102.677 120.634 98.92 48.12 398.621 98.921 88.08 98.93 98.935 114.84 74.365 103.12 28.721 4978.606 27.849 232.045 431.133 5.185 227.946 11.33 44.997 21.808 74.282
Bus# 75 76 77 78 79 80 81 82 83 84 85 86 87 88 89 90 91 92 93 94 95 96 97 98 99 100 101 102 103 104 105 106 107 108 109 110
Power, kVA 98.926 98.923 167.92 116.817 131.218 180.516 98.93 39.296 63.529 98.927 131.096 80.248 71.961 99.414 98.919 28.846 17.877 14.54 15.007 98.929 98.924 50.624 6.445 98.923 101.077 66.666 98.926 802.146 130.826 41.216 5.129 97.866 23.978 10.084 4.573 9.916
Fig. 2. Configuration of33-kV AI-Qatraneh transmission line.
MA TLAB/Simulink is used to model the given power system shown in Fig. 2 and calculate its steady-state conditions. A three-phase source is used to model the bulk substation. MA TLAB/Simulink transformer model represents
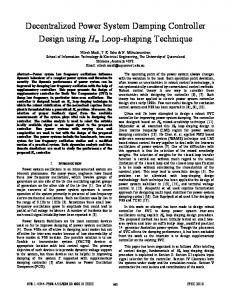
SVC MATLAB/Simulink model, shown in Fig. 3, is used to represent the installation of an SVC to the given power system. The power and control parameters of the SVC have been set as shown in Table Ill. Fig. 4 shows the STATCOM
MATLAB/Simulink model used in [15]. Its power and control parameters are shown in Table IV.
to-line voltage is 0.369 kV whereas the average voltage drop is 7.75%.
v:average = Ir:,lN V Li
r-----------------------,
(1)
where N is the number of nodes in the system.
> bIJ .s -0 > 0)"
0)
400 390 380 370
~" 360
Fig. 3. Block diagram of an SVC and its control [20]. · ----------v~ ------------ '
f
0)
350
"
;.:i
340 10
0
~t\
20
30
40
50
60
70
80
100 110
90
Bus Number Fig. 5. Line-to-Iine voltages at the system buses in 2016.
VI}
To avoid the voltage drop expected in 2020, it is proposed installing an SVc. This SVC was installed at all load buses. Fig. 7 shows the expected average line-to-line voltages at the load buses in 2020 after installing an SVC at different load buses.
(bn•.rol
SYs1l:m
Fig. 4. Block diagram of a ST ATCOM and its control [20].
TABLE III.
SVC POWER AND CONTROL PARAMETERS
Item Nominal voltage, kV Nominal frequency, Hz Three-phase base power, MVA Reactive power limits, MV AR Average time delay due to thyristor valves firing Td , ms Reference voltage, pu Drop X" pu/phase Voltage regulator gain K" puB/puV Voltage regulator gain K" puB/puV/s
Value 33 50 50 -25 to 25 4 I 0.03 0 300
As shown from Fig. 7, the minimum average line-to-line voltage at the system buses is when the SVC is connected to the transmission line sending end at bus number 1, while the maximum average line-to-line voltage at the system buses occurs when the SVC is connected to bus number 80 (0.382 kV).
>
400
-0
~ >
380
0)
370
v 390
"
;.:i
6 360
+;' 0)
"
;.:i
350 340 0
10
20
30
40
50
60
70
80
90
100 110
Bus Number TABLE IV.
STATCOM POWER AND CONTROL PARAMETERS
Item Nominal voltage, kV Nominal frequency, Hz Converter rating, MVA Reference voltage, pu Drop x" pu/phase Voltage regulator gain K" puB/puV Voltage regulator gain K" puB/puV/s
Value 33 50 100 I 0.03 5 1000
Fig. 6. Expected line-to-Iine voltages at the system buses in 2020.
>
v
~
RESULTS AND DISCUSSION
The line-to-line voltages at all load buses in the year 2016, after considering an annual rise of the load by 14.35%, are shown in Fig. 5, where the average line-to-line voltage, calculated by (1), is 0.377 kV with an average voltage drop of 5.75%. Fig. 6 shows the line-to-line voltages at the load buses as predicted in 2020. As shown from Fig. 6, the average line-
380 +------------,~+-_H'---=-----'>J--II__I
-0
>
g
;.:i
6
Ill.
385
-Z
"
375 +---f~~-~'--------------~ 370 +-'- - - - - - - - - - - - - - - - - - ----j
;.:i
365
o
10
20
30
40
50
60
70
80
90
100 110
Bus Number Fig. 7. Average line-to-line voltages of the system buses as expected in 2020 with an S VC connected at different system buses.
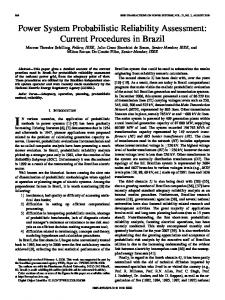
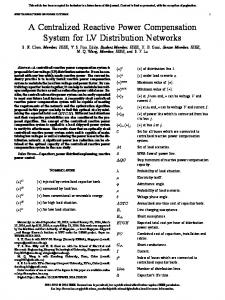
Fig. 8 illustrates the line-to-line voltages at the system buses as predicted in 2020 without FACTS controllers (the blue line), with a STATCOM connected to load bus number 65 (the red line), where the average line-to-line voltage is 0.386 kV [15], and with an SVC installed at the system bus number 80 (the black line), where the average line-to-line voltage is 0.382 kV. As shown from Fig. 8, the effect of the STATCOM on the voltage profile of the given power system is better than the effect when the SVC is connected the system.
>
o:i bIJ ,:3
'0
400 390
>
380
"
370
0)
;:i
~
Q)
"
;:i
current-transmission-system. [2]
R. Vanitha, 1. Baskaran, and S. Kamalsakthi, "Implementation of imperialist competitive algorithm for optimal allocation of FACTS devices to enhance the power system performance," IEEE Computation of Power, Energy Information and Commuincation Conference, pp. 832836,2016.
[3]
Q. Qiu and N. Wu., "Control eflectiveness of FACTS devices in power systems," American Control Conference, pp. 7504-7509,2016.
[4]
G. Sriparna, B. Debarghya, and P. Acharjee, "Voltage profile improvement and loss reduction using optimal allocation of SVC," Annual IEEE India Conference, pp. 1-6,2015.
[5]
K. Shagufia, R. Meena, and S. Bhowmick, "Small signal stability improvement of a single machine infinite bus system using SVC," Annual IEEE India Conference, pp. 1-5,2015.
[6]
A. Pathak, M. Sharma, and M. Gupta, "Modeling and simulation ofSVC for reactive power control in high penetration wind power system," Annual IEEE India Conference, pp. 1-6,2015.
[7]
R. Agrawal, S. Bharadwaj, and D. Kothari, "Optimal location and sizing of SVC considering transmission loss and installation cost using TLBO," Annual IEEE India Conference, pp. 1-6,2015.
[8]
P. Pandey and B. Bag, "A comparative study on UPFC and SVC towards voltage profile improvement of a grid connected distributed generation system," IEEE Energy, Power and Environment: Towards Sustainable Growth International Conference, pp. 1-5,2015.
[9]
1. Chetan and K. Vadirajacharya, "Performance improvement of power system through static VAR compensator using sensitivity indices analysis method," IEEE Energy Systems and Applications International Conference, pp. 200-202, 2015.
360 350 340 0
10 20
30
40
50
60
70
80
90 100 110
Bus Number - - without FACTS Device - - with STATCOM - - with SVC
Fig. 8. Line-to-Iine voltages of the system buses as expected in 2020 without FACTS devices, with a ST ATCOM at bus number 65 and with an SVC at bus number 80. TV. CONCLUSION
In this paper, SVC has been used to enhance the loadability and voltage profile of AI-Qatraneh 33-kV transmission line in Jordan. Maximum average line-to-line voltage has been proposed as a criterion to determine the optimum location of the FACTS controller. It has been determined by keeping minimum voltage drops at all the 110 system load buses. The given power system has been modeled by MA TLAB/Simulink. An SVC and its location have been proposed to raise the power transmission capability of the given transmission line and to avoid the overload expected in 2020. The annual percentage loading rise has been considered 14.35%. The obtained results after installing the SVC in its optimum location (load bus number 80) have been compared to the results when increasing the transmission capability of the same power system was achieved by installing a STA TCOM at its optimum location (load bus number 65). Comparison shows that, for the given power system, using STATCOM leads to a better voltage profile than using SVC. A graphical illustration of the line-toline and average voltages at all load buses of the given power system has been analyzed. ACKNOWLEDGMENT
Authors would like to express their gratitude to EDCO for sending them the given power system parameters, namely Anas Abwine, Mahmoud AI-Qaqa and Ali Hamad as well. Saleh AIJ ufout (2016/2017 Fulbright visiting scholar at Wayne State University, USA) would like also to express his gratitude to Tafila Technical University for supporting his research visit. REFERENCES [1]
FACTS. (2016, September 30). Retrieved from http://www.gridtech.eu/ project-scope/technologies!l2-technologies!2l-facts-flexible-alternating
[10] K. Swarnalatha and K. Amaresh, "Optimal location of static VAR compensator in power system using genetic algorithm," International Journal of Electrical and Electronic Engineering & telecommunications, vol. 2, no. 1,2013. [11] M. Noroozian, N. A. Petersson, B. Thorvaldson, A. B. Nilsson, and C. W. Taylor, "Benefits of SVC and STATCOM for electric utility application," IEEE Transmission and Distribution Conference, vol. 3, pp. 1143-1150,2003. [12] N. Mithulananthan, A. Claudio, J. Reeve, and G. J. Rogers, "Comparison of PSS, SVC, and STATCOM controllers for damping power system oscillations," IEEE Transactions on Power Systems, vol. 18, no. 2, pp. 786-792, 2003. [13] M. Kamarposhti, M. Alinezhad, H. Lesani, and N. Talebi, "Comparison of SVC, STATCOM, TCSC, and UPFC controllers for static voltage stability evaluated by continuation power flow method," IEEE Electric Power Conference, pp. 1-8,2008. [14] National Electrical Power Company. (2016, September 30). Retrieved from http://www.nepco.comjol. [15] A. Hamad, 1. AI-Drous, and S. AI-Jufout, "Enhancement of the performance of AI-Qatraneh 33-kV transmission line using STATCOM: a case study," International Journal of Electrical, Computer, Energetic, Electronic and Communication Engineering, vol. 9, no. 11, pp. 12221225,2015. [16] S. AI-Jufout, "Fault simulation by hypothetical stub moving along short transmission line," International Conference on Quality, Reliability and Maintenance QRM, pp. 283-286, 2004. [17] S. AI-Jufout, "Condition monitoring of a short transmission line," International Journal of COMADEM, vol. 8, no. I, pp. 6-7,2005. [18] S. AI-Jufout, "Fault simulation by hypothetical stub moving along IEEE Mediterranean medium-length transmission line," Electrotechnical Conference, vol. 13, no. 2, pp. 1098-1101,2006. [19] S. AI-Jufout, "Improved algorithm for fault simulation by hypothetical stub moving along medium-length transmission line," European Journal of Scientific Research, vol. 23, no. 3, pp. 400-405, 2008. [20] MathWorks. (2016, October 4). Retrieved from https:!lwww.mathworks. comlhelp/physmod/sps/powersys/refi'staticvarcompensatorphasortype.ht ml?s tid=srchtit