SVD based Gene Selection Algorithm Andri Mirzal Faculty of Computing N28-439-03 Universiti Teknologi Malaysia 81310 UTM Johor Bahru, Malaysia
[email protected]
Abstract. This paper proposes an unsupervised gene selection algorithm based on the singular value decomposition (SVD) to determine the most informative genes from a cancer gene expression dataset. These genes are important for many tasks including cancer clustering and classification, data compression, and samples characterization. The proposed algorithm is designed by making use of the SVD’s clustering capability to find the natural groupings of the genes. The most informative genes are then determined by selecting the closest genes to the corresponding cluster’s centers. These genes are then used to construct a new (pruned) dataset of the same samples but with less dimensionality. The experimental results using some standard datasets in cancer research show that the proposed algorithm can reliably improve performances of the SVD and kmeans algorithm in cancer clustering tasks. Keywords: cancer clustering, DNA microarray datasets, gene selection algorithm, kmeans, singular value decomposition
1
Introduction
Cancer clustering using microarray gene expression datasets is one of the most important researches in medical community [1–9]. Cancer clustering is an unsupervised task of grouping tissue samples from patients with cancers so that samples with the same cancer type can be clustered in the same group. It is worth to mention that this task is complement but different to cancer classification [10–23], a supervised task where the classifiers are trained first using training datasets before being used to classify the samples. In principle, any clustering algorithm can be used for this task. However, gene expression datasets have one particular characteristic that must be taken into account: they usually consist of only a few samples (hundreds at most), but each sample is represented by thousands of gene expressions. This characteristic makes clustering task challenging because usually clustering algorithms perform poorly when the number of samples is small. Additionally, the huge dimensionality of the samples implies that the datasets contain many irrelevant and potentially misleading gene expressions. Thus, gene selection procedure should be employed to clean the datasets.
In this paper, we propose an unsupervised gene selection algorithm based on the SVD to determine the most informative genes from a gene expression dataset. The algorithm is designed by making use of clustering capability of the SVD to find the natural groupings of the genes. The most informative genes are then chosen by selecting the closest genes to the corresponding cluster’s centers. These genes are then used to construct a new (pruned) dataset of the same samples but with less dimensionality. To evaluate improvements made by the proposed algorithm, we compare the quality of clustering with and without the gene selection procedure using two clustering methods: the SVD and kmeans algorithm.
2
The SVD
The SVD is a matrix decomposition technique that factorizes a rectangular real or complex matrix into its left singular vectors, right singular vectors, and singular values. Some applications of the SVD include clustering [24, 25], approximating a matrix [26], computing pseudoinverse of a matrix [27], and determining the rank, range, and null space of a matrix [28]. The SVD of matrix A ∈ CM ×N with rank(A) = r is defined with: A = UΣVT , where U ∈ CM ×M = [u1 , . . . , uM ] denotes a unitary matrix that contains left singular vectors of A, V ∈ CN ×N = [v1 , . . . , vN ] denotes a unitary matrix ×N that contains right singular vectors of A, and Σ ∈ RM denotes a matrix + that contains singular values of A along its diagonal with the diagonal entries σ1 ≥ . . . σr > σr+1 = . . . = σmin(M,N ) = 0 and zeros otherwise. Rank-K approximation of A using the SVD is defined with: T , A ≈ AK = UK ΣK VK
(1)
where K < r, UK and VK contain the first K columns of U and V respectively, and ΣK denotes a K × K principal submatrix of Σ. Eq. 1 is also known as the truncated SVD of A, and according to the Eckart-Young theorem, AK is the closest rank-K approximation of A in Frobenius norm criterion[26, 27].
3
The proposed algorithm
Algorithm 1 outlines the proposed gene selection algorithm. The output of the ˆ is then inputted to the SVD and kmeans for clustering purpose. algorithm, A, ˆ is the same as the samples in A but its columns Note that the samples in A consist of only the top genes selected by algorithm 1. Algorithm 2 describes the standard clustering procedure using the SVD. And clustering procedure using ˆ When kmeans is conducted by simply applying kmeans algorithm on rows of A. no gene selection procedure is used, then the clustering procedures will be the ˆ As shown, both the gene selection same, but the input will be A instead of A. procedure and the clustering algorithms are unsupervised methods, thus this strategy can be implemented in a fully unsupervised fashion.
Algorithm 1 SVD based gene selection algorithm. ×N Input: sample-by-gene matrix A ∈ RM , and #cluster K. + Normalize each column of A, i.e., amn ← ∑ amn for ∀n. m amn Compute VK = [v1 , . . . , vK ] of A. Apply k-means clustering on rows of VK to obtain K clusters of the genes. Compute cluster’s centers by averaging all gene vectors an in the same cluster. Compute Euclidean distances of all genes from the corrensponding centers. Sort the genes according the the distances (in ascending order), and select G < N top genes from the list. ×G ˆ ∈ RM 8. Form the pruned matrix A where the colums are the top genes selected + from step 7.
1. 2. 3. 4. 5. 6. 7.
Algorithm 2 Clustering procedure using the SVD. 1. 2. 3. 4.
4
×N ×G ˆ ∈ RM Input: sample-by-gene matrix A ∈ RM (or A ), and #cluster K. + + ˆ Normalize each column of A (or A). ˆ Compute UK = [u1 , . . . , uK ] of A (or A). Apply k-means clustering on rows of UK to obtain K clusters of the samples.
Experimental results
We will now use of the proposed algorithm to improve clustering performances of the SVD and kmeans algorithm using four standard datasets in cancer clustering research. The datasets were downloaded from http://algorithmics.molgen.mpg.de /Static/Supplements/CompCancer/datasets.htm in which the authors provided 35 cancer gene expression datasets compiled from many resources [29]. Table 1 outlines the datasets used for this purpose. To measure clustering quality, we used two metrics; Adjusted Rand Index (ARI) and Accuracy. We used these metrics because they seem to be the most commonly used metrics in cancer clustering research. The following gives the definition of the metrics. Accuracy is the most commonly used metric to measure the performance of clustering algorithms. In some literatures, it is also known as purity [4]. It measures the fraction of the dominant class in a cluster. Accuracy is defined
Table 1. Cancer datasets. Dataset name
Tissue
Nutt-2003-v2 Armstrong-2002-v2 Tomlins-2006-v2 Pomeroy-2002-v2
Brain Blood Prostate Brain
#Samples #Genes #Classes 28 72 92 42
1070 2194 1288 1379
2 3 4 5
with [1]: Accuracy =
R 1 ∑ max crs , M r=1 s
where r and s denote the r-th cluster and s-th reference class respectively, R denotes the number of clusters produced by clustering algorithm, M denotes the number of samples, and crs denotes the number of samples in r-th cluster that belong to s-th class. The values of Accuracy are between 0 and 1 with 1 indicates a perfect agreement between the reference classes and the clustering results. Adjusted Rand Index (ARI) has a value ranges from -1 to 1, with 1 indicates the perfect agreement and values near 0 or negatives correspond to clusters found by chance. ARI is defined wth [30], [31], [32]: ∑ (crs )
( )−1 ∑ (cr∗ ) ∑ (c∗s ) − N2 ARI = [∑ ( ) ∑ ( )] ( r)−12 ∑ (s 2) ∑ ( ) , cr∗ c∗s cr∗ c∗s 1 − N2 r s 2 r s 2 2 2 + 2 rs
2
where cr∗ denotes the number of samples in r-th cluster, and c∗s denotes the number of samples in s-th class. There is one parameter needs to chosen in the proposed algorithm: the number of top genes G. As reported in[11, 13], only a handful number of genes need to be selected. And usually 50 top genes (often lesser) are sufficient[13]. Accordingly, we used 50 top genes for all cases.
Table 2. Results of the SVD without gene selection. Dataset name Nutt-2003-v2 Armstrong-2002-v2 Tomlins-2006-v2 Pomeroy-2002-v2
ARI 0.0107 ± 0.0 0.518 ± 0.0399 0.0828 ± 0.0244 0.287 ± 0.125
Accuracy 0.571 ± 0.0 0.720 ± 0.0247 0.489 ± 0.0350 0.598 ± 0.0901
Table 3. Results of kmeans without gene selection. Dataset name Nutt-2003-v2 Armstrong-2002-v2 Tomlins-2006-v2 Pomeroy-2002-v2
ARI 0.0185 0.491 0.164 0.181
± 0.0191 ± 0.0997 ± 0.0439 ± 0.0939
Accuracy 0.583 0.729 0.559 0.481
± 0.0272 ± 0.0454 ± 0.0405 ± 0.0755
Table 4. Results of the SVD with gene selection. Dataset name Nutt-2003-v2 Armstrong-2002-v2 Tomlins-2006-v2 Pomeroy-2002-v2
ARI 0.101 0.637 0.143 0.455
± 0.101 ± 0.119 ± 0.0336 ± 0.110
Accuracy 0.644 0.825 0.535 0.717
± 0.0961 ± 0.0876 ± 0.0336 ± 0.0762
Table 5. Results of kmeans with gene selection. Dataset name Nutt-2003-v2 Armstrong-2002-v2 Tomlins-2006-v2 Pomeroy-2002-v2
ARI 0.0624 0.601 0.171 0.377
± 0.0767 ± 0.149 ± 0.0481 ± 0.115
Accuracy 0.621 0.785 0.564 0.663
± 0.0743 ± 0.0954 ± 0.0415 ± 0.0810
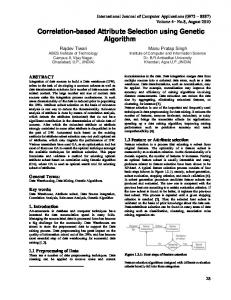
Table 2 and 3 give clustering performances of the SVD and kmeans without the gene selection procedure measured in ARI and Accuracy, and table 4 and 5 show the measurements when the gene selection procedure was employed. Because the proposed algorithm does not have uniqueness property (due to the use of kmeans to obtain clustering assignments from VK in step 4), the experiments were repeated 1000 times for each case, and the values are displayed in format average values ± standard deviation values over these trials. Figure 1 plots average values in table 2–5. It is interesting to see that without gene selection procedure, the performances of the SVD and kmeans are quite comparable (first row of figure 1). Then when the procedure is employed, the SVD seems to benefit more (second row of figure 1). The performance improvements of the SVD and kmeans due to the gene selection procedure are summarized in first row and second row of figure 2 respectively. Table 6 and 7 give more quantitative results of the improvements. As shown, the gene selection procedure improved the clustering performances for both the SVD and kmeans in all cases with the better improvements were observed in the SVD cases.
5
Conclusion
We have presented an unsupervised gene selection algorithm based on the SVD. The proposed algorithm was designed by making use of clustering capability of the SVD to select the most informative genes from a gene expression dataset. The experimental results showed that the proposed algorithm improved clustering performances of the SVD and kmeans algorithm with more visible improvements were observed in the SVD cases. In addition to improving the clustering
ARI without gene selection
Accuracy without gene selection
0.7
0.8 SVD Kmeans
0.6
SVD Kmeans
0.7 0.6
0.5
0.5 0.4 0.4 0.3 0.3 0.2
0.2
0.1 0
0.1
Nutt
Armstrong
Tomlins
Pomeroy
0
Nutt
(a) ARI
Armstrong
Tomlins
Pomeroy
(b) Accuracy
ARI with gene selection
Accuracy with gene selection
0.7
0.9 SVD Kmeans
0.6
SVD Kmeans
0.8 0.7
0.5 0.6 0.4
0.5
0.3
0.4 0.3
0.2 0.2 0.1 0
0.1 Nutt
Armstrong
Tomlins
Pomeroy
0
(c) ARI
Nutt
Armstrong
Tomlins
Pomeroy
(d) Accuracy
Fig. 1. Performance comparison between the SVD and kmeans (first row: without gene selection, second row: with gene selection).
Table 6. Percentages of improvements (SVD). Dataset name
ARI
Accuracy
Nutt-2003-v2 Armstrong-2002-v2 Tomlins-2006-v2 Pomeroy-2002-v2
846.3 22.94 72.88 58.63
12.62 14.55 9.417 19.99
Average
250.2
14.14
Results of SVD (ARI)
Results of SVD (Accuracy)
0.7
0.9 Without Gene Selection With Gene Selection
0.6
Without Gene Selection With Gene Selection
0.8 0.7
0.5 0.6 0.4
0.5
0.3
0.4 0.3
0.2 0.2 0.1 0
0.1 Nutt
Armstrong
Tomlins
Pomeroy
0
Nutt
(a) ARI
Armstrong
Tomlins
Pomeroy
(b) Accuracy
Results of Kmeans (ARI)
Results of Kmeans (Accuracy)
0.7
0.8 Without Gene Selection With Gene Selection
0.6
Without Gene Selection With Gene Selection
0.7 0.6
0.5
0.5 0.4 0.4 0.3 0.3 0.2
0.2
0.1 0
0.1
Nutt
Armstrong
Tomlins
Pomeroy
0
(c) ARI
Nutt
Armstrong
Tomlins
Pomeroy
(d) Accuracy
Fig. 2. Improvements gained by employing the gene selection algorithm (first row corresponds the the SVD and second row to kmeans).
Table 7. Percentages of improvements (kmeans). Dataset name Nutt-2003-v2 Armstrong-2002-v2 Tomlins-2006-v2 Pomeroy-2002-v2 Average
ARI 237.3 22.47 4.093 108.5 93.08
Accuracy 6.489 7.765 0.9220 37.80 13.24
performance, the gene selection procedure also has a benefit in reducing the sizes of the datasets significantly (in our cases from thousands to only 50). So that some mechanism of gene selection should be employed to remove irrelevant and misleading gene expressions before analyzing any gene expression dataset.
Acknowledgement The author would like to thank to the reviewers for their valuable comments. This work is supported by The Ministry of Higher Education Malaysia under Fundamental Research Grant Scheme.
References 1. Gao, Y., Church, G.: Improving Molecular cancer class discovery through sparse non-negative matrix factorization. Bioinformatics 21(21), 3970–3975 (2005) 2. Dueck, D., et al.: Multi-way clustering of microarray data using probabilistic sparse matrix factorization. Bioinformatics 21(1), 145–151 (2005) 3. Brunet, J.P., et al.: Metagenes and molecular pattern discovery using matrix factorization. Proc. Natl Acad. Sci. USA 101(12), 4164–4169 (2003) 4. Kim, H., Park, H.: Sparse non-negative matrix factorizations via alternating nonnegativity constrained least squares for microarray data analysis. Bioinformatics 23(12), 1495–1502 (2007) 5. Carmona-Saez, et al.: Biclustering of gene expression data by non-smooth nonnegative matrix factorization. BMC Bioinformatics 7(78) (2006) 6. Inamura, K., et al.: Two subclasses of lung squamous cell carcinoma with different gene expression profiles and prognosis identified by hierarchical clustering and nonnegative matrix factorization. Oncogene (24), 7105–7113 (2005) 7. Fogel, P., et al.: Inferential, robust non-negative matrix factorization analysis of microarray data. Bioinformatics 23(1), 44–49 (2007) 8. Zheng, C.H., et al.: Tumor Clustering Using Nonnegative Matrix Factorization With Gene Selection. IEEE Transactions on Information Technology in Biomedicine 13(4), 599–607 (2009) 9. Wang, J.J.Y., et al.: Non-negative matrix factorization by maximizing correntropy for cancer clustering. BMC Bioinformatics 14(107) (2013) 10. Golub, T.R., et al.: Molecular classification of cancer: class discovery and class prediction by gene expression monitoring. Science 286(5439), 531–537 (1999) 11. Guyon, I., et al.: Gene Selection for Cancer Classification using Support Vector Machines. Machine Learning 46(1-3), 389–422 (2002) 12. Yuvaraj, N., Vivekanandan, P.: An efficient SVM based tumor classification with symmetry Non-negative Matrix Factorization using gene expression data. In Int’l Conf. on Information Communication and Embedded Systems, pp. 761–768 (2013) 13. Pirooznia, M., et al.: A comparative study of different machine learning methods on microarray gene expression data. BMC Genomics 9(Suppl 1), S13 (2008) 14. Liu, X., et al.: An Entropy-based gene selection method for cancer classification using microarray data. BMC Bioinformatics 6 (2005) 15. Wang, L., et al.: Accurate Cancer Classification Using Expressions of Very Few Genes. IEEE/ACM Transactions on Computational Biology and Bioinformatics 4(1), 40–53, 2007.
16. Chuang, L.Y., et al.: Improved binary PSO for feature selection using gene expression data. Computational Biology and Chemistry 32(1), 29–37 (2008) 17. Mitra, P., Majumder, D.D.: Feature Selection and Gene Clustering from Gene Expression Data. In 17th Int’l Conf. on Pattern Recognition, pp.343–346 (2004) 18. Furey, T.S., et al.: Support vector machine classification and validation of cancer tissue samples using microarray expression data. Bioinformatics 16(10), 906–914 (2000) 19. Moon, S., Qi, H.: Hybrid Dimensionality Reduction Method Based on Support Vector Machine and Independent Component Analysis. IEEE Transactions on Neural Networks and Learning Systems 23(5), 749–761 (2012) 20. Lee, Y., Lee, C.K.: Classification of multiple cancer types by multicategory support vector machines using gene expression data. Bioinformatics 19(9), 1132–1139 (2003) 21. Zhang, X., et al.: Recursive SVM feature selection and sample classification for mass-spectrometry and microarray data. BMC Bioinformatics 7(197) (2006) 22. Lu, Y., Han, J.: Cancer classification using gene expression data. Information Systems 28(4), 243–268 (2003) 23. Zhang, H.H., et al.: Gene selection using support vector machines with non-convex penalty. Bioinformatics 22(1), 88–95 (2006) 24. Dhillon, I.S.: Co-clustering documents and words using bipartite spectral graph partitioning. In 7th ACM SIGKDD Int’l Conference on Knowledge Discovery and Data Mining, pp. 269–274 (2001) 25. Drineas, et al.: Clustering Large Graphs via the Singular Value Decomposition. Machine Learning 56(1-3), 9–33 (2004) 26. Eckart, C., Young, G.: The approximation of one matrix by another of lower rank. Psychometrika 1, 211–218 (1936) 27. Golub, G.H., Kahan, W.: Calculating the singular values and pseudo-inverse of a matrix. J. SIAM Numerical Analysis 2(2), 205–224 (1965) 28. Golub, G.H., van Loan, C.F.: Matrix computations 3rd edition. Johns Hopkins University Press (1996) 29. Souto, M.C.P., et al.: Clustering cancer gene expression data: a comparative study. BMC Bioinformatics 9(497) (2008) 30. Rand, W.M.: Objective criteria for the evaluation of clustering methods. Journal of the American Statistical Association 66(336), 846–850 (1971) 31. Hubert, L., Arabie, P.: Comparing partitions. Journal of Classification 2(1), 193– 218 (1985) 32. Vinh, N.X., et al.: Information theoretic measures for clustering comparison: Is a correction for chance necessary? In 26th Annual Int’l Conf. on Machine Learning, pp. 1073–1080 (2009)