The most potential nodes to be visited are markets, schools, hospitals, offices, and some crossroads. .... A route is satisfactory for the company when the number of demand is high. Demand is determined ..... Daily Ravenna. FIGURE 4. Forward ...
Jurnal Antarabangsa (Teknologi Maklumat) 2(2002): 51-64
Sweep Algorithm in Vehicle Routing Problem For Public Transport GUNADI W . NURCAHYO, ROSE ALINDA ALIAS , SM MAMYAM SHAMSUDDIN &
MOHD. NOOR MD. SAP.
ABSTRACT
This paper investigates the capability of Sweep Algorithm in solving the vehicle routing problem for public transport The Sweep Algorithm is firstly introduced as a method to search shortest route in the vehicle routing problem. In order to evaluate the result of the algorithm, current routes profile of a public transport is presented. An application is constructed based on the algorithm and tested using current routes data. The route generation is performed repeatedly using different constraints in order to obtain the optimal solution. A route is selected based on shortest distance and capacity constraint. Each constraint affects the route selection to gain different combination of routes. Revenue and operational cost are considered to select the best combination of routes. Two methods in sweep algorithm are implemented and compared to find the better method. The result shows that Sweep Algorithm is capable of solving vehicle routing problem for public transport under certain constraints. ABSTRAK
Kertas kerja ini menglcaji keupayaan algoritma Sweep dalam menyelesaikan masalah laluan kenderaan bagi pengangkutan awam. Untuk menilai hasil keputusan bagi algoritma tersebut, prof ail laluan terkini bagi pengangkutan awam diberi. Penjanaan laluan dilaksanakan berulangkali menggunakan kekangan yang berza bagi mencapai penyelesaian yang optima. Laluan yang dipilih berdasarkan kepada jarak yang terdekat dan kekangan kapasiti. Setiap kekangan mempengaruhi pilihan laluan bagi memperolehi gabungan laluan yang berbeza. Revenue dan kos operasi dipertimbangkan bagi memilih gabungan laluan terbaik. Dua kaedah bagi algoritma Sweep dilaksana dan dibandingkan bagi mendapatkan satu pendekatan yang terbaik. Hasil kajian mendapati bahawa algoritma Sweep berupaya menyelesaikan masalah laluan kenderaan bagi pengangkutan awam berdasarkan kepada kekangan yang bersesuaian.
INTRODUCTION There are hundreds of papers found in literature which address vehicle routing problems. Most of them cover problems of vehicle routing where the demand is known. A large number of different heuristic algorithms have been developed to route vehicles. One of the simplest is Sweep Algorithms proposed by Gillet and Miller (1974). This algorithm is constructed to generate routes for goods delivery vehicles in which a solution to travelling salesman problem takes place in the second stage of the two stages which exist in Sweep Algorithm. The travelling salesman problem has been discussed for solving pick-up and delivery problem (Mosheiov, 1994) and school bus routes (Forbes et. al. 1994). This paper investigates the capability of the Sweep Algorithm in generating routes for public transport vehicles assuming that the demand at certain nodes is known. Demand at nodes is determined in average as explained in Section 3. Sweep algorithm is a constrained-based heuristic in which the number of nodes generated in a route depends on the capacity given to each node. Consequently, route generations which are performed repeatedly using different capacity constraint may obtain a number of route combinations with different performance. The results of the route generations are then compared to each other to determine whether Sweep Algorithm is suitable for solving public bus routing problem. This can be seen by comparing the performance of routes obtained by Sweep Algorithm with that of current routes. The performance of current routes is based on data from a public transport company located in Semarang, Indonesia. Revenue is the main criterion that is used to compare the performance of routes in this paper. The objective of the route selection is to obtain combination of routes with maximum revenue. Operational cost can also be considered to support the result of the selection. ROUTES PROFILE Recently, the company maintains four routes in Semarang and their specifications are listed in Table 1. The routes were determined based on the surveys conducted by the company and the requirement for transportation service of the citizen of Semarang. The survey is required to determine all potential nodes where number of demand is high. The most potential nodes to be visited are markets, schools, hospitals, offices, and some crossroads. Therefore, a route is formed based on the number of potential nodes along the route. Route distance is the distance travelled by the buses from the origin to the destination. A trip is a travel completed by a bus from the origin to the destination. The number of trips shown in the table is the maximum number of travels completed in a route. The average time per trip is the average time travelled by all buses from the origin to the destination in the route. The 52
number of buses represents the total buses provided by the company to serve the routes. TABLE 1. Routes Maintained by a Public Transport Company in Semarang Route
Mangkang - Terboyo Ngalian - Pucang Gading Terboyo - Banyumanik Johar - Perumnas
Distance
Number
Average
Number
(Km)
of Trips
Time per Trip (minutes)
of Buses
20.5 24.2 17.5
10 10 10 10
80 SO 80 80
24 15 13 13
16
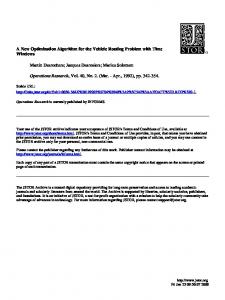
Figure 1 illustrates the routes maintained by the company in a crow-fly mode where the paths are shown as straight lines. Note that the length of the lines connecting the nodes does not represent the actual distance of the paths.
Table 2 shows the current route profile in which each route consists of several links with their distance and average demand. The revenue of each route is the total fare of all links in the given route. In order to determine the average number of a demand, data was collected by one of the authors by following the buses which were operating along the routes for a period of three months. The method of data collection is explained in Section 3. Table 2 shows the current route profile in which each route consists of several links with their distance and average demand. The revenue of each route is the total fare of all links in the given route. In order to determine the average number of a demand, data was collected by one of the authors by following the buses which were operating along the routes for a period of three months. The method of data collection is explained in Section 3. Hence, the total revenue collected and the total distance travelled of the current routes each day of the company are Rp 802,900 and 78.2 Km respectively. Notice that some links occur in two routes. Since an average demand belongs to links and not to routes, the revenue of the links which occur in the second route is ignored when computing the total revenue of all TABLE 2. Current Route Profile a. Route 1 Links
Distance (Km)
Average Demand Revenue/day (Rp)
Mangkang-Jrakah
7
46
32200
Jrakah-Sudirman Sudirman-Bulu Bulu-Tugu Muda Tugu Muda-Johar Johar-Pengapon Pengapon-Terboyo
2.5 3 1 3 1 3
51 25 105 126 6 47
35700 17500 73500 88200 4200 32900
Total
20.5
406
284200
b. Route 2 Links Ngalian-Jrakah
Distance (Km)
Average Demand Revenue/day (Rp)
3
43
30100
Jrakah-Sudirman Sudirman-Bulu Bulu-Tugu Muda Tugu Muda-Simpang 5 Simpang 5-Pedurungan Pedurungan-P.Gading
2.5 3 1 2.5 9.2 3
51 25 105 18 101 70
35700 17500 73500 12600 70700 49000
Total
24.2
413
289100
54
c. Route 3 Links
Distance (Km)
Average Demand
Revenue/day (Rp)
3
47
32900
Pengapon-Johar Johar Tugu -Muda Tugu Muda-Sutomo Sutomo-S.Parman S.Pannan-A.Agung S.Agung-Jatingaleh Jatingaleh-Banyumanik
1 3 1.5 2 2.5 1.5 3
6 126 124 52 60 115 103
4200 88200 86800 36400 42000 80500 72100
Total
17.5
633
443100
Distance (Km)
Average Demand
Revenue/day (Rp)
3
126
88200
Tugu Muda-Sutomo Sutomo-S.Parman S.Parman-S.Agung S.Agung-Jatingaleh Jatingaleh-Banyumanik Banyumanik-Perumnas
1.5 2 2.5 1.5 3 2.5
124 52 60 115 103 55
86800 36400 42000 80500 72100 38500
Total
16
635
444500
Terboyo-Pengapon
d. Route 4 Links Johar-Tugu Muda
routes. In other words, revenue of a link is only used once in calculating total revenue. For instance, if the revenue of link Johar has been used to compute the total revenue of route 3 then revenue of Johar will not be included in calculating the total revenue of route 4. DEMAND Demand is data that indicates whether or not the route satisfies the requirement. A route is satisfactory for the company when the number of demand is high. Demand is determined for every link in a route. A link may consist of several nodes or locations where demand requires a transport service to travel to certain locations in the given city. A survey was carried out to extract the demand data. The survey is conducted by a car-following process in every route maintained by the company. Daily data of demand are collected during three months of survey. Average number of demand for each bus in a route is calculated to get 55
demand data as shown in Table 3. Based on sweep algorithm developed by Teodorovic and Pavkovic (1996), demand is denoted as Dt (i=l, 2, ..., k, where k is the number of nodes in a route). Demand at a route Dr is:
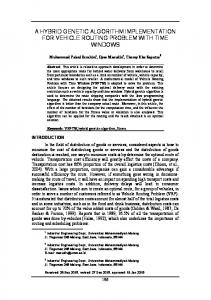
SWEEP ALGORITHM Sweep algorithm is applied to polar coordinate and the depot is considered to be the centre of the coordinate. The depot is joined with an arbitrarily chosen point called node. All other nodes are joined to the depot and then aligned by increasing the angles which are formed by the segment that connects the nodes to the depot; the segment that connects the depot to a node is assumed to be the first node. In current routes, there is a node that intersects with all routes which exist. This node will be assumed as the depot in the Sweep-based application that is tested in this paper. The other nodes are located based on their coordinates after they are scaled from the actual location. The complete location of the nodes and their attributes are shown in Table 3. The nodes coordinates represent the locations of nodes in the polar coordinate. Depot is located at coordinate 324,124. As mentioned previously, Sweep Algorithm consists of two stages, clustering and route generation. At the first stage, all nodes are clustered based on their capacity. In goods delivery vehicle routing, capacity is the maximum number of goods that can be carried in serving a route. In this case, the maximum number of goods carried by the vehicle depends on the capacity of the vehicle itself. On the other hand, capacity for bus routing is the maximum number of passengers that can be carried by a bus along the route. In this case, capacity of a bus does not represent the maximum number 56
of passengers that can be carried along the route because some of the passengers may end the journey before the route is completed. The bus may also serve more passengers. The location of nodes in the polar coordinate is illustrated in Figure 2.
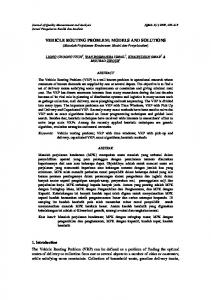
Sweep Algorithm consists of two stages: (i) Stage 1: Clustering Figure 3 illustrates a clustering process of several nodes. The black dots represent the nodes and the straight lines represent the sweep hand that moves anti-clockwise. Clustering is performed by joining nodes beginning from the closest node to any node that is chosen to be the first node. The closest node is one which has smallest angle. This process is repeated by joining the second closest, the third, and so forth until it satisfies the constraint. When node[i+l] will be joined with nodefi] in the first cluster, demand[i+l] is added to demandfi] and then check the capacity constraint. Node[i+1] is joined with nodefi] if the total demand is less than the capacity constraint. When a node cannot be included in the first cluster since this would violate the constraint, this node becomes the first node of the second cluster. The process is completed when all nodes are included in the clusters.
FIGURE 3. Clustering Process
(ii) Stage 2: Route Generation Route generation is aimed to link all nodes in every cluster starting from and ending to the same depot. The result of this process is a shortest path connecting all nodes in the cluster. At this stage, a solution to travelling salesman problem (TSP) is required to conduct the route generation. The idea of TSP is to find an optimal tour. A tour for TSP is a circuit on a graph containing each node exactly once (Rosenkrantz et al. 1977). An optimal tour of graph G is a tour of minimal length. The TSP is to take a travelling salesman graph and find an optimal tour. The algorithm used in this TSP stage is the nearest neighbour algorithm (Bellmore & Nemhauser, 1968). 58
The Sweep algorithm can be implemented using two different methods, forward sweep and backward sweep (Gillet & Miller, 1974). In the forward sweep algorithm, the locations are clustered from the first node and continued to the next nodes in a clockwise manner. The process in the backward sweep is exactly like the forward sweep algorithm except it forms the clusters in reverse order. Both methods are also compared to each other in order to determine which method gives better results. THE APPLICATION The application of Sweep Algorithm for public bus routing consists of several steps to perform tasks that occur in both stages of the algorithm. As shown in Figure 2, there are four different areas exist in the polar coordinate. Area of polar coordinate is initialized by i where i=l, 2, 3, and 4. For each area i, there are j nodes that will be joined in the routes (j=l, 2, ...., n). The complete steps of the application are described as follow, (i) Locate nodes in polar coordinate Loc[i,j] is the location of node j in area i where 1£ i£4 and 1£ j£n. For example: Loc[2,l] is location of the first node in area 2. Value of j will be set back to 1 for the next i. The coordinate of each node is also initialized in the same manner i.e. VerX[i,j] for vertex X and VerY[i,j] for vertex Y. a. Calculate angles After all nodes have been located, polar angle of each node is calculated using formula:
(ii) Specify sweep method Before clustering begins, sweep method is specified to determine the order of clustering. In forward sweep, clustering is starts from nodes in area 4 and then continued to area 3, 2 and ended in area 1. In backward sweep, on the other hand, clustering is performed in reverse order. (iii) Create clusters A cluster is a group of nodes that satisfies certain constraint. These nodes are joined based on their angles, i.e. a node with smallest angle is joined with one with second smallest, and then third smallest and so forth until the capacity constraint is satisfied. Note that each node has certain capacity. Capacity in this case is the average demand that can be serviced by a bus.
59
(iv) Create distance matrix After being clustered, the nodes in each cluster are linked to generate routes. The nodes are linked based on the distance of one node to another. This first node to be linked in each cluster is the one that has the shortest distance to the depot. The next node to be linked is selected by searching a node that is closest to the first node. This procedure is repeated until all nodes in the same cluster are linked as a route. The same procedure is performed for the next cluster. Distance of a node to the other nodes is identified by calculating radian of the given node.
The results of the calculation are stored in a distance matrix. DistMatrix[j,j+k] is the distance from node / to node j+k in a cluster (k=0, 1, 2, ..... ). The initialization of a distance is:
(v) Search and place shortest path A solution to a Travelling Salesman Problem is used to select a shortest path. This procedure will use the distance matrix to get the distance of a node to another node that is going to be linked. Each time a shortest path is found, the selected node is linked to the given route. (vi) Calculate revenue The route generation is completed when all nodes have been joined to the route in each cluster. In order to evaluate the performance of the generated routes, a calculation procedure is performed to find the daily revenue, total distance, and operational cost of all routes. (vii) Display routes When the calculation is completed, the result of the route generation is then displayed and evaluated. EXPERIMENTAL RESULT The public bus routing application is tested several times with different capacity constraint using both forward and backward sweep methods. Some different constraints are given to obtain results as many as possible in order to support accurate information. Based on the result, it is found that forward and backward sweeps obtain different routes with different performance. For constraint=200, there are
60
some routes that consist only one link in which the value of average revenue is no longer valid. Therefore, the revenue for such a route is set to zero. Table 4 shows the performance of route 3 with constraint equals to 200. TABLE 4. Route Performance of Constraint 200 Sweep
Capacity: 200 Route 3 Links
method: Forward
Distance (Km)
Revenue (Rp)
Cost/bus
Bulu-Tugu Muda
1.00
0.00
9,620.55
Total per route:
1.00
0.00
9,620.55
The value of revenue increases as higher constraints are given to the route selection. When constraint 600 is given, the routes generated by both forward and backward methods are the same except the order of links. Table 5 shows the routes generated by the forward sweep algorithm. More information referring to the results of the Sweep Algorithm are shown in Table 6. Note that the total distance and the daily cost of the generated routes are not listed in the table. Both attributes in all routes and constraints are exactly the same. As seen on the table, the number of routes decreases when the capacity constraint increases. It is shown in the results as presented above that the number of cluster obtained by the Sweep Algorithm represents the number of routes. When the capacity constraint equals to 200, one cluster can only include few nodes. As a result, there are many clusters TABLE 5. Routes Performance of Constraint 600 Capacity: 600 Route 1 Links
Sweep method: Forward Distance (Km)
Revenue (Rp)
Cost/bus (Rp)
Sutomo-Tugu Muda
1.50
86,800
9,620.55
Tugu Muda-Bulu Ngalian-Jrakah Jrakah-Sudirman Sudirman-Bulu Mangkang-Jrakah Tugu Muda-Johar Johar-Pengapon Pengapon-Terboyo
1.00 3.00 2.50 3.00 7.00 3.00 1.00 3.00
73,500 30,100 35,700 17,500 32,200 88,200 4,200 32,900
6,413.70 19,241.00 16,034.25 19,241.10 44,895.90 19,241.10 6,413.70 19,241.10
Total per route:
25.00
401,100
160,342.50
61
TABLE 5. Routes Performance of Constraint 600 Route 2 Links
Distance (Km)
Revenue (Rp)
Cost/bus
2.50
12,600
16,034.25
Tugu Muda-Simpang 5 Simpang 5Pedurungan-P.Gading S.Parman-S.Agung Sutomo-S.Parman S.Agung-Jatingaleh PerumnasBanyumanik BanyumanikJatingaleh Total per route:
9.20 3.00 2.50 2.00 1.50 2.50 3.00
70,700 49,000 42,000 36,400 80,500 38,500 72,100
59,006.04 19,241.00 16,034.25 12,827.40 9,620.55 16,034.25 19,241.10
26.20
401,800
168,038.94
Total all route:
51.20
802,900
328,381.44
which are obtained by Sweep Algorithm. When the capacity constraint increases, there are more nodes which can be included in a cluster and, therefore, fewer clusters are obtained by the algorithm. TABLE 6. Results of Sweep Algorithm Capacity
Number
Daily Revenue (Rp)
of Routes
200
8
300 400 500 600
5 4 3 2
Forward Sweep Algorithm Backward Sweep Algorithm 278,600 263,375 572,075 790,300 802,900 802,900
543,375 775,075 740,250 802,900
DISCUSSION The results presented in the previous section are obtained assuming that demand at nodes is known. In order to fit the algorithm, the demand is also assumed as belongs to node but not to link. It is shown that the Sweep algorithm may be implemented to vehicle routing for public transport. It is a fact that Sweep algorithm has not contributed a significant improvement in generating public bus routes except in shortening distance of the current routes maintained by the company. However, the result proves that the algorithm is capable of searching the shortest route.
62
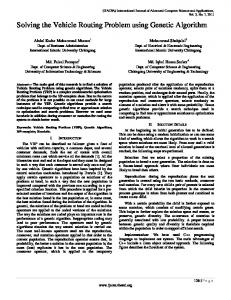
There are two comparisons that we can learn from the experiment. The first one is the comparison of current routes and the routes resulted by Sweep algorithm. As stated previously, the routes obtained by Sweep algorithm are better in which route distance is more than 34% shorter than the current routes. The second is the comparison between forward and backward sweep algorithm as presented in Figure 4. In general, a forward sweep algorithm contributes a slightly better performance of selecting routes. It is clearly shown that the value of daily revenue of routes obtained by the forward sweep also is slightly greater than that of routes obtained by the backward sweep algorithm. Daily Ravenna 900,000
j-*-Defiy Revenue Fomeri Sweep : : 3 Oafly Revenue Beckward Swwp ]
FIGURE 4. Forward and Backward Sweep Algorithm Both sweep methods show an extreme change of revenue for constraint less than 400. When the constraint is greater than 400 the revenue changes of forward and backward sweep move to different pattern. When the capacity constraint is less than 400, the Sweep Algorithm obtains several routes which have short distance. In constraint of 200, for instance, Route 3 consists of one link only as seen on Table 4. The demand is not valid for Route 3 because a very short route does not satisfy public requirement. Therefore, Route 3 does not contribute revenue and, as a result, the daily revenue is low. On the other hand, when the capacity constraint is greater than or equals to 400, the Sweep Algorithm generates fewer routes which have longer distance where 63
more demands are satisfied. There is a slight difference of revenue for forward and backward sweep in constraint of 500 and 600. This difference occurs because both sweep methods obtain similar routes. The revenue in forward sweep remains stable while the revenue in backward sweep, on the other hand, decreases when constraint equals to 500 and then rises back in constraint of 600. The routes obtained by forward sweep have the same links as that obtained by backward sweep in constraint of 600. The graph indicates that in case of public bus routing problem, forward sweep is better to be implemented in generating routes rather than backward sweep. CONCLUSION
Sweep algorithm used in generating public bus routes in this paper is capable of obtaining routes that are shorter than the actual routes maintained by the company. The routes are generated based on the daily revenue at nodes. The best result of the experiment which can be maintained by the company is the one that consists of two routes with constraint 600. In this level of constraint, both forward and backward sweeps generate two similar routes that have exactly the same links with different order. This paper also shows that forward sweep contributes better result than backward sweep in the case of public bus routing problem. REFERENCES
GUlert, B.E. & Miller, L.R. 1974. A heuristic algorithm for the vehicle dispatch problem. Operation Research, vol. 22: 340-349. Rosenkrantz, D.J., Steams, R.E. & Lewis II, P.M. 1977. An analysis of several heuristics for the traveling salesman problem. SIAM Journal Comput, vol. 6(3). D. Teodorovic, & G. Pavkovic.1996. The Fuzzy Set Theory Approach to the Vehicle Routing Problem when Demand at Nodes is Uncertain. Fuzzy Sets and Systems, vol. 82: 307-317, 1996. Mosheiov, G. 1994. The traveling salesman problem with pick-up and delivery. European Journal of Operational Research, vol. 79: 299-310, Forbes, M.A., Holt, J.N. & Watts, A. M. 1994. An Exact Algorithm for Multiple Depot Bus Scheduling. European Journal of Operational Research, vol. 72:115124. Forbes, M.A. [et al] 1994. BUDI: A Software System for Bus Dispatching. Journal of Operational Research Society, vol. 45(5): 497-508. Bellmore, M. & Nemhauser, G. 1968. The traveling salesman problem: A survey. Operations Research, vol. 16(3): 538-558.
Gunadi W. Nurcahyo, Rose Alinda Alias, Siti Mariyam Shamsuddin & Mohd. Noor Md. Sap Faculty of Computer Science and Information System University Technology of Malaysia 81310 UTM, Skudai, Johor, Malaysia. 64