PHYSICAL REVIEW E 72, 016211 共2005兲
Synchronized clusters in coupled map networks. I. Numerical studies 1
Sarika Jalan,1,* R. E. Amritkar,1,† and Chin-Kun Hu2,‡
Physical Research Laboratory, Navrangpura, Ahmedabad 380 009, India 2 Institute of Physics, Academia Sinica, Nankang, Taipei 11529, Taiwan 共Received 16 June 2004; published 19 July 2005; corrected 26 July 2005兲 We study the synchronization of coupled maps on a variety of networks including regular one- and twodimensional networks, scale-free networks, small world networks, tree networks, and random networks. For small coupling strengths nodes show turbulent behavior but form phase synchronized clusters as coupling increases. When nodes show synchronized behavior, we observe two interesting phenomena. First, there are some nodes of the floating type that show intermittent behavior between getting attached to some clusters and evolving independently. Second, we identify two different ways of cluster formation, namely self-organized clusters which have mostly intracluster couplings and driven clusters which have mostly intercluster couplings. The synchronized clusters may be of dominant self-organized type, dominant driven type, or mixed type depending on the type of network and the parameters of the dynamics. We define different states of the coupled dynamics by considering the number and type of synchronized clusters. For the local dynamics governed by the logistic map we study the phase diagram in the plane of the coupling constant 共⑀兲 and the logistic map parameter 共兲. For large coupling strengths and nonlinear coupling we find that the scale-free networks and the Caley tree networks lead to better cluster formation than the other types of networks with the same average connectivity. For most of our study we use the number of connections of the order of the number of nodes. As the number of connections increases the number of nodes forming clusters and the size of the clusters in general increase. DOI: 10.1103/PhysRevE.72.016211
PACS number共s兲: 05.45.Ra, 05.45.Xt, 89.75.Fb, 89.75.Hc
I. INTRODUCTION
Several complex systems have underlying structures that are described by networks or graphs and the study of such networks is emerging as one of the rapidly growing subjects 关1,2兴. One significant discovery in the field of complex networks is the observation that a number of naturally occurring large and complex networks come under some universal classes and they can be simulated with simple mathematical models, viz. small-world networks 关3兴, scale-free networks 关4兴, etc. These models are based on simple physical considerations and they give simple algorithms to generate graphs which resemble several actual networks found in many diverse systems such as the nervous systems 关5兴, social groups 关6兴, World Wide Web 关7兴, metabolic networks 关8兴, food webs 关9兴, and citation networks 关10兴. Several networks in the real world consist of dynamical elements interacting with each other and the interactions define the links of the network. Several of these networks have a large number of degrees of freedom and it is important to understand their dynamical behavior. Here, we study synchronization and cluster formation in networks consisting of interacting dynamical elements. Synchronization and cluster formation lead to rich spatiotemporal patterns when opposing tendencies, i.e., the nonlinear dynamics of the maps that in the chaotic regime tends to separate the orbits of different elements, and the couplings
*Email address:
[email protected] †
Email address:
[email protected] Email address:
[email protected]
‡
1539-3755/2005/72共1兲/016211共15兲/$23.00
that tend to synchronize them, compete. There are several studies on coupled maps/oscillators on regular lattices as well as globally coupled networks. Coupled map lattices with nearest neighbor or short range interactions show interesting spatiotemporal patterns and intermittent behavior 关11,12兴. Globally coupled maps 共GCM兲 where each node is connected with all other nodes, show interesting synchronized behavior 关13兴. Formation of clusters or coherent behavior and then loss of coherence are described analytically as well as numerically with different viewpoints 关14–19兴. Chaotic coupled map lattices show beautiful phase ordering of nodes 关20兴. There are also some studies of coupled maps on different types of networks. References 关21–23兴 shed some light on the collective behavior of coupled maps/ oscillators with local and nonlocal connections. Random networks having a large number of connections also show synchronized behavior for large coupling strengths 关24–26兴. There are some studies on synchronization of coupled maps on Caley tree 关27兴, small-world networks 关28–30兴, and hierarchal organization 关31兴. Coupled map lattice with sine-circle map gives synchronization plateaus 关32兴. The analytical stability condition for synchronization of coupled maps for different types of linear and nonlinear couplings are also discussed in several papers 关33–36兴. Synchronization and partial synchronization of two coupled logistic maps are discussed at length in Ref. 关37兴. Apart from this there are other studies that explore different properties of coupled maps 关38–42兴. Coupled maps have been found to be useful in several practical situations. These include fluid dynamics 关43兴, hydrodynamic turbulence 关44兴, nonstatistical behavior in optical systems 关45兴, convection 关46,47兴, stock markets 关48兴, ecological systems 关49兴, logic gates 关50兴, solitons 关51兴,
016211-1
©2005 The American Physical Society
PHYSICAL REVIEW E 72, 016211 共2005兲
JALAN, AMRITKAR, AND HU
c-elegans 关52兴, cosmology 关53兴, and quantum field theories 关54兴. Here we study the detailed dynamics of coupled maps on different networks and investigate the mechanism of cluster formation and synchronization properties. We explore the evolution of individual nodes with time and study the role of different connections in forming the clusters of synchronized nodes in such coupled map networks 共CMNs兲. Most of the earlier studies of synchronized cluster formation have focused on networks with a large number of connections 共⬃N2兲. In this paper, we consider networks with a number of connections of the order of N. This small number of connections allows us to study the role that different connections play in synchronizing different nodes and the mechanism of synchronized cluster formation. The study reveals two interesting phenomena. First, when nodes form synchronized clusters, there can be some nodes which show an intermittent behavior between independent evolution and evolution synchronized with some cluster. Second, the cluster formation can be in two different ways, driven and selforganized phase synchronization 关55兴. The connections or couplings in the self-organized phase synchronized clusters are mostly of the intracluster type while those in the driven phase synchronized clusters are mostly of the intercluster type. As the number of connections increases more and more nodes are involved in cluster formation and also the coupling strength region where clusters are formed increases in size. For a large number of connections, typically of the order of N2 and for large coupling strengths, mostly one phase synchronized cluster spanning all the nodes is observed. Depending on the number and type of clusters we define different states of synchronized behavior. For the local dynamics governed by the logistic map, we study the phase diagram in the − ⑀ plane, i.e., the plane defined by the logistic map parameter and the coupling constant. The paper is organized as follows. In Sec. II, we give the model for our coupled map networks. We also define phase synchronization and synchronized clusters. Some general properties of synchronized clusters in CMNs are discussed in Sec. III. In Sec. IV, we present our numerical results for synchronization in different networks and illustrate the mechanism of cluster formation. This section includes the study of the phase diagram, Lyapunov exponent plots, behavior of individual nodes, floating nodes, dependence on number of connections, and behavior for different types of networks. Section V considers the circle map. Section VI concludes the paper. II. COUPLED MAPS AND SYNCHRONIZED CLUSTERS A. Model of a coupled map network (CMN)
Consider a network of N nodes and Nc connections 共or couplings兲 between the nodes. Let each node of the network be assigned a dynamical variable xi , i = 1 , 2 , . . . , N. The evolution of the dynamical variables is written as
is introduced though the adjacency matrix C with elements Cij taking values 1 or 0 depending upon whether i and j are connected or not. C is a symmetric matrix with diagonal elements zero and ki = 兺Cij is the degree of node i. The factors 共1 − ⑀兲 in the first term and ki in the second term are introduced for normalization. The function f共x兲 defines the local nonlinear map and the function g共x兲 defines the nature of coupling between the nodes. Here, we present detailed results for the logistic map, f共x兲 = x共1 − x兲
governing the local dynamics. We have also considered some other maps for the local dynamics. We have studied different types of linear and nonlinear coupling functions and here discuss the results for the following two types of coupling functions. g共x兲 = x,
共3a兲
g共x兲 = f共x兲.
共3b兲
We refer to the first type of coupling function as linear and the later as nonlinear. Note that the nonlinear coupling function 关Eq. 共3b兲兴 is equivalent to a diffusive type of coupling with the diffusion being equally likely along all the connections from any given node. B. Phase synchronization and synchronized clusters
Synchronization of coupled dynamical systems 关56–58兴 is manifested by the appearance of some relation between the functionals of different dynamical variables. The exact synchronization corresponds to the situation where the dynamical variables for different nodes have identical values. The phase synchronization corresponds to the situation where the dynamical variables for different nodes have some definite relation between their phases 关59–62兴. When the number of connections in the network is small 共NC ⬃ N兲 and when the local dynamics of the nodes 关i.e., function f共x兲兴 is in the chaotic zone, and we look at exact synchronization, we find that only a few synchronized clusters with a small number of nodes are formed. However, when we look at phase synchronization, synchronized clusters with a larger number of nodes are obtained. Hence in our numerical study we concentrate on phase synchronization. We define phase synchronization as follows 关63兴. Let i and j denote the number of times the dynamical variables xit and xtj, t = t0 , t0 + 1 , 2 , . . . , t0 + T − 1, for the nodes i and j show local minima during the time interval T starting from some time t0. Here the local minimum of xit at time t is i i and xit ⬍ xt+1 . Let ij denote defined by the conditions xit ⬍ xt−1 the number of times these local minima match with each other, i.e., occur at the same time. We define the phase distance, dij, between the nodes i and j by the following relation 关64兴:
N
i = 共1 − ⑀兲f共xit兲 + xt+1
⑀ 兺 Cijg共xtj兲, ki j=1
共1兲
where xit is the dynamical variable of the ith node at time t and ⑀ is the coupling constant. The topology of the network
共2兲
dij = 1 −
ij . max共i, j兲
共4兲
Clearly, dij = d ji. Also, dij = 0 when all the minima of variables xi and x j match with each other and dij = 1 when none of the
016211-2
PHYSICAL REVIEW E 72, 016211 共2005兲
SYNCHRONIZED CLUSTERS IN… . I .…
minima match. In the Appendix, we show that the above definition of phase distance satisfies metric properties. We say that the nodes i and j are phase synchronized if dij = 0, and we define a phase synchronized cluster as a cluster of nodes in which all the pairs of nodes are phase synchronized. In the subsequent discussion the word “phase” is omitted when the meaning is clear. III. GENERAL PROPERTIES OF SYNCHRONIZED DYNAMICS
We consider some general properties of synchronized dynamics. They are valid for any coupled discrete and continuous dynamical systems. Also, these properties are applicable for exact as well as phase synchronization and are independent of the type of network.
connections. Clearly, this splitting is not unique and will lead to self-organized clusters. 共b兲 A tree can also be divided into two clusters by putting connected nodes into different clusters. This division is unique and leads to two clusters with only intercluster couplings, i.e., driven clusters. 共c兲 Several other ways of splitting a tree are possible. For example, it is easy to see that a tree can be broken into three clusters of the driven type. Quantitative measure for self-organized and driven behavior. To get a clear picture of self-organized and driven behavior we define two quantities f intra and f inter as measures for the intracluster and intercluster couplings as follows:
A. Behavior of individual nodes
As the network evolves, it splits into several synchronized clusters. Depending on their asymptotic dynamical behavior the nodes of the network can be divided into three types. 共a兲 Cluster nodes: A node of this type synchronizes with other nodes and forms a synchronized cluster. Once this node enters a synchronized cluster it remains in that cluster afterwards. 共b兲 Isolated nodes: A node of this type does not synchronize with any other node and remains isolated all the time. 共c兲 Floating nodes: A node of this type keeps on switching intermittently between an independent evolution and a synchronized evolution attached to some cluster. Of particular interest are the floating nodes and we will discuss some of their properties afterwards. B. Mechanism of cluster formation
The study of the relation between the synchronized clusters and the couplings between the nodes represented by the adjacency matrix C shows two different mechanisms of cluster formation 关55兴. 共i兲 Self-organized clusters: The nodes of a cluster can be synchronized because of intracluster couplings 关see, e.g., Fig. 3共b兲兴. We refer to this as the self-organized synchronization and the corresponding synchronized clusters as selforganized clusters. 共ii兲 Driven clusters: The nodes of a cluster can be synchronized because of intercluster couplings 关see, e.g., Fig. 3共d兲兴. Here the nodes of one cluster are driven by those of the others. We refer to this as the driven synchronization and the corresponding clusters as driven clusters. In our numerical studies we have been able to identify ideal clusters of both types, as well as clusters of the mixed type where both ways of synchronization contribute to cluster formation. We will discuss several examples to illustrate both types of clusters. Geometrically the two mechanisms of cluster formation can be easily understood by considering a tree type network. A tree can be broken into different clusters in different ways. 共a兲 A tree can be broken into two or more disjoint clusters with only intracluster couplings by breaking one or more
f intra =
Nintra , Nc
共5a兲
f inter =
Ninter , Nc
共5b兲
where Nintra and Ninter are the numbers of intra- and intercluster couplings, respectively. In Ninter, couplings between two isolated nodes are not included. The quantities f intra and f inter allow us to determine the dominant behavior when there are several clusters and it is not easy to identify the main mechanism of cluster formation. C. States of synchronized dynamics
Normally, the states of coupled dynamical systems are classified on the basis of the number of clusters as in Ref. 关65兴. Our finding of two mechanisms of cluster formation allow us to refine this classification. 共a兲 Turbulent state 共I-T兲: All nodes behave chaotically with no cluster formation. 共b兲 Partially ordered state 共III兲: Nodes form a few clusters with some isolated nodes not attached to any cluster. We can further subdivide the clusters of the partially ordered state into subcategories depending on the type of clusters, i.e., self-organized 共S兲, driven 共D兲, or mixed type 共M兲. 共c兲 Ordered state 共IV兲: Nodes form two or more clusters with no isolated nodes. The ordered state can be further divided into three substates based on the nature of dynamics of the synchronized clusters as chaotic ordered state 共C兲, quasiperiodic ordered state 共Q兲, and periodic ordered state 共P兲. Also, as for the partially ordered state we can have subcategories as self-organized 共S兲, driven 共D兲, or mixed type 共M兲. 共d兲 Coherent state 共V兲: Nodes form a single synchronized cluster. The dynamical behavior is usually periodic 共P兲 or of a fixed point 共F兲. 共e兲 Variable state 共II兲: Nodes form different states, partially ordered or ordered state depending on the initial conditions. IV. NUMERICAL RESULTS
Now we present the numerical results for the CMNs on different types of networks. The adjacency matrix C depends on the type of network and Cij = 1 if the corresponding nodes in the network are connected and zero otherwise. Starting
016211-3
PHYSICAL REVIEW E 72, 016211 共2005兲
JALAN, AMRITKAR, AND HU
from random initial conditions the dynamics of Eq. 共1兲, after an initial transient, leads to interesting phase synchronized behavior. A. Coupled maps on scale-free network
First we present a detailed discussion of our numerical results for the scale-free network. Other types of networks will be discussed briefly indicating the similarities and differences in the behavior. 1. Generation of network
The scale-free network of N nodes is generated by using the model of Barabasi et al. 关66兴. Starting with a small number, m0, of nodes, a new node with m 艋 m0 connections is added at each time step. The probability 共ki兲 that a connection starting from this new node is connected to a node i depends on the degree ki of node i 共preferential attachment兲 and is given by
共ki兲 =
共ki + 1兲
兺 j 共k j + 1兲
.
After time steps the model leads to a network with N = + m0 nodes and m connections. This model leads to a scalefree network, i.e., the probability P共k兲 that a node has degree k decays as a power law, P共k兲 ⬃ k– , where is a constant and for the type of probability law 共k兲 that we have used = 3. Other forms for the probability 共k兲 are possible which give different values of . We have tried out a few more forms of 共k兲 giving different values of and we find results similar to the ones reported here. This indicates that the exact form of 共k兲 is probably not important for the properties that we have studied. 2. Linear coupling
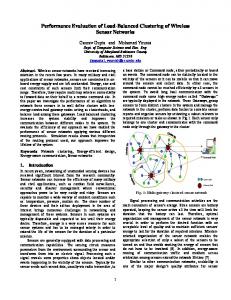
Phase diagram. First we consider the linear coupling, g共x兲 = x. Figure 1 shows the phase diagram in the two parameter space defined by and ⑀ for the scale-free network with m = m0 = 1, N = 50, and T = 100. For m = 1, the network has a tree structure. The behavior for larger m values will be discussed afterwards. The different regions of the phase diagram are labeled as explained in the Sec. III C. For ⬍ 3, we get a stable coherent region 共region V-F兲 with all nodes having the fixed point value. To understand the remaining phase diagram, consider the line = 4. Figure 2 shows the largest Lyapunov exponent as a function of the coupling strength ⑀ for = 4. For small values of ⑀, we observe turbulent behavior with all nodes evolving chaotically and there is no phase synchronization 共region I-T兲. Figure 3 shows nodenode plots of the synchronized clusters with any two nodes belonging to the same cluster shown as open circles and the couplings between the nodes 共Cij = 1兲 shown as closed circles. Turbulent behavior with no synchronization is shown in Fig. 3共a兲. There is a critical value of the coupling strength ⑀c beyond which synchronized clusters can be observed. This
FIG. 1. Phase diagram showing different regions in the two parameter space of and ⑀ for the scale-free network for f共x兲 = x共1 − x兲 and g共x兲 = x. Different regions are I: turbulent region, II: region with varying behavior, III: partially ordered region, IV: ordered region, and V: coherent region. The symbols T, S, M, D, P, Q, and F, respectively, correspond to turbulent behavior, self-organized synchronization, mixed synchronization, driven synchronization, periodic, quasiperiodic, and fixed point behavior. Region boundaries are determined based on the asymptotic behavior using several initial conditions, number of clusters and isolated nodes, synchronization behavior, and also the behavior of the largest Lyapunov exponent. The dashed lines indicate uncertainties in determining the boundaries. Calculations are for N = 50, m = 1, and T = 100. The inset shows the phase diagram for the entire range of parameter , i.e., from 0 to 4.
is a general property of all CMNs and the exact value of ⑀c depends on the type of network, the type of coupling function, and the parameter . As ⑀ increases beyond ⑀c, we get into a variable region 共region II-S兲 which shows a variety of phase synchronized behavior, namely ordered chaotic, ordered quasiperiodic, ordered periodic, and partially ordered behavior depending on
FIG. 2. Largest Lyapunov exponent, , is plotted as a function of ⑀ for the scale-free network and f共x兲 = 4x共1 − x兲 and g共x兲 = x. Different regions are labeled as in Fig. 1.
016211-4
PHYSICAL REVIEW E 72, 016211 共2005兲
SYNCHRONIZED CLUSTERS IN… . I .…
FIG. 3. The figure shows node vs node diagrams for several examples illustrating the selforganized and driven phase synchronization and the variety of clusters that are formed. After an initial transient 共about 2000 iterates兲 phase synchronized clusters are studied for T = 100. The examples are for a scale-free network with N = Nc + 1 = 50 and the logistic map parameter = 4 and the coupling function g共x兲 = x. The closed circles show that the two corresponding nodes are coupled 共i.e., Cij = 1兲 and the open circles show that the corresponding nodes are phase synchronized. In each case the node numbers are reorganized so that nodes belonging to the same cluster are numbered consecutively and the clusters get displayed in decreasing sizes. 共a兲 Turbulent phase for ⑀ = 0.10. 共b兲 An ideal self-organized phase synchronization for ⑀ = 0.16. 共c兲 Mixed behavior for ⑀ = 0.32. 共d兲 An ideal driven phase synchronization for ⑀ = 0.90. The scale-free networks were generated with N0 = 1 and m = 1.
the initial conditions. The mechanism of cluster formation is of dominant self-organized type. In the middle of region II-S, we can observe ideal self-organized behavior with two clusters 关Fig. 3共b兲兴 关67兴. The next region 共region III-M兲 shows partially ordered chaotic behavior. Here, the number of clusters as well as the number of nodes in the clusters depend on the initial conditions and also they change with time. There are several isolated nodes not belonging to any cluster and floating nodes which keep on switching intermittently between an independent evolution and a phase synchronized evolution attached to some cluster. The synchronized clusters are of the mixed type where both mechanisms of cluster formation contribute and intracluster and intercluster connections are almost equal in number 关Fig. 3共c兲兴. The last two regions 共IV-DQ and IV-DP兲 are ordered quasiperiodic and ordered periodic regions showing driven synchronization. In these regions, the network always splits into two clusters. The two clusters are perfectly antiphase synchronized with each other, i.e., when the nodes belonging to one cluster show minima those belonging to the other cluster show maxima. Figure 3共d兲 shows the node-node plot of ideal driven synchronization obtained in the middle of region IV-DP 关67兴. The phenomena of driven synchronization in this region is a very robust one in the sense that it is obtained for almost all initial conditions, the transient time is very small, the nodes belonging to the two clusters are uniquely determined, and we get a stable solution. We note that region III-M acts as a crossover region from the self-organized to the driven behavior. Here, the clusters are of the mixed type and there is a competition between the self-organized and driven behavior. This appears to be the
reason for the formation of several clusters and floating nodes as well as the sensitivity of these to the initial conditions. Figure 4 shows the plot of f intra and f inter 关Eq. 共5b兲兴 as a function of the coupling strength ⑀. The figure gives a clear picture of the different features of the phase diagram discussed above. It shows that for small coupling strength 共turbulent region I-T兲 both f intra and f inter are zero indicating that there is no cluster formation. In region II-S, we get f intra
FIG. 4. The fraction of intracluster and intercluster couplings, f inter 共closed circles兲 and f intra 共open circle兲, is shown as a function of the coupling strength ⑀ for the scale-free networks with f共x兲 = 4x共1 − x兲 and g共x兲 = x. 共The lines connect the points and are drawn as a guide to the eye.兲 The figure is obtained by averaging over 20 realizations of the network and 50 random initial conditions for each realization.
016211-5
PHYSICAL REVIEW E 72, 016211 共2005兲
JALAN, AMRITKAR, AND HU
FIG. 5. 共a兲 The time evolution of nodes in a cluster for a scale-free network with both cluster nodes and floating nodes. The nodes belonging to the cluster are shown by closed circles. Here, ⑀ = 0.4, f共x兲 = x共1 − x兲, and g共x兲 = x. Node numbers 12, 24, 38, and 50 are of the floating type. They spend some time intermittently in a synchronized evolution with the given cluster and the remaining time in either a synchronized evolution with other clusters or in an independent evolution as an isolated node. 共b兲 Figure shows two stationary clusters of self-organized type for ⑀ = 0.19 and g共x兲 = x. The two clusters are for the same ⑀ value but obtained from two different initial conditions and are denoted by open circles and crosses. Note that some nodes are common to both the clusters while some are different. This illustrates the nonuniqueness of nodes belonging to self-organized clusters depending on the initial conditions.
⬃ 1 at ⑀ ⬃ 0.2 showing that there are only intracluster couplings leading to self-organized clusters. As coupling strength increases further f intra decreases and f inter increases, i.e., there is a crossover from self-organized to driven behavior 共regions III-M兲. Finally, in regions IV-DQ and IV-DP, we find that f inter is large which shows that in this region most of the connections are of the intercluster type. In region IV-DP we get f inter almost one corresponding to an ideal driven synchronized behavior. Behavior of individual nodes forming clusters. Now we explore the time evolution of individual nodes. Figure 5共a兲 shows nodes belonging to one of the synchronized clusters as a function of time for ⑀ = 0.4 共region III-M兲 where the symbols 共closed circles兲 indicate the time for which a given node belongs to that cluster. We observe that there are some nodes which intermittently leave the cluster, evolve independently, or get attached with some other cluster and after some time again come back to the same cluster, e.g., the nodes 12 and 24 in Fig. 5共a兲. These are the floating nodes discussed in Sec. III A. Note that the node 12 spends about 90% of its time in phase synchronization with the given cluster while for the node 24 this time is about 10%. Let denote the residence time of a floating node in a cluster 共i.e., the continuous time interval that the node is in a cluster兲. Figure 6 plots the frequency of residence time 共兲 of a floating node as a function of the residence time . A good straight line fit on a log-linear plot shows an exponential dependence,
共兲 ⬃ exp共− /r兲,
共6兲
where r is the typical residence time for a given node. We have also studied the distribution of the time intervals for which a floating node is not synchronized with a given cluster. This also shows an exponential distribution. Figure 5共b兲 demonstrates the nonuniqueness of the selforganized clusters. The figure shows a set of nodes 共crosses兲
FIG. 6. The figure plots the frequency of residence time 共兲 of a floating node in a cluster as a function of the residence time . The data is for the node No. 12 in Fig. 5共a兲. A good straight line fit on log-linear plot shows exponential dependence.
016211-6
PHYSICAL REVIEW E 72, 016211 共2005兲
SYNCHRONIZED CLUSTERS IN… . I .…
FIG. 7. Phase diagram in the two parameter space of and ⑀ for the scale-free network for f共x兲 = x共1 − x兲 and g共x兲 = f共x兲. The determination of region boundaries and their classification and symbols are as explained in Fig. 1. Calculations are for N = 50, m = 1, and T = 100. The inset shows the phase diagram for the entire range of parameter , i.e., from 0 to 4.
FIG. 8. Largest Lyapunov exponent, , is plotted as a function of ⑀ for a scale-free network with f共x兲 = 4x共1 − x兲 and g共x兲 = f共x兲. Different regions are labeled as in Fig. 7.
3. Nonlinear coupling
In region III-T, we get almost turbulent behavior with very few nodes forming synchronized clusters. Regions III-M and III-D are partially ordered chaotic regions. In these regions some nodes form clusters and several nodes are isolated or of the floating type. In region III-M, the clusters are of the mixed type 共both inter- and intra-cluster couplings兲 while in region III-D the clusters are of the dominant driven type 共see Fig. 9兲. In these regions, we get phase synchronized clusters but both the size of clusters as well as the number of nodes forming clusters are small. Figures 10共b兲 and 10共c兲 are node-node plots demonstrating typical cluster formation in regions III-M and III-D, respectively. It is interesting to note that for the scale-free network and for the nonlinear coupling, the largest Lyapunov exponent is always positive 共Fig. 8兲, i.e., the whole system remains chaotic but we get phase-synchronized behavior. We have found significant differences in the synchronization properties for the linearly and nonlinearly coupled maps.
Now we discuss the results for the nonlinear coupling of the type g共x兲 = f共x兲. As noted earlier this is equivalent to a diffusive type of coupling. The phase space diagram in the − ⑀ plane is plotted in Fig. 7. Here we do not get clear and distinct regions as we get for the g共x兲 = x form of coupling. For ⬍ 3.5, we get coherent behavior 共regions V-P and VIF兲. To describe the remaining phase diagram consider the = 4 line. Figures 8 and 9 show, respectively, the largest Lyapunov exponent and f intra and f inter as a function of the coupling strength ⑀ for = 4. For small coupling strengths no cluster is formed and we get the turbulent region 共I-T兲. As the coupling strength increases we get into the variable region 共II-D兲. In this region we get a partially ordered and ordered chaotic phase depending on the initial conditions and the clusters of dominant driven type. In a small portion in the middle of region II-D, all nodes form two ideal driven clusters. These two clusters are perfectly antiphase synchronized with each other. Interestingly the dynamics still remains chaotic. Figure 10共a兲共a兲 shows the node-node plot as in Fig. 3 demonstrating ideal driven clusters in the middle of region II-D.
FIG. 9. The fraction of intracluster and intercluster couplings, f inter 共closed circles兲 and f intra 共open circles兲, is shown as a function of the coupling strength ⑀ for the scale-free networks with g共x兲 = f共x兲. The figure is obtained by averaging over 20 realizations of the network and 50 random initial conditions for each realization.
belonging to a cluster for ⑀ = 0.19 共region II-S兲 and another set of nodes 共open circles兲 belonging to another cluster for the same ⑀ but obtained with different initial conditions. For this ⑀ value the nodes form self-organized clusters with no isolated nodes. Comparing the members of the two clusters which are obtained from different initial conditions we see that there are some common nodes while some are different. This demonstrates that the splitting of nodes into selforganized clusters is not unique 共see Sec. III B兲. On the other hand, driven synchronization 共region IV-DP兲 mostly leads to a unique cluster formation and does not depend on the initial conditions.
016211-7
PHYSICAL REVIEW E 72, 016211 共2005兲
JALAN, AMRITKAR, AND HU
of the order of the number of nodes 共Nc = N − 1兲. As m increases the number of connections increases. For m ⬎ 1 and g共x兲 = x the dynamics of Eq. 共1兲 leads to a similar phase diagram as in Fig. 1 with region II-S dominated by self-organized synchronization and regions IV-DQ and IV-DP dominated by driven synchronization. Though perfect inter- and intra-cluster couplings between the nodes as displayed in Figs. 3共b兲 and 3共d兲 are no longer observed, clustering in the region II-S is such that most of the couplings are of the intracluster type while for the regions IV-DQ and IV-DP they are of the intercluster type. As m increases the regions I and II are mostly unaffected, but the region IV shrinks and the region III grows in size. Figure 11共a兲 is a node-node plot for m = 3 in region II-S 共⑀ = 0.19兲 showing two clusters. It is clear that synchronization of nodes is mainly because of intracluster connections but there are a few intercluster connections also. Figure 11共b兲 is a node-node plot for the ordered periodic region at coupling strength ⑀ = 0.78. Here the clusters are mainly of the driven type but they have intracluster connections also. Note that for Figs. 11共a兲 and 11共b兲 the average degree of a node is 6, and breaking the network into clusters with only intercluster or intracluster couplings is not possible. As the average degree of a node increases further and the number of connections become of the order of N2, self-organized behavior starts dominating and for large values of ⑀ we get one big synchronized cluster. For m ⬎ 1 and g共x兲 = f共x兲 we get a similar kind of behavior as for m = 1 共Fig. 7兲 with dominant driven clusters for most of the coupling strength region, but we do not get any ideal driven clusters. Figure 11共c兲 is a node-node plot for coupling strength ⑀ = 0.9 and m = 3. As m increases the region I showing turbulent behavior remains unaffected, but the region II grows in size while the region III shrinks. As m increases more and more nodes participate in cluster formation. The driven behavior decreases in strength with increasing m and self-organized behavior increases in strength. For m = 10, all nodes form one cluster for larger ⑀ values which is obviously of the self-organized type 关Fig. 11共d兲兴. We have also studied the effect of size of the network on the synchronized cluster formation. The phenomena of selforganized and driven behavior persists for the largest size network that we have studied 共N = 1000兲. The region II showing self-organized or driven behavior is mostly unaffected while the ordered regions showing driven behavior for large coupling strengths show a small shrinking in size. FIG. 10. Examples illustrating the phase synchronization for a scale-free network with coupling form g共x兲 = f共x兲 using node vs node diagram for a scale-free network as in Fig. 3. 共a兲 An ideal driven phase synchronization for ⑀ = 0.13. 共b兲 Mixed behavior for ⑀ = 0.71. 共c兲 A dominant driven behavior for ⑀ = 0.88.
Differences in the behavior of linearly and nonlinearly coupled maps have been noted before in connection with other properties 关68兴. 4. Dependence on the number of connections
So far we have treated the scale-free network with m = 1 which gives a tree structure and the number of connections is
B. Coupled maps on different networks
We now consider several other networks and investigate synchronization properties of these networks. 1. One-dimensional networks
For one-dimensional CMN, each node is connected with m nearest neighbors 共degree per node is 2m兲. First we consider m = 1, i.e., each map is connected with just next neighbors on both sides and we take the open boundary condition. Note that this a tree structure with Nc = N − 1. Figures 12共a兲 and 12共b兲 show f intra and f inter versus ⑀ for = 4, N = 50, and,
016211-8
PHYSICAL REVIEW E 72, 016211 共2005兲
SYNCHRONIZED CLUSTERS IN… . I .…
FIG. 11. The cluster formation for the scalefree network as node vs node plot for N = 50 as in Fig. 3 but with a larger number of connections. 共a兲 and 共b兲 are plotted for g共x兲 = x and m = 3 and, respectively, for ⑀ = 0.19 and ⑀ = 0.78. 共c兲 and 共d兲 are plotted for g共x兲 = f共x兲, ⑀ = 0.90 and, respectively, for m = 3 and m = 10.
respectively, for g共x兲 = x and g共x兲 = f共x兲. For g共x兲 = x, the behavior of clusters as well as the phase diagram and Lyapunov exponent graph are very similar to the scale-free network with the coupling form f共x兲 = x. However, for g共x兲 = f共x兲 coupling and m = 1 we observe a considerable deviation from the corresponding behavior for the scale-free network. In region I-T of Fig. 7, we get turbulent behavior as for the scale-free network. But we observe clusters only in the region corresponding to the region II-D in Fig. 7. These clusters are of the driven type 关Fig. 12共b兲兴. For the rest of the coupling strength region, i.e., region III in Fig. 7, there is almost no cluster formation and the behavior is close to turbulent and chaotic. Figure 13共a兲 shows a node-node plot of two clusters of the mixed type and several isolated nodes for ⑀ in region III-M for g共x兲 = x. Figure 13共b兲 shows a node-node plot of driven clusters for an ⑀ value in the region II-D for g共x兲 = f共x兲. We now consider the case m ⬎ 1. For g共x兲 = x as m increases, i.e., the number of connections increases, the behavior is similar to that of the scale-free network. For g共x兲 = f共x兲 and m ⬎ 1, we find that as the number of connections increases we get two dominant driven phase synchronized clusters as for m = 1 in region II-D. For large coupling strength the number of nodes forming clusters and the sizes of clusters both increase with the increase in the number of connections. This behavior is seen in Figs. 12共c兲 and 12共d兲 which show f intra and f inter versus ⑀ for g共x兲 = f共x兲, = 4, and, respectively, for m = 5 and m = 10. Figure 14共a兲 shows the fraction of nodes forming clusters as a function of the number of connections Nc normalized with respect to the maximum number of connections Nm = N共N − 1兲 / 2 for two values of ⑀. The overall increase in the number of nodes
forming clusters is clearly seen. Figure 14共b兲 shows the fraction of nodes in the largest cluster as a function Nc for two values of ⑀. The overall growth in the size of the clusters with Nc is evident. Cluster formation with a large number of connections 共of the order of N2兲 and its dependence on the coupling strength is discussed in Refs. 关69,70兴. It is reported that for these networks it is the coupling strength which affects the synchronized clusters and not the number of connections. However, as discussed above, we find that when the number of connections is of the order of N the size of the clusters and the number of nodes forming clusters increase as the number of connections increases. This behavior approaches the reported behavior 关69,70兴 as the number of connections becomes of the order of N2. 2. Small world networks
Small world networks are constructed using the following algorithm by Watts and Strogatz 关3兴. Starting with a onedimension ring lattice of N nodes in which every node is connected to its nearest k neighbors 共k / 2 = m兲, we randomly rewire each connection of the lattice with probability p such that self-loops and multiple connections are excluded. Thus p = 0 gives a regular network and p = 1 gives a random network. The typical small world behavior is observed around p = 0.01. We find that for g共x兲 = x, the synchronization behavior is very similar to that for the scale-free networks and one-dimensional lattice. We note that this result for g共x兲 = x is a general result and appears to be valid for all the networks with the same number of connections. But, for g共x兲 = f共x兲, nodes form clusters only for region II-D of coupling strength and there is almost no cluster formation for larger values of
016211-9
PHYSICAL REVIEW E 72, 016211 共2005兲
JALAN, AMRITKAR, AND HU
FIG. 12. The fraction of intracluster and intercluster couplings, f inter 共closed circles兲 and f intra 共open circles兲, are shown as a function of the coupling strength ⑀. 共a兲 and 共b兲 are for the onedimensional coupled maps with nearest neighbor coupling 共m = 1兲 and for g共x兲 = x and g共x兲 = f共x兲, respectively. 共c兲 and 共d兲 are for g共x兲 = f共x兲 and, respectively, m = 5 and m = 10.
⑀. This trend can be seen from Fig. 15共a兲 where we plot f intra and f inter for g共x兲 = f共x兲 as a function of ⑀ for p = 0.06, = 4, N = 50, and k = 2. As k increases, we observe some clusters for large ⑀ values. This behavior is similar to that of the one-dimensional network. 3. Caley tree
We generate a Caley tree using the algorithm given in Ref. 关27兴. Starting with three branches at the first level, we split each branch into two at subsequent levels. For g共x兲 = x, the synchronization behavior is similar to all other networks with the same number of connections. For g共x兲 = f共x兲 all nodes form driven clusters for region II-D, and for larger coupling strengths about 40% of nodes form clusters of the dominant driven type 关Fig. 15共b兲兴. 4. Higher dimensional lattices
First we consider the two-dimensional square lattice with nearest neighbor interactions. Figures 15共c兲 and 15共d兲 plot f intra and f inter for g共x兲 = x and g共x兲 = f共x兲, respectively, as a function of ⑀ for = 4. For g共x兲 = x the cluster formation is similar to other networks described earlier except for very large ⑀ close to one where we get a single self-organized cluster. For g共x兲 = f共x兲 cluster formation is similar to that in one-dimensional networks with nearest and next nearest neighbor couplings. In small coupling strength region II-D
共see Fig. 7兲, nodes form two clusters of the driven type and for large coupling strength driven clusters are observed with about 25–30% nodes showing synchronized behavior 关Fig. 15共d兲兴. Coupled maps on three-dimensional cubic lattice 共degree per node is six兲 for g共x兲 = x show clusters similar to the other networks discussed earlier. For g共x兲 = f共x兲, nodes form driven clusters in region II-D and mostly we observe three clusters. For large coupling strengths nodes form driven clusters and the nodes participating in cluster formation are now much larger than the two-dimensional case. 5. Random networks
Random networks are constructed by connecting each pair of nodes with probability p. First consider the case where the average degree per node is two. For linear coupling g共x兲 = x cluster formation is the same as for other networks with the same average degree. For g共x兲 = f共x兲 driven clusters are observed in region II-D and no significant cluster formation is observed for larger coupling strengths. This behavior is similar to the one-dimensional network with k = 2 but different from the corresponding behavior for the scalefree network. For coupled maps on random networks with the average degree per node equal to four and g共x兲 = f共x兲, clusters with dominant driven behavior are observed for all ⑀ ⬎ ⑀ c.
016211-10
PHYSICAL REVIEW E 72, 016211 共2005兲
SYNCHRONIZED CLUSTERS IN… . I .…
FIG. 15. 共a兲 The fraction of intracluster and intercluster couplings, f inter 共solid line兲 and f intra 共dashed line兲, is shown as a function of the coupling strength ⑀ for the small world network for g共x兲 = f共x兲, respectively. Small world networks are generated for N = 50, m = 1, and p = 0.06 关3兴. 共b兲 Same plot as in 共a兲 but for the Caley tree with g共x兲 = f共x兲 and N = 47. Caley trees are generated with coordination number three 关27兴. 共c兲 and 共d兲 Same as in 共a兲, but for two-dimensional lattice with N = 49 and, respectively, for g共x兲 = x and g共x兲 = f共x兲. C. Parameter variation FIG. 13. The cluster formation for one-dimensional nearest neighbor network using node-node plot as in Fig. 3. 共a兲 is for g共x兲 = x and ⑀ = 0.30 and 共b兲 is for g共x兲 = f共x兲 and ⑀ = 0.15.
So far we have considered homogeneous coupled systems, i.e., with identical local dynamics. We now consider a situation of coupled systems where the maps are not identical but have some parameter mismatch. We have done some
FIG. 14. 共a兲 The fraction of nodes forming clusters as a function of the fraction of couplings Nc / Nm where Nm = N共N − 1兲 / 2. The figures are plotted for 1-dimensional coupled maps with g共x兲 = f共x兲 and for ⑀ = 0.49 共closed circles兲 and ⑀ = 0.7 共open circles兲. The results are for N = 50 and are obtained by averaging over 100 random initial conditions. 共b兲 The fraction of nodes in the largest cluster as a function of Nc / Nm for ⑀ = 0.49 共closed circles兲 and ⑀ = 0.7 共open circles兲. Other parameters are the same as in 共a兲. 016211-11
PHYSICAL REVIEW E 72, 016211 共2005兲
JALAN, AMRITKAR, AND HU
preliminary calculations of synchronization in such systems. We vary the parameter of the logistic map first with a linear increase
i = 4.0 −
i , N
V. CIRCLE MAP
We have studied the cluster formation with the circle map defining the local dynamics, given by f共x兲 = x + + 共k/2兲sin共2x兲
i = 1, . . . ,N
and secondly with a random distribution in a range 共4.0– ⌬ , 4.0兲. 共For the linear change of in random and other similar networks the ordering of the node indices is arbitrary.兲 For small coupling strength 共region II兲 the driven behavior is somewhat strengthened while for large coupling strength there is not much variation. The region of complete synchronization shows a slight decrease. How does the transition to complete synchronization take place? Opisov et al. 关71兴 have analyzed coupled Rössler and coupled circle maps and found that there are two ways in which transition to complete synchronization takes place: soft and hard. In these studies, the state with no parameter mismatch is always the state of complete synchronization. The soft transition takes place without cluster formation and occurs when the parameter mismatch is smaller while the hard transition takes place through formation of smaller clusters and it occurs when the parameter mismatch is larger. The case of synchronization in complex networks that we are considering is somewhat different. We have cluster formation even when there is no parameter mismatch. However, it is interesting to see how the transitions occur in our case as the coupling strength is varied. Let us first consider the case of a small number of connections 共⬃N兲. As the coupling strength increases we get synchronization around ⑀ = 0.2 共region II兲. This transition is soft, i.e., without clusters. However, the desynchronization for further increase in the coupling strength is a hard transition and several smaller clusters are formed. Again the transition to complete synchronization for large coupling strength is hard. Second, when the number of connections are increased 共⬃N2兲 the self-organized state is favored and in this case the transition to a completely synchronized state is hard.
共mod 1兲.
共7兲
Due to the modulo condition, instead of using the variable xt, we use a function satisfying periodic boundary conditions, e.g., sin共xt兲, to decide the location of maxima and minima which are used to determine the phase synchronization of two nodes 关Eq. 共4兲兴. Here we discuss the results with the parameters of the circle map in the chaotic region 共 = 0.44 and k = 6兲. For linear coupling g共x兲 = x and scale-free networks with m = 1, for small coupling strength nodes evolve chaotically with no cluster formation 共turbulent region兲. As the coupling strength increases nodes form clusters for 0.21⬍ ⑀ ⬍ 0.25. In most of this region the nodes form two dominant driven clusters, except in the initial part, ⑀ ⬇ 0.21, where self-organized clusters can be observed. As the coupling strength increases nodes behave in a turbulent manner and after ⑀ ⬎ 0.60 nodes form clusters of dominant driven type. Here the number of nodes forming clusters and the sizes of clusters, both are small. For the one-dimensional linearly coupled network with m = 1, for linear coupling the nodes form phase synchronized clusters for the coupling strength region 0.21⬍ ⑀ ⬍ 0.25. The clusters are mainly of the driven type except in the initial part, ⑀ ⬇ 0.21, where they are of the self-organized type. For large coupling strength they do not show any cluster formation. For g共x兲 = f共x兲 we found very negligible cluster formation for the entire range of the coupling strength for both scalefree and one-dimensional network with m = 1. However, as m increases the nodes form phase synchronized clusters for ⑀ larger than some critical ⑀c. For the circle map the normalization factor 共1 − ⑀兲 in the first term of Eq. 共1兲 is not necessary and the following modified model can also be considered. N
i = f共xit兲 + xt+1
⑀ 兺 Cijg共xtj兲 ki j=1
共mod 1兲.
共8兲
D. Example
There are several examples of self-organized and driven behavior in naturally occurring systems. An important example in physics that includes both self-organized and driven behavior is the nearest neighbor Ising model treated using Kawasaki dynamics. As the strength of Ising interaction between spins changes sign from positive to negative there is a change of phase from a ferromagnetic 共self-organized兲 to an antiferromagnetic 共driven兲 behavior. In the ferromagnetic phase, domains 共or clusters兲 of spins aligned in the same direction can be observed. In the antiferromagnetic state, i.e., driven behavior, the lattice spits into two sublattices with opposite spin states and having only intercluster interactions and no intracluster interactions. Several other examples are discussed in Ref. 关55兴. Several natural systems show examples of floating nodes, e.g., some birds may show intermittent behavior between free flying and flying in a flock.
We now discuss the synchronized cluster formation for the same parameter values as above 共 = 0.44 and k = 6兲 for this modified model. For linear coupling 关g共x兲 = x兴, clusters are formed only for 0.02⬍ ⑀ ⬍ 0.17 with dominant selforganized behavior for most of the range except near ⑀ ⬇ 0.17 where the behavior is of dominant driven type. For the scale-free networks 共m = 1兲 we have ordered states while for the one-dimensional networks we have partially ordered states. For nonlinear coupling 关g共x兲 = f共x兲兴, the clusters are formed for 0.0⬍ ⑀ ⬍ 0.09. The scale-free networks show mostly mixed clusters while one-dimensional networks show dominant self-organized clusters. There is no cluster formation for larger coupling strengths for both linear and nonlinear coupling. However, as for the logistic map, synchronized clusters are observed for large ⑀ as the number of connections increases.
016211-12
PHYSICAL REVIEW E 72, 016211 共2005兲
SYNCHRONIZED CLUSTERS IN… . I .… VI. CONCLUSION AND DISCUSSION
We have studied the properties of coupled dynamical elements on different types of networks. We find that in the course of time evolution they form phase synchronized clusters. We have mainly studied networks with a small number of connections 共Nc ⬃ N兲 because a large number of natural systems fall under this category of a small number of connections. More importantly, with a small number of connections, it is easy to identify the relation between the dynamical evolution, the cluster formation, and the geometry of networks. We have studied the behavior of individual nodes, either forming clusters or evolving independently, and also the mechanism of cluster formation. In several cases when synchronized clusters are formed there are some isolated nodes which do not belong to any cluster. More interestingly there are some floating nodes which show an intermittent behavior between an independent evolution and an evolution synchronized with some cluster. The residence time spent by a floating node in the synchronized cluster shows an exponential distribution. We have identified two mechanisms of cluster formation, self-organized and driven phase synchronization. By considering the number of inter- and intra-cluster couplings we can identify phase synchronized clusters with dominant selforganized behavior 共S兲, dominant driven behavior 共D兲, and mixed behavior 共M兲 where both mechanisms contribute. We have also observed ideal clusters of both self-organized and driven type. In most cases where ideal behavior is observed, the largest Lyapunov exponent is negative or zero giving stable clusters with periodic evolution. However, in some cases ideal behavior is also observed in the chaotic region. By defining different states of the dynamical system using the number and type of clusters, we consider the phasediagram in the − ⑀ plane for the local dynamics governed by the logistic map. When the local dynamics is in the chaotic region, for small coupling strengths we observe turbulent behavior. There is a critical value ⑀c above which phase synchronized clusters are observed. The critical value depends on the type of network and the coupling function. For g共x兲 = x type of coupling, self-organized clusters are formed when the strength of the coupling is small. As the coupling strength increases there is a crossover from the selforganized to the driven behavior which also involves reorganization of nodes into different clusters. This behavior is almost independent of the type of network. For the nonlinear diffusive coupling of type g共x兲 = f共x兲, for small coupling strength phase synchronized clusters of driven type are formed, but for large coupling strength the number of nodes forming clusters as well as sizes of clusters both are very small and almost negligible for many networks. Only scalefree networks and Caley tree show some cluster formation for large coupling strengths. As the number of connections increases, most of the clusters become of the mixed type where both the mechanisms contribute. We find that in general, the self-organized behavior is strengthened and also the number of nodes forming clusters as well as the size of clusters increase. As the number of connections become of the order of N2, self-organized behavior with a single spanning cluster is observed for ⑀ larger than some value.
It is interesting to consider the dynamical origin of the self-organized and driven phase synchronization and of floating nodes. A clue can be obtained by considering some tailor-made networks such as globally coupled networks and complete bipartite networks. These are considered in Part II 关72兴. ACKNOWLEDGMENTS
This work was partly supported by National Science Council of Taiwan under Grant No. NSC 92-2112-M 001063 and Academia Sinica under Grant No. AS-91-TP-A02. One of us 共R.E.A.兲 would like to thank Physics Division of National Center for Theoretical Sciences at Taipei and Institute of Physics of Academia Sinica for hospitality where the final version of this paper was done. APPENDIX
Here we show that the definition 共4兲 of phase distance dij between two nodes i and j satisfies metric properties. Let Ni denote the set of minima of the variable xit in a time interval T. The phase distance satisfies the following metric properties. 共A兲 dij = d ji. 共B兲 dij 艌 0 and the equality hold only if Ni = N j. 共C兲 Triangle inequality: Consider three nodes i, j, and k. Denoting the number of elements of a set by 兩.兩, let 共1兲 a = 兩Ni 艚 N j 艚 Nk兩. 共2兲 b = 兩Ni 艚 Nk兩 − a. 共3兲 c = 兩N j 艚 Nk兩 − a. 共4兲 d = 兩Ni 艚 N j兩 − a. 共5兲 e = 兩Ni兩 − b − d − a. 共6兲 f = 兩N j兩 − c − d − a. 共7兲 g = 兩Nk兩 − b − c − a. We have nik = a + b, n jk = a + c, nij = a + d, ni = a + b + d + e, nj = a + c + d + f , nk = a + b + c + g. Consider the combination dik + d jk − dij = 1 − X
共A1兲
where X=
n jk nij nik + − . max共ni,nk兲 max共n j,nk兲 max共ni,n j兲
The triangle inequality is proved if X 艋 1. Consider the following three general cases.
016211-13
PHYSICAL REVIEW E 72, 016211 共2005兲
JALAN, AMRITKAR, AND HU
Case a. ni 艋 n j 艋 nk: X=
a+b a+c a+d a+b+c−d + − 艋 艋 1. nk nk nj nk
Case c. nk 艋 ni 艋 n j: 共A2兲
X=
Case b. ni 艋 nk 艋 n j: a+b a+c a+d a+b+c X= + − 艋 艋 1. nk nj nj nk
a+b a+c a+d a+b+c a+b+c + − 艋 艋 艋 1. ni nj nj ni nk 共A4兲
共A3兲
关1兴 S. H. Strogatz, Nature 共London兲 410, 268 共2001兲, and references therein. 关2兴 R. Albert and A. L. Barabäsi, Rev. Mod. Phys. 74, 47 共2002兲, and references therein. 关3兴 D. J. Watts and S. H. Strogatz, Nature 共London兲 393, 440 共1998兲. 关4兴 A.-L. Barabäsi and R. Albert, Science 286, 509 共1999兲. 关5兴 C. Koch and G. Laurent, Science 284, 96 共1999兲. 关6兴 S. Wasserman and K. Faust, Social Network Analysis 共Cambridge University Press, Cambridge, England, 1994兲. 关7兴 R. Albert, H. Jeong, and A.-L. Barabäsi, Nature 共London兲 401, 130 共1999兲; 406, 378 共2000兲. 关8兴 H. Jeong, B. Tomber, R. Albert, Z. N. Oltvai, and A.-L. Barabäsi, Nature 共London兲 407, 651 共2000兲. 关9兴 Richard J. Williams and Nea D. Martinez, Nature 共London兲 404, 180 共2000兲. 关10兴 S. Render, Eur. Phys. J. B 4, 131 共1998兲; M. E. J. Newman, Phys. Rev. E 64, 016131 共2001兲. 关11兴 K. Kaneko, Prog. Theor. Phys. 72, 480 共1984兲. 关12兴 K. Kaneko, Physica D 34, 1 共1989兲, and references therein. 关13兴 K. Kaneko, Phys. Rev. Lett. 65, 1391 共1990兲; Physica D 41, 137 共1990兲; 124, 322 共1998兲. 关14兴 D. H. Zanette and A. S. Mikhailov, Phys. Rev. E 57, 276 共1998兲. 关15兴 N. J. Balmforth, A. Jacobson, and A. Provenzale, Chaos 9, 738 共1999兲. 关16兴 O. Popovych, Y. Maistenko, and E. Mosekilde, Phys. Lett. A 302, 171 共2002兲. 关17兴 G. I. Menon, S. Sinha, and P. Ray, e-print cond-mat/0208243. 关18兴 O. Popovych, A. Pikovsky, and Y. Maistrenko, Physica D 168–169, 106 共2002兲. 关19兴 G. Abramson and D. H. Zanette, Phys. Rev. E 58, 4454 共1998兲. 关20兴 A. Lemaître and H. Chate, Phys. Rev. Lett. 82, 1140 共1999兲. 关21兴 N. B. Ouchi and K. Kaneko, Chaos 10, 359 共2000兲. 关22兴 H. Chate and P. Manneville, Europhys. Lett. 17, 291 共1992兲; Chaos 3, 307 共1992兲. 关23兴 P. M. Gade, Phys. Rev. E 54, 64 共1996兲. 关24兴 S. C. Manrubia and A. S. Mikhailov, Phys. Rev. E 60, 1579 共1999兲. 关25兴 Y. Zhang, G. Hu, H. A. Cerderia, S. Chen, T. Barun, and Y. Yao, Phys. Rev. E 63, 026211 共2001兲. 关26兴 S. Sinha, Phys. Rev. E 66, 016209 共2002兲. 关27兴 P. M. Gade, H. A. Cerderia, and R. Ramaswamy, Phys. Rev. E 52, 2478 共1995兲. 关28兴 P. M. Gade and C.-K. Hu, Phys. Rev. E 62, 6409 共2000兲. 关29兴 H. Hong, M. Y. Choi, and B. J. Kim, Phys. Rev. E 65, 026139
This proves the triangle inequality.
共2002兲; 65, 047104 共2002兲. 关30兴 T. Nishikawa, A. E. Motter, Y. C. Lai, and F. C. Hoppensteadt, Phys. Rev. Lett. 91, 014101 共2003兲. 关31兴 N. J. Balmforth, A. Provenzale, and R. Sassi, Chaos 12, 719 共2002兲. 关32兴 S. E. de S. Pinto and R. L. Viana, Phys. Rev. E 61, 5154 共2000兲. 关33兴 H. Fujisaka and T. Yamada, Prog. Theor. Phys. 69, 32 共1983兲. 关34兴 M. Ding and W. Yang, Phys. Rev. E 56, 4009 共1997兲. 关35兴 M. Soins and S. Zhou, Physica D 165, 12 共2002兲. 关36兴 J. Jost and M. P. Joy, Phys. Rev. E 65, 016201 共2002兲. 关37兴 Y. L. Maistrenko, V. L. Maistrenko, O. Popovych, and E. Mosekilde, Phys. Rev. E 60, 2817 共1999兲. 关38兴 R. E. Amritkar, P. M. Gade, A. D. Gangal, and V. M. Nandkumaran, Phys. Rev. A 44, R3407 共1991兲. 关39兴 R. E. Amritkar, Physica A 224, 382 共1996兲. 关40兴 E. Olbrich, R. Hegger, and H. Kantz, Phys. Rev. Lett. 84, 2132 共2000兲. 关41兴 P. Garcïa, A. Parravano, M. G. Cosenza, J. Jimënez, and A. Marcano, Phys. Rev. E 65, 045201 共2002兲. 关42兴 L. Cisneros, J. Jimënez, M. G. Cosenza, and A. Parravano, Phys. Rev. E 65, 045204 共2002兲. 关43兴 H. Aref, Annu. Rev. Fluid Mech. 15, 345 共1983兲. 关44兴 A. Hilgers et al., Europhys. Lett. 45, 552 共1999兲. 关45兴 G. Perez, C. Pando-Lambruschini, S. Sinha, and H. A. Cerderia, Phys. Rev. A 45, 5469 共1992兲. 关46兴 E. A. Jackson and A. Kodogeorgiou, Phys. Lett. A 168, 270 共1992兲. 关47兴 T. Yanagita and K. Kaneko, Phys. Lett. A 175, 415 共1993兲. 关48兴 C. Tsallis, A. M. C. de Souza, and E. M. F. Curado, Chaos, Solitons Fractals 6, 561 共1995兲; W. J. Ma, C.-K. Hu, and R. E. Amritkar, Phys. Rev. E 70, 026101 共2004兲. 关49兴 R. J. Hendry, J. M. McGlade, and J. Weiner, Ecol. Modell. 84, 81 共1996兲. 关50兴 S. Sinha and W. L. Ditto, Phys. Rev. Lett. 81, 2156 共1998兲. 关51兴 K. Aoki and N. Mugibayashi, Phys. Lett. A 128, 349 共1998兲. 关52兴 F. A. Bignone, Theor. Comput. Sci. 217, 157 共1999兲. 关53兴 C. Beck, Phys. Rev. D 69, 123515 共2004兲. 关54兴 C. Beck, Spatio-Temporal Chaos and Vacumum Fluctuations of Quantized Fields 共World Scientific, Singapore, 2002兲. 关55兴 S. Jalan and R. E. Amritkar, Phys. Rev. Lett. 90, 014101 共2003兲. 关56兴 A. Pikovsky, M. Rosenblum, and J. Kurth, Synchronization: A Universal Concept in Nonlinear Dynamics 共Cambridge University Press, Cambridge, England, 2001兲. 关57兴 S. Boccaletti, J. Kurth, G. Osipov, D. L. Valladares, and C. S. Zhou, Phys. Rep. 366, 1 共2002兲.
016211-14
PHYSICAL REVIEW E 72, 016211 共2005兲
SYNCHRONIZED CLUSTERS IN… . I .… 关58兴 Y. Zhang, G. Hu, H. A. Cerdeira, S. Chen, T. Braun, and Y. Yao, Phys. Rev. E 63, 026211 共2001兲. 关59兴 M. G. Rosenblum, A. S. Pikovsky, and J. Kurth, Phys. Rev. Lett. 76, 1804 共1996兲; W. Wang, Z. Liu, and Bambi Hu, ibid. 84, 2610 共2000兲. 关60兴 S. C. Manrubia and A. S. Mikhailov, Europhys. Lett. 53, 451 共2001兲. 关61兴 N. B. Janson, A. G. Balanov, V. S. Anishchenko, and P. V. E. McClintock, Phys. Rev. Lett. 86, 1749 共2001兲. 关62兴 H. L. Yang, Phys. Rev. E 64, 026206 共2001兲. 关63兴 F. S. de San Roman, S. Boccaletti, D. Maza, and H. Mancini, Phys. Rev. Lett. 81, 3639 共1998兲. 关64兴 In an earlier paper 关55兴 we used the definition of phase distance as dij = 1 − 2ij / 共i + j兲. However, this earlier definition does not satisfy the triangle inequality, while the definition given in this paper satisfies the same. 关65兴 S. C. Manrubia and A. S. Mikhailov, e-print cond-mat/ 9912054. 关66兴 A.-L. Barabasi, R. Albert, and H. Jeong, Physica A 281, 69 共2000兲.
关67兴 As noted in Sec. III B, the self-organized splitting of a network into clusters is not unique. This can be seen by comparing Fig. 3共b兲 of this paper 共two ideal self-organized clusters of sizes 41 and 9兲 and Fig. 1共a兲 of Ref. 关55兴 共two ideal self-organized clusters of sizes 36 and 14兲 which are plotted for the same scale-free network and g共x兲 = x but for different ⑀ values. On the other hand the driven splitting is unique. This can be seen by comparing Fig. 3共d兲 of this paper and Fig. 1共b兲 of Ref. 关55兴 which are again plotted for the same scale-free network but for different ⑀ values. 关68兴 See, e.g., pp. 29, 54ff, and 107 of Ref. 关54兴. 关69兴 S. Sinha, D. Biswas, M. Azam, and S. V. Lawande, Phys. Rev. A 46, 6242 共1992兲. 关70兴 V. Ahlers and A. Pikovsky, Phys. Rev. Lett. 88, 254101 共2002兲. 关71兴 G. V. Osipov, A. S. Pikovsky, M. G. Rosenblum, and J. Kurths, Phys. Rev. E 55, 2353 共1997兲; G. V. Osipov and J. Kurths, ibid. 65, 016216 共2001兲. 关72兴 R. E. Amritkar, S. Jalan, and C. K. Hu, Phys. Rev. E 72, 016212 共2005兲.
016211-15