TOJET: The Turkish Online Journal of Educational Technology – April 2013, volume 12 Issue 2
SYNCHRONOUS TECHNOLOGICAL ADMINISTRATION OF DATA COLLECTION INSTRUMENTS: AN ERGONOMIC METHOD FOR GROUP ADMINISTRATION Hüseyin YARATAN Eastern Mediterranean University, Gazimağusa, via Mersin 10, Turkey
[email protected] Nilgün SUPHİ Eastern Mediterranean University, Gazimağusa, via Mersin 10, Turkey
[email protected] ABSTRACT Questionnaires administered manually can cause surreptitious peer pressure on the candidate to finish when ‘the others’ have completed theirs, forcing students to rush or skip individual items or may hinder the ability of noticing participants who may be having in difficulty understanding certain items. These drawbacks can have serious consequences on the results of the study. With the use of the new Synchronous Technological Administration Method (STAM), each item with the possible response alternatives is presented on a PowerPoint slide to the group and the administrator waits until all the respondents mark their choice on the optic form. The Revised Two Factor Study Process Questionnaire was administered to 1145 undergraduate students using the STAM proved to be beneficial in many ways. The percentage of missing data decreased immensely dropping from 21.4% to 2–5%, and the reliability of the whole instrument significantly increased. In addition, paper wastage was diminished and the use of the optic form eliminated hours of tedious plugging in of data which eliminated errors that were likely to occur with manual plugging. Keywords: group administration; synchronous administration; missing data; reliability; ergonomic method of group administration. INTRODUCTION Scholars, researchers, and educators pursuing a career in academia or administrators of academic institutes may need to conduct surveys in order to gather data. This may be done via a variety of methods. This spectrum of methods ranges from paper-and-pencil questionnaires to those that are web-based questionnaires. Some are manually distributed to individuals or groups of respondents and left for them to fill in at their own pace, some are sent out by post with a stamped and addressed envelope for easy return, and other questionnaires are completed over the phone. Computer based questionnaires (with or without the use of the Internet) are also commonly used where the respondent can click in their answers either in a laboratory setting as a group, again at their own pace or individually in their own time. It is, however, important to remember that the actual method used, can affect the quality of data collected (Bowling, 2005; Koponen, Maki-Opas, & Tolonen, 2013). Collecting data in any of the above-mentioned methods has its advantages and disadvantages based on the cost, time taken for administration, number of willing participants, and response rates. Most important of all is the actual reliability of the answers. The respondents might fill in the questionnaire without totally grasping the meaning of the items, or leave out items that they have not completely understood, thereby jeopardizing the reliability of the instrument, and creating the subject of missing data (Denscombe, 2009; Koponen, Mäki-Opas & Tolonen, 2013) which is another issue that is greatly deliberated over. Missing data is a common problem for all survey researchers (Durrant, 2009) and “can cause bias or lead to inefficient analyses.” (Horton & Kleinman, 2007, p.1). Researchers opting to delete the cases with missing data can find that this could lead to “a severe loss of statistical power” as it “often deletes a large fraction of the sample” (Allison, 2009, p.1) and in some circumstances the cases deleted may belong to a certain category. For example, it has been found that certain personality types can be more prone to leaving items unanswered (Jerant, Chapman, Buberstein, & Franks, 2009). Therefore, in order to get a true picture of the results, the replies of these respondents would also be especially important.
Copyright © The Turkish Online Journal of Educational Technology 254
TOJET: The Turkish Online Journal of Educational Technology – April 2013, volume 12 Issue 2
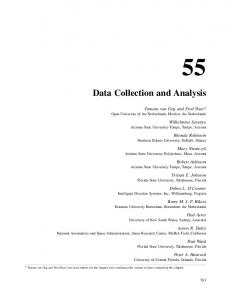
Data Collection Methods QUANTITATIVE Observing
Logs
QUALITATIVE Experimental
2ndary data from files/MIS
Surveys
Interviews Combination
Computer Assisted
Comp. Assist. Personal Interviewing (CAPI)
Comp. Assist. Telephone Interviewing (CATI)
Telephone (touch-pad keys)
Questionnaires
Comp. Assist. Selfinterviewing (CASI)
Audio Comp. Assist. SelfInterviewing (Audio-CASI)
Interview Supported Self-admin. (SELF)
Paper-and-Pencil (P&P)
P&P Telephone Interviewing (PATI)
P&P Personal (Face-to-face) Interviewing (PAPI)
Stand alone Computer Software Electronic Questionnaries
Web-based Questionnaires
Paper- and- Pencil Questionnaires
SelfGroup administered administered
Group Selfadministered administered
SelfGroup administered administered
Mail
Given out & Later collected (completed in respondents’ chosen venue)
Handed out for respondents to fill in, in the viscinity of the researcher
Figure 1. Data collection methods Much research has been done on different methods of survey administration such as the advantages and disadvantages of internet based data collection methods (Benfield & Szlemko, 2006) comparisons of (a) WorldWide Web and paper-and-pencil questionnaires (Pettit, 2002; Denscombe, 2009), (b) mail questionnaires with telephone questionnaires (Denniston & Brener, 2010), (c) face-to-face interviews, with telephone interviews, and with mail questionnaires (Summerhill & Taylor, 1992), (d) different methods of interviewing methods and self-administered questionnaires (Lang, John, & Lüdtke, 2011), and (e) several types of modes of questionnaire administration (Bowling, 2005) and their effects (Dale, 2006). A diagram showing different methods of data collection has been created from the literature reviewed. This can be seen in Figure 1. The main concern of this study is about methods of administration of questionnaires for collecting quantitative data and especially those methods that are based on group administration. These, at present, can be divided into two categories (1) the traditional paper-and-pencil questionnaires, and (2) the computer and/or web-based questionnaires. Some of the possible disadvantages suggested by researchers for both categories (group or individually administered) is that the researcher (even if present) may not be able to recognize all respondents who are having difficulties with items or statements and therefore could miss the opportunity to clarify these (Fraenkel & Wallen, 2006; Marshall, 2005). This could lead to respondents skipping or missing items or not taking the necessary care to understand the items or statements posed (Lang, John, Lüdtke, Schupp, & Wagner, 2011). As a result, this may lead to missing data and reliability issues (Koponen, et al., 2013). Further drawbacks pointed out by other researchers, is that questionnaires are not suitable for respondents who have poor literacy and poor comprehension skills (Benfield & Szlemko, 2006; Marshall, 2005) or poor vision (Marshall, 2005). The method that has been proposed in this article, which will be described extensively later in the paper, used PowerPoint slides whereby the administrator reads the questions to the whole group making it possible for the respondents to see and hear the items at the same time and move synchronously at the same pace. Since the items are read by the administrator and are shown on a PowerPoint slide to the whole group synchronously, any queries that may arise can be answered immediately by the administrator. This benefits all respondents by increasing their understanding of the items as everyone is at the same stage in the questionnaire. Copyright © The Turkish Online Journal of Educational Technology 255
TOJET: The Turkish Online Journal of Educational Technology – April 2013, volume 12 Issue 2
As everyone gets the same explanation, administration bias is also reduced. In this way many of the mentioned drawbacks can be eliminated, the number of missing data can be reduced and the reliability of the instrument can be increased. The disadvantages of using paper and pencil questionnaires over the Internet or computer-based questionnaires are higher cost and longer data entry time spent for paper and pencil questionnaires (Owens, 2005; Benfield & Szlemko, 2006). Moreover, errors made when inputting data by using paper and pencil are greatly reduced when computer or internet-based questionnaires are used (Cohen, Manion, & Morrison, 2008). With the method proposed in this paper, students will be asked to indicate their answers on the allocated optic forms, after each question has been verbally read out and visually portrayed via a PowerPoint presentation by the administrator. This will almost eradicate excess data entry time and data inputting errors and the cost will be limited to the price of the optic forms. This paper addresses all these problems and more by introducing a new method and sharing the experience of testing it on more than 1000 students in three different studies. AN ERGONOMIC METHOD FOR GROUP ADMINISTRATION Administrators of academic institutes, educators and researchers are all concerned with the issue of academic performance. There is a vast array of literature on this issue. One component of this issue is the approach to learning. A popular instrument used to measure the learning approaches of students is the revised two-factor Study Process Questionnaire (Biggs, Kember, & Leung, 2001) which measures the Deep Approach and Surface Approach. The Deep Approach is where the students’ intention is to understand and learn the material and the Surface Approach is where the students’ intention is to memorize the material to be able to pass the course. The aim of this questionnaire is to help teachers uncover what approaches their students use in leaning the material presented in their course (Biggs et al., 2001). Based on their findings the teachers will be able to implement certain teaching methods and evaluation methods to instil the Deep Approach as this is the preferred method of learning. The revised two-factor Study Process Questionnaire was used as part of a large study to find out the students’ approaches. Initially the paper and pencil survey method was employed but on facing implementation problems, a new method of collecting data using technology to overcome the existing problems has been developed. In the 2008 – 2009 Summer session the Turkish version of the Revised Two Factor Study Process Questionnaire (R-SPQ-2F) (Biggs, Kember, & Leung, 2001) was administered to Turkish students from Turkey and Cyprus studying in the Eastern Mediterranean University (EMU) in North Cyprus. One hundred and three summer school students taking a variety of summer courses formed the first sample of the study. The classical method of ‘group administration’ whereby “the instrument is administered to all members of the group at the same time and usually in the same place” (Fraenkel & Wallen, 2006, p.399) was used for each class. After the administrator was introduced to the class and the aim of the research was explained, paper copies of the questionnaires were distributed and the students were asked to respond to the items at their own pace. The administrator invigilated the process while the participants filled in their questionnaires and answered any individual queries that arose. Those who completed filling in their questionnaires were allowed to leave the classroom with the aim of minimizing distraction to the others. This action, unfortunately, backfired as the noncompleters were noticed to rush their answers ticking quickly without even reading the items or leaving some of the items unanswered so that they could join their peers outside. This was one of the many problems noticed by the administrator which was thought would lead to a reliability hindrance and missing data problem. Another such hindrance was the inability of the administrator to monitor every participant continuously through signs of body language which pointed to either difficulty in answering items or unwillingness to answer wholeheartedly although prior consent was obtained. This was mainly due to two reasons: (1) while helping students with a quiery, the administrator would not be able to notice what the others were experiencing and (2) any explanation to items given by the administrator would not be paid any attention to, due to the participants being at different stages in the completion of their questionnaires. Proof of this was found at the end of the session when the questionnaires were collected and the answer sections were checked. Some of the answer sections were ticked in a symmetrical pattern indicating that they may have been concentrating on creating an arty design rather than concentrating on the items. On further cross examination, where their answers were cross checked with items of the same nature, there were contradictory answers showing that those participants either did not comprehend the items fully or did not complete their answers willingly and carefully. Furthermore, many students left several items unanswered and as a result out of a sample of 103 students only 81 valid cases were found which caused 21.4% missing data.
Copyright © The Turkish Online Journal of Educational Technology 256
TOJET: The Turkish Online Journal of Educational Technology – April 2013, volume 12 Issue 2
An Exploratory Factor Analysis was conducted using SPSS on the data obtained from this first administration of the questionnaire and Varimax rotation was employed fixing the factors to two. All the items for Deep Approach and Surface Approach fitted snuggly into each factor except for a Surface Approach item 4, “I only study seriously what is given out in class”. Hence, this item was omitted from the reliability analysis. As can be seen in Table 1, the Cronbach’s Alpha values found for the factors in this questionnaire were higher for one factor (Deep Approach, α = .77) but much lower for the second factor (Surface Approach, α = .69), yielding a difference of .08 between the two. This result is similar to the original study conducted by Biggs et al. (2001), where the Cronbach’s Alpha value for the Deep Approach was found to be .73, and .64 for the Surface Approach, yielding a .09 difference between the two. For both studies the reliability of the Deep Approach fell into the ‘acceptable’ category and ‘poor’ for the Surface Approach (George & Mallery, 2001). The problems faced with this type of administration forced the authors to search for a new method. It was decided that a PowerPoint version of the questionnaire would be prepared. The first few slides would introduce the purpose of the study and the questionnaire. This would be followed by each item with the possible response alternatives portrayed on a slide. The whole process would be conducted using these slides. In addition to solving the abovementioned problems, this method would also eliminate the following expensive and time consuming factors: (1) Process of designing manual questionnaires to fit a minimum number of pages but at the same time be readable and understandable for the participants; (2) having to do a pilot study of the manual questionnaires for comprehension and ease of completion based on the design; 3) photocopying one questionnaire for each participant totalling to a number equal to the sample size, and 4) burden of carrying a heavy load of questionnaires to different venues for administration. For all these reasons the Synchronous Technological Administration Method (STAM) was created to be used when collecting data in group administration settings as it seems to be easier to administer and more economical, feasible and reliable. EXPERIENCE IN USING THE STAM The same questionnaire, Turkish version of the R-SPQ-2F (Biggs et al., 2001) was administered using the STAM to students taking the EGIT213 (Statistics – I) course in the Guidance & Psychological Counseling Program in the Department of Educational Sciences in the Eastern Mediterranean University. It was administered to four groups with a total number of 100 students during the 2009 – 2010 Fall Semester. After optic forms were distributed to the participants, the administrator began the PowerPoint presentation by explaining the aim of the research and questionnaire, followed by giving instructions for answering the items and then showing and reading each item with possible response alternatives on every slide. While waiting for all students to finish answering, the administrator checked the respondents’ body language for any problems such as confusion with the meaning of an item or unwillingness to wholeheartily participate, dealt with them where necessary and continued to the following slides in the same manner. In this way each slide took on the average between 22 - 24 seconds for completion. Each item taking the student between 5 – 10 seconds to fill in the circle on the optic form after having read and/or heard the item. Out of a sample of 100 students 98 valid cases were found. This shows only 2% missing data. This is a great improvement from the previous study (missing data = 21.4%) that was conducted without the use of the STAM. An Exploratory Factor Analysis was conducted using SPSS for the data obtained from this second administration of the questionnaire, and Varimax rotation was employed fixing the factors to two. Again, all the items for Deep Approach and Surface Approach fitted into each factor except for the Surface Approach item 4. This item was again omitted from the reliability analysis. The reliability coefficient of the Surface Approach segment of the questionnaire improved rising from .69 (poor) to .74 (acceptable) and the difference between the reliability coefficients of the Deep and Surface Approaches were reduced to .01 as seen in Table 1. The reason for this rise in the alpha value could be due to the use of the STAM whereby students using the Surface Approach were compelled to spend enough time to concentrate on the items and/or portraying and reading out each item for them may have contributed to their better understanding of these items. The sample sizes used for the initial two studies were limited to around 100 students. Aiming to increase the reliability of the Turkish version of the R-SPQ-2F (Biggs et al., 2001) questionnaire, it was administered by using the STAM in the 2010 summer semester to 184 students taking one of the six summer school courses, namely, LAW421 (Labour and Security Law), IENG355 (Ethics in Engineering), FINA302 (Money and Banking), FINA362 (Applied Financial Statistics), MATH373 (Numerical Analysis for Engineers), and FINA461 (Advanced Software Applications in Banking). One hundred and seventy-seven valid cases were Copyright © The Turkish Online Journal of Educational Technology 257
TOJET: The Turkish Online Journal of Educational Technology – April 2013, volume 12 Issue 2
found showing only 3.8% missing data. Once again a great improvement from the first study which had 21.4% missing data. The Exploratory Factor Analysis was conducted using SPSS for the data obtained from this third administration of the questionnaire, and Varimax rotation was employed forcing the factors into two, yet again item 4 was found as an outlier and omitted from the reliability analysis. Thus, the reliability coefficients of the Deep and Surface Approach factors were found to both be equal to .71 (acceptable), reducing the difference between the two alpha values to zero. A final study using the same questionnaire but with the omission of item 4, was conducted on 862 undergraduate students in 34 classes of the Faculty of Education in the Eastern Mediterranean University in the 2010 – 2011 Fall Semester. Again, Exploratory Factor Analysis was conducted using SPSS for the data obtained from this fourth administration of the questionnaire, and Varimax rotation was employed fixing the factors to two. All the Deep Approach and Surface Approach items fitted into their own factors. Out of a sample of 862 students 819 valid cases were found. This shows only 5% missing data. Again, a great improvement from the initial study without the use of the STAM which had given rise to a 21.4% missing data. The Cronbach’s Alpha values for the Deep Approach and the Surface Approach both increased to .80 which is considered as a ‘good’ reliability, and became higher than the other Turkish versions with smaller sample sizes as can be seen in Table 1. Furthermore, the difference between the reliability coefficients of the two factors remained as zero. Table 1: Cronbach’s Alpha values and missing data for the studies with and without the use of the STAM English Turkish Turkish Turkish Turkish version version version version version Original 1st study 2nd study 3rd study Final study study without the without the using the using the using the STAM STAM STAM STAM STAM N=495 Alpha value for Deep App. Alpha value for Surface Approach Difference between the two factors’ alpha values Missing data
N = 103
N = 99
N=184
N = 862
0.73
0.77
0.75
0.71
0.80
0.64
0.69
0.74
0.71
0.80
0.09
0.08
0.01
0.00
0.00
…
22 (21.4%)
2 (2%)
7 (3.8%)
43 (5%)
As can be seen from the results, the original English version implemented by Biggs, Kember, and Leung (2001) was conducted without the use of the STAM on 495 undergraduate students and the Cronbach’s Alpha value for the Deep Approach was found to be .73, and .64 for the Surface Approach. These reliability values are considered to be an ‘acceptable’ for the Deep Approach and ‘poor’ for the Surface Approach (George & Mallery, 2001). These values create a .09 difference between the Cronbach’s Alpha values for the two factors. The first study conducted with the Turkish version of the questionnaire was also implemented without the use of the STAM and the Cronbach’s Alpha values of .77 (acceptable) and .69 (poor) for the Deep Approach and Surface Approach factors respectively. These results were similar to those of the original study, creating almost an equal difference of .08 in the Cronbach’s Alpha values for the two factors. The second study conducted with the Turkish version, this time using the STAM, produced ‘acceptable’ reliability results for both factors; .75 for the Deep Approach and .74 for the Surface Approach. A difference of .01 between the two Cronbach’s Alpha values for the two factors was computed which can be considered as negligible.
Copyright © The Turkish Online Journal of Educational Technology 258
TOJET: The Turkish Online Journal of Educational Technology – April 2013, volume 12 Issue 2
The third study yielded similar results. A Cronbach’s Alpha value of .71 was found for both the Deep and Surface Approach factors diminishing the difference between the two to zero. When the same questionnaire was implemented to 862 students in the actual study, the reliability results increased to .80 for both the Deep and Surface Approach factors, which is considered a ‘good’ reliability value (George & Mallery, 2001). Again the difference between the two Cronbach’s Alpha values were zero. This result may show that students might have been having difficulty with the Surface Approach questions but with the use of the STAM this problem was reduced to a minimum. In addition to this, the use of the STAM seems to have brought both factors’ reliabilities to ‘acceptable’ levels. Furthermore the increase of the sample size enabled the relability value to rise to a ‘good’ level. Hence, it can be concluded that by changing the method of group administration of questionnaires to the Synchronous Technological Administration Method, the percentage of missing data can be reduced considerably, the reliability problems due to the misunderstanding of some items can be mostly eliminated, and the reliability level of the whole instrument can be significantly increased. CONCLUSION AND BENEFITS OF USING THE STAM Starting from 2009 – 2010 Fall Semester the STAM has been used to administer the Turkish version of the RSPQ-2F (Biggs et al., 2001) to 1145 undergraduate students enrolled in the Eastern Mediterranean University in North Cyprus. This method was designed in order to remedy the problems faced when implementing the classical manual group administration method. It uses technology in two stages; one during the actual administration, and one for plugging in the data from optic forms via an optic reader to the statistics program. Thus relieving the researcher of the arduous ordeal of manually plugging in the data. Reduction of Missing Data and Increasing Reliability One of the most prominent benefits of using the STAM was found to be the decrease in the percentage of missing data dropping from 21.4% which was obtained from the regular group administration to between 2 – 5%. Another important benefit was found to be the significant increase of the reliability of the whole instrument. Other Benefits of Using the STAM Apart from the reduction of the percentage of missing data and significant improvement in the reliability of the instrument, many more benefits before, during and after administration can be noted with this method. First, there is no paper wastage since PowerPoint slides are used for the presentation of the items, thus aiding in the conservation of trees. Furthermore, money and time is saved from getting the manual questionnaires photocopied for hundreds if not thousands of participants. Second, the burden of carrying the weight of the manual questionnaires is removed – all that is necessary are optic forms and a laptop (or just a usb if a computer is already present in the room of administration). Third, during the administration the students took interest in the items and seemed to look forward to the ‘next slide’, some even asking for more items at the end of the administration, thus showing their enthusiasm towards the procedure. Fourth, during the administration the researcher was able to spot students who seemed to be filling in the questionnaires halfheartedly and not taking the administration seriously. These students were noted to be filling in the optic form before the items were shown or read out, or be in continuous conversation with their friends and therefore not listening to the items or looking at the slides. When this type of behavior was noted, the administrator was able to stop the administration to talk about the importance of everyone’s sincere responses and to coax them into concentrating on filling in the optic form. As this interruption is done after the current item has been completed by everyone, it is believed that nobody is disturbed; whereas in the classical group administration, where participants are not working on the items synchronously as in the STAM but instead working at their own pace, it is not right to make this type of interruption as this will disturb respondents who are trying to concentrate on filling in the questionnaire. Fifth, by looking at the students’ facial expressions after an item was read out and shown on the screen, the administrator could ascertain whether anyone had any problems with understanding the item and provide any necessary explanation. In this way other respondents will not be disturbed since they are all working on the same item. Sixth, the STAM catered for students with different learning styles. For example, the administrator noticed a student with his back to the screen where the items were being projected and asked if he would like to change his seat so that he could follow the PowerPoint slides. The student said that he preferred to ‘just listen’ to the items as he was able to concentrate better this way. This would not be possible in the classical administration method, as the respondents would have to read the items before responding to them. Seventh, students with visual or aural handicaps can still be included in the research since PowerPoint presentation caters for the needs of the hearing-impaired and the administrator’s voice caters for the needs of the visually impaired. Eighth, the administrator was able to notice students who needed more time to respond to some of the items and told them that they could come up to the administrator at the end of the session to go over Copyright © The Turkish Online Journal of Educational Technology 259
TOJET: The Turkish Online Journal of Educational Technology – April 2013, volume 12 Issue 2
the items they needed more time on. A few students in each group did benefit from this opportunity. There were three to four students in most classes who fell into this category. In doing so this contributed immensely towards the reduction of the percentage of missing data within the sample. Ninth, although initially it was hypothesized that the implementation of the STAM may take more time to complete than the classical implementation method, this was not the case as students struggling with any item were immediately given clarifications and in this way the time lost pondering over items on their own was reduced. Tenth, the reading of the optic form done by the optic reader is done in minutes thus saving days or even weeks or months of tedious work involved in plugging in data to a statistics program. Furthermore, using the optic reader rather than plugging in the data manually is a health benefit as it is easier on the eyes and back of the researcher. Using the optic reader rather than plugging the data manually also reduces errors and the time needed to check and correct these errors. The STAM of data collection is a group administration in the real sense, not just the distribution of questionnaires to a group of participants where they complete the instruments at their own pace, but group in the sense that they all go forward synchronously at the same pace. It uses technology in two stages – during and after administration, reducing the workload involved with data collection. It also makes use of the benefits of a combination of both face-to-face individual and group administration where every person is monitored after each item is read out, and any arising problems are solved thus reducing missing data enabling higher reliability. REFERENCES Allison, P. D. (2009). Missing Data, Chapter 4, Statistical Horizons. Retrieved February 20, 2012 from http://www.statisticalhorizons.com/downloads/Milsap-Allison-pdf Benfield, J. A., Szlemko, W. J. (2006). Internet-based data collection: Promises and realities. Journal of Research Practice, 2. Retrieved June 27, 2011 from http://jrp.icaap.org/index.php/jrp/article/viewArticle/30/51 Biggs, J. B., Kember, D., & Leung, D. Y. P., (2001). The revised two-factor study process questionnaire: RSPQ-2F. British Journal of Educational Psychology, 71, 133-149. Bowling, A. (2005). Mode of questionnaire administration can have serious effects on data quality. Journal of Public Health. 27, 281-291. Retrieved June 29, 2011 from http://jpubhealth.oxfordjournals.org/content/27/3/281.full.pdf+html Cohen, L., Manion, L., & Morrison, K. (2008). Research Methods in Education. 6th ed. Routledge, Taylor & Francis, London and New York. Dale, A. (2006). Quality issues with survey research, International Journal of Social Research Methodology, 9(2), 143-158. Retrieved February 20, 2012 from http://dx.doi.org/10.1080/13645570600595330 Denniston, M. & Brener, N. (2010). A comparison of mail and telephone administration of district-level questionnaires for the School Health Policies and Programs Study (SHPPS) 2006: Effects on estimates and data quality, Journal of School Health, 80. Retrieved June 29, 2011 from http://www.med.upenn.edu/beat/docs/DennistonandBrener2010.pdf Denscombe, M. (2009). Item non-response rates: a comparison of online and paper questionnaires, International Journal of Social Research Methodology, 12(4), 281-291. Retrieved February 20, 2012 from http://dx.doi.org/10.1080/13645570802054706 Durrant, G. B. (2009). Imputation methods for handling item-nonresponse in practice: methodological issues and recent debates, International Journal of Social Research Methodology, 12(4), 293-304. Retrieved February 20, 2012 from http://dx.doi.org/10.1080/13645570802394003 Fraenkel, J. R., & Wallen, N. E. (2006). How to design and evaluate research in education (6th ed., International Edition). McGraw Hill Higher Education, NY. George, D. & Mallery, (2001). SPSS for Windows A simple guide and reference, 3rd edition. A Pearson Education Co., Needham Heights, MA 02494 USA. Horton, N. J., & Kleinman, K. P. (2007). Much ado about nothing: A comparison of missing data methods and software to fit incomplete data regression models. The American Statistician, 61(1) 79-90. Retrieved October 18, 2011 from http://www.math.smith.edu/~nhorton/muchado.pdf Jerant, A., Chapman, B. P., Duberstein, P., & Franks, P. (2009). Is personality a key predictor of missing study data? An analysis from a randomized controlled trial. Annals of Family Medicine, 7(2). Retrieved October 18, 2011 from http://www.ncbi.nlm.n.h.gov/pmc/articles/PMC2653957/pfd/0060148.pdf Koponen, P., Mäki-Opas, J., & Tolonen, (2013). H. Questionnaire design and administration. EHES Manual, Part A. Retrieved February 12, 2013 from http://www.ehes.info/manuals/EHES_manual/EHES_manual.htm Lang, F. R., John, D., Lüdtke, O., Schupp, J., & Wagner, G. G. (2011). Short assessment of the Big Five: robust across survey methods except telephone interviewing. Behavioral Research 43, 548-567. Retrieved June 29, 2011 from http://springerlink.com/content/y7426hw21vp1q41/fulltext.pdf
Copyright © The Turkish Online Journal of Educational Technology 260
TOJET: The Turkish Online Journal of Educational Technology – April 2013, volume 12 Issue 2
Marshall, G. (2005). The purpose, design and administration of a questionnaire for data collection. adiography, 11, 131-136. Retrieved July 22, 2011 from http://www.sciencedirect.com/science/article/pii/S1078817404001208 Owens, L. K. (2005) Introduction to survey research design. SLR Spring 2005 Seminar series. Retrieved July 19, 2011 from http://222.srl.uic.edu/semiars/surveydesign.DOC Pettit, F. A. (2002). A comparison of World-Wide Web and paper-and-pencil personality questionnaires, Behavior Research Methods, Instruments & Computers, 34, 50-54. Retrieved June 29, 2011 from http://www.springerlink.com/content/b115760536046200/fulltext.pdf Summerhill, W. R., & Taylor, C. L. (November, 1992). Selecting a data collection technique. Florida Cooperative Extension Service (University of Florida), Circular PE-21. Retrieved June 29, 2011 from http://edis.ifas.ufl.edu/pdffiles/PD/PDO1600.pdf
Copyright © The Turkish Online Journal of Educational Technology 261