sensors Article
Synthesis and Application of an Aldazine-Based Fluorescence Chemosensor for the Sequential Detection of Cu2+ and Biological Thiols in Aqueous Solution and Living Cells Hongmin Jia 1 , Ming Yang 1 , Qingtao Meng 1, *, Guangjie He 2 , Yue Wang 1 , Zhizhi Hu 1 , Run Zhang 3 and Zhiqiang Zhang 1, * Received: 20 November 2015; Accepted: 2 January 2016; Published: 11 January 2016 Academic Editor: W. Rudolf Seitz 1
2 3
*
Key Laboratory for Functional Material, Educational Department of Liaoning Province, University of Science and Technology Liaoning, Anshan 114051, China;
[email protected] (H.J.);
[email protected] (M.Y.);
[email protected] (Y.W.);
[email protected] (Z.H.) Department of Forensic Medicine, Xinxiang Medical University, Xinxiang, He‘nan 453003, China;
[email protected] Department of Chemistry and Biomolecular Sciences, Macquarie University, Sydney, NSW 2109, Australia;
[email protected] Correspondence:
[email protected] (Q.M.);
[email protected] (Z.Z.); Tel.: +86-412-5928-009 (Z.Z.)
Abstract: A fluorescence chemosensor, 2-hydroxy-1-naphthaldehyde azine (HNA) was designed and synthesized for sequential detection of Cu2+ and biothiols. It was found that HNA can specifically bind to Cu2+ with 1:1 stoichiometry, accompanied with a dramatic fluorescence quenching and a remarkable bathochromic-shift of the absorbance peak in HEPES buffer. The generated HNA-Cu2+ ensemble displayed a “turn-on” fluorescent response specific for biothiols (Hcy, Cys and GSH) based on the displacement approach, giving a remarkable recovery of fluorescence and UV-Vis spectra. The detection limits of HNA-Cu2+ to Hcy, Cys and GSH were estimated to be 1.5 µM, 1.0 µM and 0.8 µM, respectively, suggesting that HNA-Cu2+ is sensitive enough for the determination of thiols in biological systems. The biocompatibility of HNA towards A549 human lung carcinoma cell, was evaluated by an MTT assay. The capability of HNA-Cu2+ to detect biothiols in live A549 cells was then demonstrated by a microscopy fluorescence imaging assay. Keywords: aldazine; chemosensing ensemble; biothiols; detection; fluorescence imaging
1. Introduction Chemosensors are molecules of abiotic origin that bind selectively and reversibly to the analyte of interest with concomitant change in one or more properties of the system [1–3], such as fluorescence [4], color [5] or redox potential [6]. Among of them, fluorescent chemosensors have several advantages over the other methods due to their sensitivity, specificity and real-time monitoring with fast response times [7–9]. Particularly, fluorescence chemosensors are convenient to image physiologically important ions and small-molecules by in situ methods. To date, an enormous amount of work has been done for the rational design of fluorescent chemosensor for ions and neutral analytes [10–16]. Biothiols, including cysteine (Cys), homocysteine (Hcy), and glutathione (GSH) play important roles in a myriad of vital cellular processes such as biological redox homeostasis, biocatalysis, metal binding and post translational modifications [17–19]. Specifically, it has been reported that Hcy is an essential biological molecule required for the growth of cells and tissues [20,21]. As the most
Sensors 2016, 16, 79; doi:10.3390/s16010079
www.mdpi.com/journal/sensors
Sensors 2016, 16, 79 Sensors 2016, 16, 79
2 of 14 2 of 14
redox homeostasis [22,23]. Cysplays is a semi-essential aminoacid, and its thiolstress side chain serves as a abundant cellular thiol, GSH a central role in combating oxidative and maintaining nucleophile in many enzymatic reactions [24,25]. Abnormal levels of cellular biothiols are implicated redox homeostasis [22,23]. Cys is a semi-essential aminoacid, and its thiol side chain serves as a in a variety of diseases, such as leucocyte loss, psoriasis, liver damage, slowed growth, asthma, cancer nucleophile in many enzymatic reactions [24,25]. Abnormal levels of cellular biothiols are implicated and AIDS [26,27]. At elevated levels in loss, plasma, Hcy isliver a well-known risk growth, factor for Alzheimer’s in a variety of diseases, such as leucocyte psoriasis, damage, slowed asthma, cancer disease, folate andAt cobalamin (vitamin B12) deficiencies, and cardiovascular [28]. Variations and AIDS [26,27]. elevated levels in plasma, Hcy is a well-known risk factordiseases for Alzheimer’s disease, in GSHand levels are associated with chronic diseases such as cancer, neurodegenerative diseases, folate cobalamin (vitamin B12) deficiencies, and cardiovascular diseases [28]. Variations incystic GSH fibrosis (CF), HIV, and aging [29,30]. Cys deficiency is involved in many syndromes, for instance, levels are associated with chronic diseases such as cancer, neurodegenerative diseases, cystic fibrosis slow HIV, growth children, liver skin lesions and weakness [31]. Elevated levelsslow of Cys are (CF), andinaging [29,30]. Cysdamage, deficiency is involved in many syndromes, for instance, growth associated with neurotoxicity, which has been demonstrated in animals with immature blood-brain in children, liver damage, skin lesions and weakness [31]. Elevated levels of Cys are associated with barriers and inwhich cultured in vitro [32]. in animals with immature blood-brain barriers and in neurotoxicity, hasneurons been demonstrated In view of their importance, safe, highly selective and sensitive detection methods for biothiols cultured neurons in vitro [32]. in living systems have very desirable Inselective the past and decades, continuous efforts havefor been made In view of their importance, safe, [33]. highly sensitive detection methods biothiols with regard to chemical and physical methods for the detection of biothiols, in living systems have very desirable [33]. In the past decades, continuous effortsincluding have beenHPLC, made capillary electrophoresis, and optical assay mass spectrometry, electrochemical assay, and with regard to chemical and physical methods for the detection of biothiols, including HPLC, capillary surface-enhanced Raman scattering (SERS) [34–37]. However, these methods generally have some electrophoresis, and optical assay mass spectrometry, electrochemical assay, and surface-enhanced limitations, e.g., high equipment complexity, and time consuming processinge.g., or Raman scattering (SERS) [34–37]. costs, However, these methods generally have sample some limitations, assays, which make them impractical for applications such as high-throughput clinical tests or high equipment costs, complexity, and time consuming sample processing or assays, which make research purposes [38]. Fluorescence-based methods using responsive chemosensors have long been them impractical for applications such as high-throughput clinical tests or research purposes [38]. recognized as one ofmethods the mostusing promising techniques for thiolhave detection due to their highassensitivity, Fluorescence-based responsive chemosensors long been recognized one of the selectivity, simplicity of operation and potential application in living cell imaging. In simplicity the past few most promising techniques for thiol detection due to their high sensitivity, selectivity, of years, various fluorescent chemosensors to detect biothiols have been developed by exploiting operation and potential application in living cell imaging. In the past few years, various fluorescent diverse reaction mechanisms, addition [39,40],diverse cyclization reactions with chemosensors to detect biothiolsincluding have been Michael developed by exploiting reaction mechanisms, aldehyde [41,42], cleavage reactions by thiols [43,44], and others [45,46]. including Michael addition [39,40], cyclization reactions with aldehyde [41,42], cleavage reactions by more attention has been paid to indicator displacement assays based on a simple thiolsRecently, [43,44], and others [45,46]. competition mechanism between indicator analytesdisplacement [47,48]. For the displacement Recently, more attention hasan been paid toand indicator assays based on astrategy, simple the receptor is non-covalently attached to the indicator (cation) forming a so-called chemosensing competition mechanism between an indicator and analytes [47,48]. For the displacement strategy, ensemble, is non-fluorescent due to metal ion-induced fluorescence quenching. Further the receptorwhich is non-covalently attached to the indicator (cation) forming a so-called chemosensing addition of small-molecules or anions, however, may remove the metal ion and release the ensemble, which is non-fluorescent due to metal ion-induced fluorescence quenching. Further addition 2+ fluorophore-ligand into solution, with the of the fluorescence It is well that Cu is a of small-molecules or anions, however, mayrevival remove metal ion [49]. and release theknown fluorophore-ligand fluorescence quencher due to its notorious paramagnetic nature [50]. Moreover, Cu is well as 2+ into solution, with the revival of fluorescence [49]. It is well known that Cu is a fluorescenceknown quencher adue “soft” metal with high affinity to –SH groups in biothiol side chains. Accordingly, based on to its notorious paramagnetic nature [50]. Moreover, Cu is well known as a “soft” metal with exploitation Cu2+ groups as an “ON–OFF–ON’’ signaling motif, sensing systemsofcomprising high affinity of to –SH in biothiol side chains. Accordingly, basedensemble on exploitation Cu2+ as an 2+ centre have been developed for the selective multifunctional fluorophores ligated to the Cu “ON–OFF–ON” signaling motif, sensing ensemble systems comprising multifunctional fluorophores detection [51].have been developed for the selective detection of biothiols [51]. ligated to of thebiothiols Cu2+ centre
Scheme 1. Schematic illustration of the design and sensing mechanism of HNA-Cu2+ ensemble for the Scheme 1. Schematic illustration of the design and sensing mechanism of HNA-Cu2+ ensemble for reversible detection of bioactive thiols. the reversible detection of bioactive thiols.
In this In this context, context, we we report report an an aldazine-based aldazine-based fluorescence fluorescence ligand, ligand, 2-hydroxy-1-naphthaldehyde 2-hydroxy-1-naphthaldehyde azine (HNA) prepared by a straightforward condensation reaction. emission signal of HNA azine (HNA) prepared by a straightforward condensation reaction. TheThe emission signal of HNA was 2+ via forming a HNA-Cu2+ complex, and was exclusively recovered was selectively quenched by Cu 2+ 2+ selectively quenched by Cu via forming a HNA-Cu complex, and was exclusively recovered followed by addition of thiols (Scheme 1). This reversible “ON–OFF–ON” response provides a convenient and practical way for the detection of biothiols in aqueous media and biological samples.
Sensors 2016, 16, 79
3 of 14
followed by addition of thiols (Scheme 1). This reversible “ON–OFF–ON” response provides a convenient and practical way for the detection of biothiols in aqueous media and biological samples. The photophysical properties and biothiols recognition behaviors of HNA-Cu2+ have been investigated in detail through UV-Vis absorption spectra, fluorescence spectra and microscopy fluorescence images in biological cells. 2. Experimental Section 2.1. Chemicals 2-Hydroxy-1-naphthaldehyde, hydrazine hydrate and 4-diethylaminosalicylaldehyde were purchased from Sinopharm Chemical Reagent Co., Ltd. (Shanghai, China). Reagents and solvents were of A. R. grade and used without further purification unless otherwise noted. Fresh stock solution of metal ions (nitrate salts, 20 mM) and thiols, amino acids (20 mM) in H2 O were prepared for further experiments. 2.2. Apparatus 1 H-NMR
and 13 C-NMR spectra were recorded with an AVANCE 500 MHz spectrometer (Bruker, Fällanden, Switzerland) with chemical shifts reported as ppm (in DMSO, TMS as internal standard). API mass spectra were recorded on a 1100LC/MSD spectrometer (HP, Palo Alto, CA, USA). The elemental analyses of C, H, N and O were performed on a EL III elemental analyzer (Vario, Frankfurt, Germany). The melting point of HNA was measured by DSC4000 differential scanning calorimetry (Perkin Elmer, Waltham, MA, USA). Fluorescence spectra were determined with a LS 55 luminescence spectrometer (Perkin Elmer). The absorption spectra were measured with a Lambda 900 UV/VIS/NIR spectrophotometer (Perkin Elmer). Fluorescent live cell images were acquired on a Ti-S inverted fluorescence microscope with an objective lens (ˆ20) (Nikon, Tokyo, Japan). Excitation with blue light was used for fluorescence imaging. 2.3. General Procedures of Spectra Detection Stock solutions of HNA was prepared in DMF-HEPES buffer (20 mM, pH = 7.4, 3:7 v/v). The excitation wavelength for HNA was 411 nm. Before spectroscopic measurements, the solution was freshly prepared by diluting the high concentration stock solution to corresponding solution (10 µM). Each time a 3 mL solution of chenosensor was filled in a quartz cell of 3 cm optical path length, and different stock solutions of cations were added into the quartz cell gradually by using a micro-syringe. The volume of cationic stock solution added was less than 100 µL with the purpose of keeping the total volume of testing solution without obvious change. HNA-Cu2+ solution for thiols and amino acids detection was prepared by addition of 3.0 equiv. of Cu2+ to HNA (10 µM) solution in DMF-HEPES buffer (20 mM, pH = 7.4, 3:7 v/v). The quantum yields were determined according to a reported procedure using fluorescein as standard (Φf = 0.85 in 0.1 N NaOH aqueous solutions) [52]. 2.4. Association Constant Calculation Generally, for the formation of 1:1 complexation species formed by the chemosensor compound and the guest cations, the Benesi-Hildebrand equation used is as follows [53]: 1 1 1 “ ` 2 ` F0 ´ F Ka pF0 ´ Fmin qrCu s F0 ´ Fmin where F and F0 represent the fluorescence emission of HNA in the presence and absence of Cu2+ , respectively, Fmin is the saturated emission of HNA in the presence of excess amount of Cu2+ ; [Cu2+ ] is the concentration of Cu2+ ion added, and Ka is the binding constant.
Sensors 2016, 16, 79
4 of 14
2.5. Synthesis and Characterization the Fluorescent Chemosensor HNA The synthesis of HNA was carried out according to the previously reported method [54]. To a solution of 2-hydroxy-1-naphthaldehyde (0.172 g, 0.5 mmol) in methanol (10 mL), hydrazine (0.5 equiv.) in methanol (10 mL) was added slowly at room temperature. The stirred reaction mixture was heated to reflux for 6 h. The formed yellow precipitate was filtered, washed with methanol and then dried under vacuum to obtain HNA in 87% yield. Yellow solid, m.p. 310 ˝ C, 1 H-NMR (DMSO-d6 , 500 MHz) δ(ppm): 12.89 (s, 1H), 10.00 (s, 1H), 8.667 (d, J = 10.5 Hz, 1H), 8.046 (d, J = 11.5 Hz, 1H), 7.929 (d, J = 10 Hz, 1H), 7.628 (t, J = 9.5 Hz, 1H), 7.452 (t, J = 9.25 Hz, 1H), 7.294 (d, J = 11 Hz, 1H). 13 C-NMR (DMSO-d6 , 125 MHz) δ (ppm): 163.12, 151.29, 148.16, 140.61, 137.33, 136.26, 124,54, 122.12, 114.44, 110.64, 107.88. ESI-mass spectra (positive mode, m/z): Calcd for C22 H17 N2 O2 : 341.1290 [HNA + H]+ ; Found: 341.1290. Elem Anal: Calcd for HNA: C, 77.63; H, 4.74; N, 8.23; O, 9.40. Found: C 77.68; H 4.75; N 8.21; O 9.42. 2.6. Fluorescence Imaging of Biothiols in A549 Cells The human lung cancer cell A549 line was acquired from the Cell Bank of the Chinese Academy of Sciences (Shanghai, China) and cultured in F12K medium, supplemented with 10% (v/v) fetal bovine serum (FBS), penicillin (100 µg/mL), streptomycin sulphate (100 µg/mL). Cells were cultured in a humidified 37 ˝ C, 5% CO2 /95% air (v/v) incubator. The growth medium was changed every two days. The cells were grown to 80% confluence prior to experiment. For the fluorescence microscope imaging, cells were typically seeded at a density of 5 ˆ 104 cells/mL in a 22 mm cover-glass bottom culture dishes (ProSciTech, Shanghai, China). A549 cells were incubated with HNA-Cu2+ (10 µM in PBS medium) for 30 min at 37 ˝ C. After removal of the growth medium, the cells were imaged by inverted fluorescence microscopy. As a control experiment, the A549 cells were pre-treated with an excess of N-ethylmaleimide (NEM, 1 mM) for 30 min and then treated with 10 µM of HNA-Cu2+ for another 30 min, and subjected to fluorescence microscope imaging. 3. Results and Discussion 3.1. Spectroscopic Studies of HNA in the Presence of Cu2+ HNA was easily synthesized by a straightforward synthetic route. Briefly, 2-hydroxy-1-naphthaldehyde was treated with 0.5 equv. of hydrazine in methanol solution at room temperature to form the Schiff base ligand HNA in quantitative yield. The structure of HNA was confirmed by NMR, mass spectra and elemental analysis. Early studies revealed that salicylaldehyde-based hydrazone framework is a typical scaffold for the construction of Cu2+ fluorescent chemosensor [55]. In the present work, HNA displayed excellent selectivity for Cu2+ in the presence of other competing cations with observable changes in UV-Vis and fluorescence spectra in HEPES buffer. By virtue of the extremely high copper-sulfur affinity, the in situ generated HNA-Cu2+ fluorescence ensemble was expected to act as a potential chemosensor for biothiol determination via a Cu2+ displacement approach. The stability of the unique ligand, HNA was firstly confirmed by the measurement of fluorescence intensities in DMF-HEPES buffer (20 mM, pH = 7.4, 3:7 v/v). As shown in Figure S1, no obvious fluorescent intensities changes were observed even after 30 h, indicating that HNA is stable under the test conditions. For the biological application of HNA, the sensing should be operated in a physiological range of pH. Therefore, the effect of pH on fluorescence intensities of HNA and HNA-Cu2+ was evaluated in water with different pH levels. As shown in Figure S2, the suitable pH range for Cu2+ determination was confirmed to be pH 6.0–10.0, suggesting that the proposed chemosensor is suitable for application under physiological conditions. The specific complexation of HNA with Cu2+ was first investigated by the UV-Vis absorption spectrum in HEPES buffer. As shown in Figure 1A, HNA displays an intense absorption band centered at 411 nm. Upon addition of increasing amounts of Cu2+ (0–3.5 equiv) to HNA in HEPES buffer, the maximum absorption band of HNA centered at 411 nm was gradually reduced, and a new absorption
Sensors 2016, 16, 79
5 of 14
band appeared at 457 nm (Figure 1A). The changes of absorbance reached to the maximum value upon addition of 3.0 equiv. of Cu2+ . In addition, an obvious color changes from yellowish to yellow was observed for HNA solution when the addition of Cu2+ (Figure 1A inset), suggesting that the HNA Sensors 2016, 16, 79 5 of 14 could be used as a chemosensor for the detection of Cu2+ by the naked eye.
Figure 1. (A) UV-Vis absorption spectra of HNA (10 µM) in the presence of increasing amount of Figure 1. (A) UV-Vis absorption spectra of HNA (10 μM) in the presence of increasing amount of Cu2+ (0–35 µM) in DMF-HEPES buffer (20 mM, pH = 7.4, 3:7 v/v). Insert: Colorimetric changes of Cu2+ (0–35 μM) in DMF-HEPES buffer (20 mM, pH = 7.4, 3:7 v/v). Insert: Colorimetric changes of HNA without (a) and with (b) the addition of Cu2+ in HEPES buffer; (B) Fluorescence spectra of HNA HNA without (a) and with (b) the addition of Cu2+ in HEPES buffer; (B) Fluorescence spectra of HNA (10 µM) in DMF-HEPES buffer (20 mM, pH = 7.4, 3:7 v/v) in the presence of different amounts of Cu2+ (10 μM) in DMF-HEPES buffer (20 mM, pH = 7.4, 3:7 v/v) in the presence of different amounts of Cu2+ (0–35 µM). Insert: normalized fluorescence intensities of HNA (10 µM) at 513 nm as a function of Cu2+ (0–35 μM). Insert: normalized fluorescence intensities of HNA (10 μM) at 513 nm as a function of Cu2+ (0–35 µM). Excitation was performed at 411 nm. (0–35 μM). Excitation was performed at 411 nm. 2+ The fluorescence metal ions and its its selectivity for for Cu2+ fluorescencetitration titrationofofHNA HNAtowards towardsrepresentative representative metal ions and selectivity Cuin DMF-HEPES buffer (20 mM, pH =pH 7.4,= 3:7 werewere further investigated. As shown in Figure 1B. HNA in DMF-HEPES buffer (20 mM, 7.4,v/v) 3:7 v/v) further investigated. As shown in Figure 1B. displayed a strong green fluorescence emission at 513 nm (Φ = 0.535). The fluorescence emission at HNA displayed a strong green fluorescence emission at 513 nm (Φ1 = 0.535). The fluorescence 1 2+ 513 nm of at HNA could(10 be more than 95% quenched the quenched presence ofin35the µMpresence Cu (Φ2of=35 0.092), emission 513 (10 nmµM) of HNA μM) could be more thanin 95% μM which be ascribed to the be aparamagnetic quenching effect of Cu2+ [56].effect Job’sofplot reveals that 2 = 0.092), which could ascribed to the aparamagnetic quenching Cu2+ [56]. Job’s Cu2+ (Φcould HNA forms athat 1:1 stoichiometry with Cu2+complex (Figure S3). According to linear plot reveals HNA forms acomplex 1:1 stoichiometry with Cu2+ (Figure S3). Benesie-Hildebrand According to linear expression, the measured fluorescence intensityfluorescence [1/(F0 –F)] atintensity 513 nm varied as aatfunction 1/[Cuas2+a] 513 nmof varied Benesie-Hildebrand expression, the measured [1/(F0–F)] 2 2+ and 2 = 0.9988), in a linear of relationship (R a= 0.9988), which further(Rindicating the 1:1 stoichiometry between Cuthe function 1/[Cu2+] in linear relationship which further indicating 1:1 2+ and HNA HNA (Figure S4) [57]. The constant Cu2+ in HEPES buffered was calculated to stoichiometry between Cuassociation (Figure of S4)HNA [57]. with The association constant of HNA with Cu2+ in be 1.59 ˆbuffered 105 M´1was . Thecalculated fluorescence intensity HNA at 513 nmintensity exhibitedchanges a linear of correlation HEPES to be 1.59 × changes 105 M−1. of The fluorescence HNA at 2+ in the concentration range from 02+to 3.5 µM (R2 = 0.9957) (Figure S5). The detection to limit 513Cu nm exhibited a linear correlation to Cu in the concentration range from 0 to 3.5 μM (R2 = 0.9957) 2+ 2+ for Cu S5). wasThe estimated to limit be 15for nMCu based a 3σ/slope the experimental conditions wasonestimated to under be 15 nM based on a 3σ/slope underused the (Figure detection 2+ in drinking water (20 µM) set by2+the here [58], which is below the maximum level ofthe Cumaximum experimental conditions used here [58],permissive which is below permissive level of Cu in U.S. Environmental Protection Agency drinking water (20 μM) set by the U. S. [59]. Environmental Protection Agency [59]. The fluorescence response of HNA towards various metals ions was then examined in HEPES buffer. As As shown shown in Figures Figures S6 and S7, no obvious changes in UV-Vis absorption and color were 3+, observed when the HNA in HEPES solution was was added added other other competitive competitive metal metal ions, ions, including including Fe Fe3+ 2+ 2+ 2+ 2+ 2+ 2+ 2+ 3+ + 2+ 2+ 2+ + + + 2+, Zn 2+, Ni 2+, Mg 2+, Li,+,Ba Hg2+,,Cd Cd2+, Pb , Pb , Zn , 2+Ni Cr +, ,Ca Ag , Ca2+, Ba , Mg , Li Na , K+,,indicating and Na , indicating , Co,2+Co , Mn,2+Mn , Cr3+, Ag K+, and that HNA 2+ -specific colorimetric chemosensor in aqueous 2+ that HNA could be used as a potential candidate for Cu could be used as a potential candidate for Cu -specific colorimetric chemosensor in aqueous media. media. Furthermore, also showed a selective fluorescence quenching onlywith withCu Cu2+2+among among the Furthermore, HNA HNA also showed a selective fluorescence quenching only various metal ions under similar testing conditions. Upon addition of competitive cations (30 μM) µM) to the solution of HNA (10 μM), µM), the quenching rate of the emission intensities at 513 nm was was evaluated, evaluated, and the result was displayed displayed in Figure Figure 2. 2. It was found that no significant changes of fluorescence 2+ , Cd2+2+ , Pb 2+ , 2+ 2+3+, Cr3++, Ag+ and 3+ , Hg2+ 2+,2+ 2+, 2+ intensities occurred in , Zn , Ni Co Mn in the the presence presence of ofFe Fe3+ , Cd , Pb2+2+ , Zn Ni Co, 2+ , Mn , Cr , Ag and Ca2+, 2+ 2+ 2+ + + + 2+ 2+ + + + Ca , Ba Na . In addition, it isthat notable that the fluorescence to a Mg , Mg Ba , Li , K ,, Li Na, .KIn, addition, it is notable the fluorescence responseresponse of HNA of to HNA a mixture 2+ 2+ mixture containing all chosen of the chosen is similar to that only.The Theresult resultindicates indicates that only. containing all of the metalmetal ions ions is similar to that to to CuCu 2+-specfic Cu2+ -specficresponses responses were were not not disturbed disturbed by by competitive competitive metal metal ions.
Sensors 2016, 16, 79 Sensors 2016, 16, 79
6 of 14 6 of 14
Figure 2. Normalized Normalizedfluorescence fluorescenceresponses responses HNA to various cations in DMF-HEPES Figure 2. of of HNA (10 (10 µM)μM) to various cations in DMF-HEPES buffer buffer (20 mM, pH = 7.4, 3:7 v/v). The red bars represent the emission changes in the (20 mM, pH = 7.4, 3:7 v/v). The red bars represent the emission changes of HNA inof theHNA presence of presence cations(all of interest (all are μM).bars Therepresent green barsthe represent changes of the emission cations ofofinterest are 30 µM). The30 green changesthe of the emission that occurs the above solution. Thewere intensities were that upon the subsequent addition of above Cu2+ tosolution. 2+ μM uponoccurs the subsequent addition of 30 µM of of Cu30 to the The intensities recorded at recorded at 513 nm, excitation at 411 nm. 513 nm, excitation at 411 nm.
3.2. Spectra Recognition of Thiols by HNA-Cu2+ Ensemble 3.2. Spectra Recognition of Thiols by HNA-Cu2+ Ensemble Considering the high copper-sulfur affinity, we are encouraged to envision that the obtained Considering the high copper-sulfur affinity, we are encouraged to envision that the obtained sluggish HNA-Cu2+ system fluorescence could be employed as a promising chemosensor for sluggish HNA-Cu2+ system fluorescence could be employed as a promising chemosensor for 2+ displacement approach. To confirm our fluorescence “OFF–ON” detection of biothiols via Cu2+ fluorescence “OFF–ON” detection of biothiols via Cu displacement approach. To confirm our assumption, the selectivity of the HNA-Cu2+ ensemble for a variety of relevant biological species assumption, the selectivity of the HNA-Cu2+ ensemble for a variety of relevant biological species such as natural aminoacids and bioactive thiols was firstly evaluated by fluorescence titration. The such as natural aminoacids and bioactive thiols was firstly evaluated by fluorescence titration. HNA-Cu2+ solution was prepared in situ by addition of 3.0 equiv. of Cu2+ to HNA (10 μM) in The HNA-Cu2+ solution was prepared in situ by addition of 3.0 equiv. of Cu2+ to HNA (10 µM) DMF-HEPES buffer (20 mM, pH = 7.4, 3:7 v/v). Figure 3 shows the ratio of fluorescence intensity in DMF-HEPES buffer (20 mM, pH = 7.4, 3:7 v/v). Figure 3 shows the ratio of fluorescence enhancement (F/F0) at 513 nm upon addition of various bioactive species (40 μM). A 47.8-fold intensity enhancement (F/F0 ) at 513 nm upon addition of various bioactive species (40 µM). A fluorescence enhancement of HNA-Cu2+ was observed when 40 μM Hcy was finally added (Φ3 = 47.8-fold fluorescence enhancement of HNA-Cu2+ was observed when 40 µM Hcy was finally added 0.486). Furthermore, the addition of Cys and GSH into HNA-Cu2+ in2+ HEPES solution led to (Φ3 = 0.486). Furthermore, the addition of Cys and GSH into HNA-Cu in HEPES solution led significant enhancement in fluorescence intensity of HNA-Cu2+2+ : i.e., Cys (42.2-fold) and GSH to significant enhancement in fluorescence intensity of HNA-Cu : i.e., Cys (42.2-fold) and GSH 2+ increased to 0.464 (Φ4) and 0.422 (Φ5), (36.2-fold). Concomitantly, the quantum yield of HNA-Cu2+ (36.2-fold). Concomitantly, the quantum yield of HNA-Cu increased to 0.464 (Φ4 ) and 0.422 (Φ5 ), respectively. In contrast, other aminoacids such as II-Leu, Ala, Arg, Asn, Asp, Gln, Glu, Gly, His, respectively. In contrast, other aminoacids such as II-Leu, Ala, Arg, Asn, Asp, Gln, Glu, Gly, His, Leu, Lys, Met, Phe, Pro, Ser, Thr, Try and Val induced negligible fluorescence intensity changes. In Leu, Lys, Met, Phe, Pro, Ser, Thr, Try and Val induced negligible fluorescence intensity changes. addition, no significant changes of the fluorescence intensities of HNA-Cu2+ were observed in the In addition, no significant changes of the fluorescence intensities of HNA-Cu2+ were observed in presence of other low-molecular weight thiols and sulfide, such as methyl mercaptan, ethyl the presence of other low-molecular weight thiols and sulfide, such as methyl mercaptan, ethyl mercaptan, 1,3-dimercaptopropane and S22−´. These results demonstrate that HNA-Cu2+ has an mercaptan, 1,3-dimercaptopropane and S . These results demonstrate that HNA-Cu2+ has an excellent selectivity toward biological thiols, including Hcy, Cys, GSH. The co-operative effect of the excellent selectivity toward biological thiols, including Hcy, Cys, GSH. The co-operative effect of thiol–amino–carboxylic acid moiety as a ligand to Cu2+ could be a possible factor for the selectivity to the thiol–amino–carboxylic acid moiety as a ligand to Cu2+ could be a possible factor for the selectivity biological thiols of HNA-Cu2+. 2+ to biological thiols of HNA-Cu . 2+ towards biothiols was then investigated by The turn on fluorescence response of HNA-Cu2+ The turn on fluorescence response of HNA-Cu towards biothiols was then investigated by 2+ addition of Cys, Hcy, and GSH to HNA-Cu2+ in HEPES solution. As shown in Figure 4A,D, upon addition of Cys, Hcy, and GSH to HNA-Cu in HEPES solution. As shown in Figure 4A,D, upon 2+ solution increased addition of increasing amounts of Hcy, the fluorescence intensity of HNA-Cu2+ addition of increasing amounts of Hcy, the fluorescence intensity of HNA-Cu solution increased gradually and the emission intensity at 513 nm reached a maximum level when 40 equiv. of Hcy was gradually and the emission intensity at 513 nm reached a maximum level when 40 equiv. of Hcy was added. Similar fluorescence recovery results were observed in the tests of Cys and GSH (Figure 4B–D). added. Similar fluorescence recovery results were observed in the tests of Cys and GSH (Figure 4B–D). 2+ is linearly proportional to Hcy concentration of The relative fluorescence intensity of HNA-Cu2+ The relative fluorescence intensity of HNA-Cu is linearly proportional to Hcy concentration of 0–3.5 μM, and the detection limit for Hcy was estimated to be as low as 1.5 μM (Figure 5). The 0–3.5 µM, and the detection limit for Hcy was estimated to be as low as 1.5 µM (Figure 5). The detection limits of HNA-Cu2+ for Cys and GSH were calculated to be 1.0 μM and 0.8 μM, respectively (Figures S8 and S9). These results demonstrate that HNA-Cu2+ is sensitive enough for its practical applications in determination of biothiols in biological fluids [60–62].
Sensors 2016, 16, 79
7 of 14
detection limits of HNA-Cu2+ for Cys and GSH were calculated to be 1.0 µM and 0.8 µM, respectively (Figures S8 and S9). These results demonstrate that HNA-Cu2+ is sensitive enough for its practical applications in determination of biothiols in biological fluids [60–62]. Sensors 2016, 16, 79 7 of 14 Sensors 2016, 16, 79
7 of 14
Figure 3. Normalized fluorescence responses of HNA-Cu2+ (10 μM) to various amino acid (40 μM) in
2+ (10 µM) to various amino acid (40 µM) Figure 3. Normalized fluorescence DMF-HEPES buffer (20 mM, pH =responses 7.4, 3:7 v/v).of 1. HNA-Cu II-Leu, 2.Ala, 3. Arg, 4. Asn, 5. Asp, 6. Gln, 7. Glu, 8. 2+ (10 μM) to various amino acid (40 μM) in Figure 3. Normalized fluorescence responses of HNA-Cu in DMF-HEPES buffer (20 = 7.4, v/v). 1. II-Leu, 2.Ala, 5. Asp, 6. Gln, 7. Gly, 9. His,10. Leu, 11.mM, Lys, pH 12. Met, 13.3:7 Phe, 14. Pro, 15. Ser, 16. Thr,3.17.Arg, Try, 4. 18.Asn, Val, 19. Methyl DMF-HEPES buffer (20mercaptan, mM, pH = 21. 3:7 v/v). 1. II-Leu, 2.Ala, 5. Asp, Gln, 7. Glu, 8. 2−, 23.4.GSH, Cys, 25. Hcys. The mercaptan, 20. Ethyl 1,3-Dimercaptopropane, 22.3.Ser, SArg, Glu, 8. Gly, 9. His,10. Leu, 11. Lys, 12.7.4, Met, 13. Phe, 14. Pro, 15. 16. Asn, Thr, 24. 17. Try,6. 18. Val, 19. Methyl Gly, 9. His,10. Leu, 11. Lys, 12. Met, 13. Phe, 14. Pro, 15. Ser, 16. Thr, 17. Try, 18. Val, 19. Methyl 2´ intensities were mercaptan, recorded at 513 excitation at 411 nm. mercaptan, 20. Ethyl 21.nm, 1,3-Dimercaptopropane, 22. S , 23. GSH, 24. Cys, 25. Hcys. The mercaptan, 20. Ethyl mercaptan, 21. 1,3-Dimercaptopropane, 22. S2−, 23. GSH, 24. Cys, 25. Hcys. The intensities were recorded at 513 nm, excitation at 411 nm.
intensities were recorded at 513 nm, excitation at 411 nm.
Figure 4. Fluorescence emission spectra of HNA-Cu2+ (10 μM) in DMF-HEPES buffer (20 mM, pH = 7.4, 3:7 v/v) in the presence of 0–40 μM (A) Hcy; (B) Cys and (C) GSH. (D) The plots of the fluorescence intensities of HNA-Cu2+ (10 μM) observed at 513 nm versus thiol concentration (0–40 μM). Excitation was at 411emission nm. Figure performed 4. Fluorescence spectra of HNA-Cu2+ (10 μM) in DMF-HEPES buffer (20 mM, pH = 7.4,
Figure 4. Fluorescence emission spectra of HNA-Cu2+ (10 µM) in DMF-HEPES buffer (20 mM, pH = 7.4, 3:7 v/v) in the presence of 0–40 μM (A) Hcy; (B) Cys and (C) GSH. (D) The plots of the fluorescence 2+ to detect biothiols in HEPES aqueous buffer was also evaluated by The capability of HNA-Cu 3:7 v/v) in the presence of 0–40 µM (A) Hcy; (B) Cys and (C) GSH. (D) The plots of the fluorescence intensities of HNA-Cu2+ (10 μM) observed at 513 nm versus thiol concentration (0–40 μM). Excitation 2+ the measurement of the corresponding UV-Vis absorption spectra. As shown (0–40 in Figure upon intensities of HNA-Cu (10 µM) observed at 513 nm versus thiol concentration µM).6,Excitation was performed at 411 nm. addition of increasing amounts of Hcy, the absorption band at 475 nm faded gradually with the was performed at 411 nm. concomitant increase of the absorption at 411 nm. The final absorption spectrum is identicaaal to that The capability of HNA-Cu2+ to detect biothiols in HEPES aqueous buffer was also evaluated by of HNA under identical conditions. Upon the addition of Cys and GSH similar UV-Vis spectroscopic the measurement the corresponding absorption spectra. As shown was in Figure evaluated 6, upon by 2+ to detectUV-Vis 2+ were observed Thechanges capability of of HNA-Cu in HEPES aqueous of HNA-Cu tobiothiols those encountered using Hcy buffer (Figures S10also and S11). addition of increasing amounts of Hcy, the 2+absorption band at 475 nm faded gradually with the the measurement the corresponding UV-Vis absorption Asupon shown in Figure upon addition Meanwhile,of the yellow solution of HNA-Cu returned tospectra. yellowish the addition of6, biothiols, concomitant increase of the2+absorption at 411 nm.asThe final absorption spectrum is identicaaal to that indicating that HNA-Cu ensemble can serve thiol gradually indicator inwith aqueous of increasing amounts of Hcy, the absorption bandaat“naked-eye” 475 nm faded the media concomitant of HNA under identical conditions. Upon the addition of Cys and GSH similar UV-Vis spectroscopic increase of the at 411observed nm. Thetofinal spectrum is identicaaal thatS11). of HNA changes of absorption HNA-Cu2+ were thoseabsorption encountered using Hcy (Figures S10toand underMeanwhile, identical conditions. Upon the addition2+of Cys and similar UV-Vis spectroscopic changes the yellow solution of HNA-Cu returned to GSH yellowish upon the addition of biothiols, 2+ indicating that HNA-Cu ensemble can serve as a “naked-eye” thiol indicator in aqueous media
Sensors 2016, 16, 79
8 of 14
of HNA-Cu2+ were observed to those encountered using Hcy (Figures S10 and S11). Meanwhile, the yellow solution of HNA-Cu2+ returned to yellowish upon the addition of biothiols, indicating 2+ ensemble can serve as a “naked-eye” thiol indicator in aqueous media (Figure 7). that HNA-Cu Sensors 2016, 16, 79 8 of 14 In addition, the selectivity of HNA-Cu2+ ensemble towards biothiols was further investigated by Sensors 2016, 16, 79 8 of 14 2+ ensemble towards biothiols was further (Figure 7). InAs addition, selectivity of HNA-Cu UV-Vis spectroscopy. shown the in Figure 7, changes of UV-Vis spectra only occurred upon the addition Sensors 2016, 16, 79 of 14 investigated by UV-Vis spectroscopy. As shown in2+Figure 7, changes of2+UV-Vis spectra 8only (Figure 7). In Hcy, addition, selectivity of HNA-Cu ensemble towards biothiols further selectivity of biothiols, including Cys,the and GSH, demonstrating that HNA-Cu has anwas excellent occurred upon the addition of biothiols, including Hcy, Cys, and GSH, demonstrating that investigated by addition, UV-Vis spectroscopy. Asofshown in 2+Figure 7, changes of biothiols UV-Vis spectra only (Figure 7). In selectivity HNA-Cu ensemble towards was further 2+ has toward thiols. HNA-Cu an excellentthe selectivity toward thiols. occurred upon addition of biothiols, including Hcy, Cys, and GSH, demonstrating that investigated by the UV-Vis spectroscopy. As shown in Figure 7, changes of UV-Vis spectra only 2+ has an excellent selectivity toward thiols. HNA-Cu occurred upon the addition of biothiols, including Hcy, Cys, and GSH, demonstrating that HNA-Cu2+ has an excellent selectivity toward thiols.
Figure 5. The linear responses of HNA-Cu2+ (3 μM) versus low concentration Hcy (0–17 μM) at 513 nm.
Figure 5. The linear responses of HNA-Cu2+ (3 µM) versus low concentration Hcy (0–17 µM) at 513 nm. Excitation was performed at 411 nm. Figure 5. The linear responses of HNA-Cu2+ (3 μM) versus low concentration Hcy (0–17 μM) at 513 nm. Excitation was performed at 411 nm. Excitation was performed at 411 nm. Figure 5. The linear responses of HNA-Cu2+ (3 μM) versus low concentration Hcy (0–17 μM) at 513 nm. Excitation was performed at 411 nm.
Figure 6. UV-Vis absorption spectra of HNA-Cu2+ (10 μM) in the presence of increasing amount of Hcy (40 μM) in DMF-HEPES buffer (20 mM, pH =2+ 7.4, 3:7 v/v). Figure 6. UV-Vis absorption spectra of HNA-Cu (10 μM) in the presence of increasing amount of Figure 6. UV-Vis absorption spectra of HNA-Cu2+ (10 µM) in the presence of increasing amount Hcy (40 μM) in DMF-HEPES buffer (20 mM, pH =2+7.4, 3:7 v/v). Figure 6. UV-Vis absorption spectra of HNA-Cu (10 μM) in the presence of increasing amount of Hcy (40 µM) in DMF-HEPES buffer (20 mM, pH = 7.4, 3:7 v/v). Hcy (40 μM) in DMF-HEPES buffer (20 mM, pH = 7.4, 3:7 v/v).
of
Figure 7. Absorption spectra of HNA-Cu2+ (10 μM) in DMF-HEPES buffer (20 mM, pH = 7.4, 3:7 v/v) upon addition of various amino acid and thiols (40 μM). Insert: Colorimetric changes of HNA-Cu2+ Figure 7. Absorption spectra of HNA-Cu2+ (10 μM) in DMF-HEPES buffer (20 mM, pH = 7.4, 3:7 v/v) (a) in the presence of (b) Hcy, (c) Cys snd (d) GSH in HEPES buffer. upon addition of various amino acid and2+thiols (40 μM). Insert: Colorimetric changes of HNA-Cu2+ Figure 7. Absorption spectra of HNA-Cu (10 μM) in DMF-HEPES buffer (20 mM, pH = 7.4, 3:7 v/v) 2+ (10 Figure 7. Absorption spectra HNA-Cu µM)inin DMF-HEPES buffer (20 mM, pH = 7.4, 3:7 v/v) (a) in the presence of (b)of Hcy, (c) Cys snd (d) GSH HEPES buffer. upon addition of various amino acid and thiols (40 μM). Insert: Colorimetric changes of HNA-Cu2+ 2+ upon addition of various amino acid and thiols (40inµM). Insert: (a) in the presence of (b) Hcy, (c) Cys snd (d) GSH HEPES buffer. Colorimetric changes of HNA-Cu
(a) in the presence of (b) Hcy, (c) Cys snd (d) GSH in HEPES buffer.
Sensors 2016, 16, 79 Sensors 2016, 16, 79
9 of 14 9 of 14
Reversibility Reversibility is is also also one one of of the the most most important important factors factors that that should should be be considered considered for for the the development of chemosensors for the detection of analytes in practical applications. In the present development of chemosensors for the detection of analytes in practical applications. In the present work, work, the the reversibility reversibility of ofthe theHNA-Cu HNA-Cu2+2+ ensemble ensemble in in sensing sensing biothiols biothiols has has been been demonstrated demonstrated by by 2+ followed by biothiols. As shown in Figure carrying carryingout outalternate alternatecycles cyclesof oftitration titrationof ofHNA HNAwith withCu Cu2+ Figure 8, 8, 2+ /Hcy, 2+ by the sequential addition of Cu it was found that “ON´OFF´ON” changes in the fluorescence by the sequential addition of Cu /Hcy, it was found that “ON−OFF−ON” changes in the 2+ at 513 nm can 2+ can intensity of HNA-Cu be513 repeated more than five times, indicating that HNA-Cu fluorescence intensity of HNA-Cu2+ at nm can be repeated more than five times, indicating that 2+ can be developed as abe reversible fluorescence chemosensor for Hcy detection. As expected, fluorescence HNA-Cu developed as a reversible fluorescence chemosensor for Hcythedetection. As 2+ emission be turned off andalso on repeatedly with the addition ofwith Cu the and Cys or expected,also the could fluorescence emission could be turned offalternate and on repeatedly alternate 2+ system can be developed as a regeneratable GSH, indicating theCys HNA-Cu turn-on addition of Cu2+that and or GSH, indicating that the HNA-Cu2+ system canfluorescence be developed as a probe for biothiols (Figures S12 and S13). regeneratable fluorescence turn-on probe for biothiols (Figures S12 and S13).
2+ (10 μM) at 513 nm in DMF-HEPES buffer (20 mM, pH = Figure 8. 8. Fluorescent Figure Fluorescentintensities intensitiesofofHNA-Cu HNA-Cu2+ (10 µM) at 513 nm in DMF-HEPES buffer (20 mM, 2+ with several concentrations ratio (0:0, 20:0, 20:40, 7.4,=3:7 v/v) the alternate addition of Hcy/Cu 2+ with several concentrations ratio (0:0, 20:0, pH 7.4, 3:7upon v/v) upon the alternate addition of Hcy/Cu 80:40, 80:160, 160:160, 160:320, 320:320, 320:640, 640:640 μM, Excitation at 411atnm. 20:40, 80:40, 80:160, 160:160, 160:320, 320:320, 320:640, 640:640 respectively). µM, respectively). Excitation 411 nm.
ESI-MS analysis of HNA sequentially in the presence of Cu2+ and thiols was further undertaken ESI-MS analysis of HNA sequentially in the presence of Cu2+ and thiols was further undertaken to to verify the fluorescence “ON−OFF−ON” reversible interconversion states. ESI-MS of HNA verify the fluorescence “ON´OFF´ON” reversible interconversion states. ESI-MS of HNA displayed a2+ displayed a molecular-ion peak [HNA − H]+ at m/z 339.1 (Figure S14). When three equiv. of Cu + molecular-ion peak [HNA ´ H] at m/z 339.1 (Figure S14). When three equiv. of Cu2+ were added into were added into the HNA solution, the peak at m/z 401.08 was appeared, which can be assignable to the HNA solution, the peak at m/z 401.08 was appeared, which can be assignable to a [HNA + Cu2+ ]+ a [HNA + Cu2+]+ species (Figure S15). This result confirmed formation of a 1:1 stoichiometry complex species (Figure S15). This result confirmed formation of a 1:1 stoichiometry complex between HNA between HNA and Cu2+. With further addition of thiols, e.g., 40 μM Hcy, the peaks at m/z 401.08 2+ of 2+ and Cu . With further addition of thiols, e.g., 40 µM Hcy, the peaks at m/z 401.08 of the HNA-Cu the HNA-Cu2+ ensemble disappeared, and the peak at m/z 339.05 related to the native HNA was ensemble disappeared, and the peak at m/z 339.05 related to the native HNA was observed again observed again (Figure S16), indicating that the binding between Hcy and Cu2+ led to the release (Figure S16), indicating that the binding between Hcy and Cu2+ led to the release of HNA. of HNA. 3.3. Living-Cell Fluorescence Imaging Studies 3.3. Living-Cell Fluorescence Imaging Studies Prior to the microscopy imaging of biothiols in live cells, the long-term cytotoxicity of HNA to the Prior to the microscopy imaging of biothiols in live cells, the long-term cytotoxicity of HNA to human lung cancer cell A549 was evaluated using the MTT assay method [63,64]. Figure 9 presents the human lung cancer cell A549 was evaluated using the MTT assay method [63,64]. Figure 9 the results of A549 cells incubated with different concentrations of HNA (0, 2, 4, 6, 8, 10, 15 and 25 µM) presents the results of A549 cells incubated with different concentrations of HNA (0, 2, 4, 6, 8, 10, 15 for 24 h. A549 cell viabilities remained approximately at 78% even at the high concentration of 25 µM and 25 μM) for 24 h. A549 cell viabilities remained approximately at 78% even at the high for 24 h. The results demonstrated that HNA has low cytotoxicity both at low and high concentration. concentration of 25 μM for 24 h. The results demonstrated that HNA has low cytotoxicity both at low and high concentration.
Sensors 2016, Sensors 2016, 16,16, 79 79 Sensors 2016, 16, 79
1010 of of 14 14 10 of 14
Figure Cellviability viability values (%) estimated estimated by MTT proliferation test incubation Figure 9. Cell viability valuesvalues (%) estimated by a MTT proliferation test versus incubation Figure 9. 9. Cell (%) by aa MTT proliferation test versus versusconcentrations. incubation ˝ concentrations. A549 cells were incubated in the HNA-containing culture medium at 37 °C A549 cells were incubated inwere the HNA-containing culture medium at 37 Cmedium in a 5% at CO37 concentrations. A549 cells incubated in the HNA-containing culture °Cinina 5% a 5%for 2 incubator 2 incubator for 24 h. 24 CO h. CO 2 incubator for 24 h.
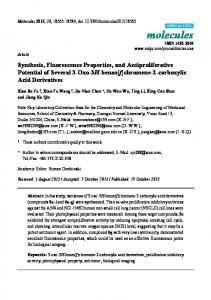
Typically, free intracellular Cys concentrations are on the order of 30–200 μM, and GSH is the Typically, intracellular Cys concentrations order of 30–200 μM, and GSH is the Typically, freefree intracellular concentrations areare on on thethe order of 30–200 GSH is the most abundant among the Cys small intracellular molecular thiols (1–10 mM).µM, To and demonstrate themost most abundant among the small intracellular molecular thiols (1–10 mM). To demonstrate the 2+ abundant among the small intracellular molecular thiols (1–10 mM). To demonstrate the capability capability of HNA-Cu ensemble for the detection of biothiols in living cells, fluorescence of 2+ ensemble for the detection of biothiols in living cells, fluorescence capability of HNA-Cu 2+ ensemble for the detection of biothiols in living cells, fluorescence microscopy imaging HNA-Cu microscopy imaging studies were conducted in the human lung cancer cell A549. The A549 cells microscopy imaging studies were conducted in the human lung cancer cell A549. The A549 cells were incubated with in a 10the μMhuman solution of HNA-Cu in PBS for The 30 min in acells 37 °Cwere incubator. Then the studies were conducted lung cancer2+2+cell A549. A549 incubated with a were incubated with a 10 μM solution of HNA-Cu in PBS for 30 min in a 37 °C incubator. Then the 2+ ˝ cells were washed with PBS three times and mounted on a microscope stage. As shown in Figure 10, 10 µM solution of HNA-Cu in PBS for 30 min in a 37 C incubator. Then the cells were washed cells were washed with PBS green three times and mounted onHowever, a microscope stage. experiment, As shown incells Figure the cells strong emission. in a control were10, with PBS threedisplayed times and mounted fluorescence on a microscope stage. As shown in Figure 10, the cells displayed thepre-treated cells displayed strong green fluorescence emission. However, in a control experiment, cells with N-ethylmaleimide (NEM, 1 mM, a trapping reagent for thiol species), followed were by strong green fluorescence emission. (NEM, However, in aa control experiment, cells species), were pre-treated by with pre-treated with mM, trapping reagent for thiol 2+. A1 sluggish the incubationN-ethylmaleimide of cells with HNA-Cu fluorescence pattern was exhibited followed inside the N-ethylmaleimide 1 mM, a trapping for thiol species), followed by the incubation 2+. A2+ reagent thecells, incubation of(NEM, cellsspecificity with HNA-Cu sluggish fluorescence was exhibited the of indicating the of HNA-Cu for biological thiols overpattern other bioactive analytes inside in living 2+ . A sluggish fluorescence pattern was exhibited inside the cells, indicating the cells with HNA-Cu 2+ cells, indicating the specificity of HNA-Cu for biological thiols over other bioactive analytes in living cells. specificity of HNA-Cu2+ for biological thiols over other bioactive analytes in living cells. cells.
Figure 10. Live cell imaging of human lung cancer cell A549 at 37 °C. (A) A549 cells incubated with 10 μM HNA-Cu2+ for 30 min; (B) A549 cells were pre-incubated with 1 mM NEM for 30 min and then 2+ for another 30 min; (C) and (D) are the corresponding brightfield treated with 10 μM HNA-Cu Figure Live cell imaging human lungcancer cancer cell cell A549 A549 at with ˝ C.(A) Figure 10.10. Live cell imaging ofofhuman lung at 37 37 °C. (A)A549 A549cells cellsincubated incubated with 2+ images. Excitation with blue light. 10 μM HNA-Cu 2+ for 30 min; (B) A549 cells were pre-incubated with 1 mM NEM for 30 min and then
10 µM HNA-Cu for 30 min; (B) A549 cells were pre-incubated with 1 mM NEM for 30 min and another 30 min; (C) and (D) are the corresponding brightfield treated with 10 μM HNA-Cu2+ for then treated with 10 µM HNA-Cu2+ for another 30 min; (C) and (D) are the corresponding brightfield images. Excitation with blue light. images. Excitation with blue light.
Sensors 2016, 16, 79
11 of 14
4. Conclusions In conclusion, we have developed an aldazine-based fluorescence chemosensor, HNA, for the sequential detection of Cu2+ and biological thiols (Hcy, Cys and GSH) in aqueous solution and living cells. The binding of Cu2+ and HNA was found to follow a 1:1 stoichiometry, accompanied with a significant fluorescence quenching. The quenched fluorescence of the HNA-Cu2+ ensemble could be recovered upon the addition of thiols, realizing the detection of thiols by utilizing Cu2+ displacement approach. Fluorescence microscopy imaging suggested that HNA-Cu2+ ensemble has potential as a powerful tool for the detection of thiols in living cells. In summary, the success of this chemosensing ensemble not only provides a robust approach to detect biothiols in live cells, but also extends the development of displacement strategy-based fluorescence chemosensors. Acknowledgments: This work is supported by the National Natural Science Foundation of China (No. 21542017), the Key Laboratory Program of Educational Department of Liaoning Province (LZ2015047), the Program for Liaoning Excellent Talents in University (No. LR2014009) and the National Natural Science Foundation of China (No. 21371148). Author Contributions: Qingtao Meng and Zhiqiang Zhang conceived and designed the experiments; Hongmin Jia, Ming Yang and Yue Wang performed the experiments; Zhizhi Hu analyzed the data; Guangjie He contributed reagents/materials/analysis tools; Qingtao Meng and Run Zhang wrote the paper. Conflicts of Interest: The authors declare no conflict of interest.
References 1. 2.
3.
4. 5. 6.
7. 8. 9. 10. 11. 12. 13.
Liu, J.; Xie, Y.-Q.; Lin, Q.; Shi, B.-B.; Zhang, P.; Zhang, Y.-M.; Wei, T.-B. Bioactive paper platform for colorimetric phenols detection. Sens. Actuators B Chem. 2013, 186, 657–662. [CrossRef] Gunnlaugsson, T.; Glynn, M.; Tocc, G.M.; Kruger, P.E.; Pfeffer, F.M. Anion recognition and sensing in organic and aqueous media using luminescent and colorimetric sensors. Coord. Chem. Rev. 2006, 250, 3094–3117. [CrossRef] Du, J.; Hu, M.; Fan, J.; Peng, X. Fluorescent chemodosimeters using “mild” chemical events for the detection of small anions and cations in biological and environmental media. Chem. Soc. Rev. 2012, 41, 4511–4535. [CrossRef] [PubMed] Chen, K.; Shu, Q.; Schmittel, M. Design strategies for lab-on-a-molecule probes and orthogonal sensin. Chem. Soc. Rev. 2015, 44, 136–160. [CrossRef] [PubMed] Kaur, N.; Kumar, S. Diastereo- and enantioselective aldol reaction of granatanone (pseudopelletierine). Tetrahedron 2011, 67, 9233–9439. [CrossRef] Gupta, V.K.; Singha, A.K.; Ganjalic, M.R.; Norouzic, P.; Faridbodc, F.; Mergu, N. Comparative study of colorimetric sensors based on newly synthesized Schiff bases. Sens. Actuators B Chem. 2013, 182, 642–651. [CrossRef] Nolan, E.M.; Lippard, S.J. Tools and Tactics for the Optical Detection of Mercuric Ion. Chem. Rev. 2008, 108, 3443–3480. [CrossRef] [PubMed] Gupta, V.K.; Prasad, R.; Kumar, A. Preparation of ethambutol–copper (II) complex and fabrication of PVC based membrane potentiometric sensor for copper. Talanta 2003, 60, 149–160. [CrossRef] Carter, K.P.; Young, A.M.; Palmer, A.E. Fluorescent Sensors for Measuring Metal Ions in Living Systems. Chem. Rev. 2014, 114, 4564–4601. [CrossRef] [PubMed] Hariharan, P.S.; Anthony, S.P. Substitutional group dependent colori/fluorimetric sensing of Mn2+ , Fe3+ and Zn2+ ions by simple Schiff base chemosensor. Spectrochim. Acta A 2015, 136, 1658–1665. [CrossRef] [PubMed] Grynkiewicz, G.; Poenie, M.; Tsien, R.Y. A new generation of Ca2+ indicators with greatly improved fluorescence properties. J. Biol. Chem. 1985, 260, 3440–3450. [PubMed] He, G.J.; Guo, D.; He, C.; Zhang, X.L.; Zhao, X.W.; Duan, C.Y. A Color-Tunable Europium Complex Emitting Three Primary Colors and White Light. Angew. Chem. Int. Ed. 2009, 48, 6132–6135. [CrossRef] [PubMed] Huang, J.; Xu, Y.; Qian, X. A red-shift colorimetric and fluorescent sensor for Cu2+ in aqueous solution: Unsymmetrical 4,5-diaminonaphthalimide with N-H deprotonation induced by metal ions. Org. Biomol. Chem. 2009, 7, 1299–1303. [CrossRef] [PubMed]
Sensors 2016, 16, 79
14. 15.
16.
17. 18. 19. 20.
21. 22. 23. 24. 25.
26. 27. 28. 29.
30. 31. 32.
33. 34. 35.
36.
12 of 14
Madhu, S.; Ravikanth, M. Boron-Dipyrromethene Based Reversible and Reusable Selective Chemosensor for Fluoride Detection. Inorg. Chem. 2014, 53, 1646–1653. [CrossRef] [PubMed] Lin, K.-K.; Wu, S.-C.; Hsu, K.-M.; Hung, C.-H.; Liaw, W.-F.; Wang, Y.-M. A N-(2-Aminophenyl)-5(dimethylamino)-1-naphthalenesulfonic Amide (Ds-DAB) Based Fluorescent Chemosensor for Peroxynitrite. Org. Lett. 2013, 15, 4242–4245. [CrossRef] [PubMed] Hu, B.; Hu, L.-L.; Chen, M.-L.; Wang, J.-H. A FRET ratiometric fluorescence sensing system for mercury detection and intracellular colorimetric imaging in live Hela cells. Biosens. Bioelectron. 2013, 49, 499–505. [CrossRef] [PubMed] Yin, C.; Huo, F.; Zhang, J.; Martínez-Míñez, R.; Yang, Y.; Lv, H.; Li, S. Thiol-addition reactions and their applications in thiol recognition. Chem. Soc. Rev. 2013, 42, 6032–6059. [CrossRef] [PubMed] Hyman, L.M.; Franz, K.J. Probing oxidative stress: Small molecule fluorescent sensors of metal ions, reactive oxygen species, and thiols. Coord. Chem. Rev. 2012, 256, 2333–2356. [CrossRef] [PubMed] Chen, X.; Zhou, Y.; Peng, X.; Yoon, J. Fluorescent and colorimetric probes for detection of thiols. Chem. Soc. Rev. 2010, 39, 2120–2135. [CrossRef] [PubMed] Lee, H.Y.; Choi, Y.P.; Kim, S.; Yoon, T.; Guo, Z.; Lee, S.; Swamy, K.M.K.; Kim, G.; Lee, J.Y.; Shin, I.; Yoon, J. Selective homocysteine turn-on fluorescent probes and their bioimaging applications. Chem. Commun. 2014, 50, 6967–6969. [CrossRef] [PubMed] Wood, Z.A.; Schroder, E.; Robin Harris, J.; Poole, L.B. Structure, mechanism and regulation of peroxiredoxins. Trends Biochem. Sci. 2003, 28, 32–40. [CrossRef] Pullela, P.K.; Chiku, T.; Carvan III, M.J.; Sem, D.S. Fluorescence-based detection of thiols in vitro and in vivo using dithiol probes. Anal. Biochem. 2006, 352, 265–273. [CrossRef] [PubMed] Rahman, I.; MacNee, W. Regulation of redox glutathione levels and gene transcription in lung inflammation: The rapeutic approaches. Free Radic. Biol. Med. 2000, 28, 1405–1420. [CrossRef] Voet, D.; Voet, J.G. Biochemistry, 2nd ed.; John Wiley & Sons: New York, NY, USA, 1995. Xue, S.; Ding, S.; Zhai, Q.; Zhang, H.; Feng, G. A readily available colorimetric and near-infrared fluorescent turn-on probe for rapid and selective detection of cysteine in living cells. Biosens. Bioelectron. 2015, 68, 316–321. [CrossRef] [PubMed] Zhang, H.; Zhang, C.; Liu, R.; Yi, L.; Sun, H. A highly selective and sensitive fluorescent thiol probe through dual-reactive and dual-quenching groups. Chem. Commun. 2015, 51, 2029–2032. [CrossRef] [PubMed] Stamler, J.S.; Slivka, A. Biological chemistry of thiols in the vasculature and in vascular-related disease. Nutr. Rev. 1996, 54, 1–30. [CrossRef] [PubMed] Shi, J.; Wang, Y.; Tang, X.; Liu, W.; Jiang, H.; Dou, W.; Liu, W. A colorimetric and fluorescent probe for thiols based on 1, 8-naphthalimide and its application for bioimaging. Dyes Pigm. 2014, 100, 255–260. [CrossRef] Barve, A.; Lowry, M.; Escobedo, J.O.; Huynh, K.T.; Hakuna, L.; Strongin, R.M. Differences in heterocycle basicity distinguish homocysteine from cysteine using aldehyde-bearing fluorophores. Chem. Commun. 2014, 50, 8219–8222. [CrossRef] [PubMed] Wu, G.Y.; Fang, Y.Z.; Yang, S.; Lupton, J.R.; Turner, N.D. Glutathione metabolism and its implications for health. J. Nutr. 2004, 134, 489–492. [PubMed] Shahrokhian, S. Lead Phthalocyanine as a Selective Carrier for Preparation of a Cysteine-Selective Electrode. Anal. Chem. 2001, 73, 5972–5978. [CrossRef] [PubMed] Hao, W.; McBride, A.; McBride, S.; Gao, J.P.; Wang, Z.Y. Colorimetric and near-infrared fluorescence turn-on molecular probe for direct and highly selective detection of cysteine in human plasma. J. Mater. Chem. 2011, 21, 1040–1048. [CrossRef] Su, D.; Teoh, C.L.; Sahu, S.; Das, R.K.; Chang, Y.-T. Live cells imaging using a turn-on FRET-based BODIPY probe for biothiols. Biomaterials 2014, 35, 6078–6085. [CrossRef] [PubMed] Liu, B.; Wang, J.; Zhang, G.; Bai, R.; Pang, Y. Flavone-Based ESIPT Ratiometric Chemodosimeter for Detection of Cysteine in Living Cells. ACS Appl. Mater. Interfaces 2014, 6, 4402–440. [CrossRef] [PubMed] Martínez-Sierra, J.G.; Sanz, F.M.; Espílez, P.H.; Santamaria-Fernandez, R.; Gayón, J.M.M.; Alonso, J.I.G. Evaluation of different analytical strategies for the quantification of sulfur-containing biomolecules by HPLC-ICP-MS: Application to the characterisation of 34 S-labelled yeast. J. Anal. Atom. Spectrom. 2010, 25, 989–997. [CrossRef] Brodbelt, J.S. Photodissociation mass spectrometry: New tools for characterization of biological molecules. Chem. Soc. Rev. 2014, 43, 2757–2783. [CrossRef] [PubMed]
Sensors 2016, 16, 79
37.
38.
39. 40. 41.
42.
43.
44. 45.
46. 47.
48. 49. 50.
51.
52.
53. 54. 55. 56.
13 of 14
Xiao, C.; Chen, J.; Liu, B.; Chu, X.; Wu, L.; Yao, S. Sensitive and selective electrochemical sensing of L-cysteine based on a caterpillar-like manganese dioxide–carbon nanocomposite. Phys. Chem. Chem. Phys. 2011, 13, 1568–1574. [CrossRef] [PubMed] Zhang, R.; Yu, X.; Yin, Y.; Ye, Z.; Wang, G.; Yuan, J. Development of a heterobimetallic Ru(II)–Cu(II) complex for highly selective and sensitive luminescence sensing of sulfide anions. Anal. Chim. Acta 2011, 691, 83–88. [CrossRef] [PubMed] Wang, H.; Zhou, G.; Mao, C.; Chen, X. A fluorescent sensor bearing nitroolefin moiety for the detection of thiols and its biological imaging. Dyes Pigm. 2013, 96, 232–263. [CrossRef] Hong, V.; Kislukhin, A.A.; Finn, M.G. Thiol-Selective Fluorogenic Probes for Labeling and Release. J. Am. Chem. Soc. 2009, 131, 9986–9994. [CrossRef] [PubMed] Hu, M.; Fan, J.; Li, H.; Song, K.; Wang, S.; Cheng, G.; Peng, X. Fluorescent chemodosimeter for Cys/Hcy with a large absorption shift and imaging in living cells. Org. Biomol. Chem. 2011, 9, 980–983. [CrossRef] [PubMed] Guo, F.; Tian, M.; Miao, F.; Zhang, W.; Song, G.; Liu, Y.; Yu, X.; Sun, J.Z.; Wong, W.-Y. Lighting up cysteine and homocysteine in sequence based on the kinetic difference of the cyclization/addition reaction. Org. Biomol. Chem. 2013, 11, 7721–7728. [CrossRef] [PubMed] Tang, B.; Xing, Y.; Li, P.; Zhang, N.; Yu, F.; Yang, G. A Rhodamine-Based Fluorescent Probe Containing a Se-N Bond for Detecting Thiols and Its Application in Living Cells. J. Am. Chem. Soc. 2007, 129, 11666–11667. [CrossRef] [PubMed] Li, M.; Wu, X.; Wang, Y.; Li, Y.; Zhu, W.; James, T.D. A near-infrared colorimetric fluorescent chemodosimeter for the detection of glutathione in living cells. Chem. Commun. 2014, 50, 1751–1753. [CrossRef] [PubMed] Das, P.; Mandal, A.K.; Reddy, U.G.; Baidy, M.; Ghosh, S.K.; Das, A. Designing a thiol specific fluorescent probe for possible use as a reagent for intracellular detection and estimation in blood serum: Kinetic analysis to probe the role of intramolecular hydrogen bonding. Org. Biomol. Chem. 2013, 11, 6604–6614. [CrossRef] [PubMed] Zheng, L.-Q.; Li, Y.; Yu, X.-D.; Xu, J.-J.; Chen, H.-Y. A sensitive and selective detection method for thiol compounds using novel fluorescence probe. Anal. Chim. Acta 2014, 850, 71–77. [CrossRef] [PubMed] Huo, F.-J.; Yang, Y.-T.; Su, J.; Sun, Y.-Q.; Yin, C.-X.; Yan, X.-X. Indicator approach to develop a chemosensor for the colorimetric sensing of thiol-containing water and its application for the thiol detection in plasma. Analyst 2011, 136, 1892–1897. [CrossRef] [PubMed] Zhang, D.Q. Highly selective colorimetric detection of cysteine and homocysteine in water through a direct displacement approach. Inorg. Chem. Commun. 2009, 12, 1255–1258. [CrossRef] Wang, Y.; Sun, H.; Hou, L.; Shang, Z.; Dong, Z.; Jin, W. 1,4-Dihydroxyanthraquinone–Cu2+ ensemble probe for selective detection of sulfide anion in aqueous solution. Anal. Methods 2013, 5, 5493–5500. [CrossRef] Lee, Y.H.; Park, N.; Park, Y.B.; Hwang, Y.J.; Kang, C.; Kim, J.S. Organelle-selective fluorescent Cu2+ ion probes: Revealing the endoplasmic reticulum as a reservoir for Cu-overloading. Chem. Comm. 2014, 50, 3197–3200. [CrossRef] [PubMed] You, Q.-H.; Lee, A.W.-M.; Chan, W.-H.; Zhu, X.-M.; Leung, K.C.-F. A coumarin-based fluorescent probe for recognition of Cu2+ and fast detection of histidine in hard-to-transfect cells by a sensing ensemble approach. Chem. Commun. 2014, 50, 6207–6210. [CrossRef] [PubMed] Meng, Q.; Jia, H.; Succar, P.; Zhao, L.; Zhang, R.; Duan, C.; Zhang, Z. A highly selective and sensitive ON–OFF–ON fluorescence chemosensor for cysteine detection in endoplasmic reticulum. Biosens. Bioelectron. 2015, 74, 461–468. [CrossRef] [PubMed] He, G.; Zhang, X.; He, C.; Zhao, X.; Duan, C. Ratiometric fluorescence chemosensors for copper(II) and mercury(II) based on FRET systems. Tetrahedron 2010, 66, 9762–9768. [CrossRef] Mañes, J.; Campillos, P.; Font, G. Extraction-spectrophotometric determination of hydrazine with 2-hydroxy-1-naphthaldehyde. Aanlyst 1987, 112, 1183–1184. [CrossRef] Jung, H.S.; Han, J.H.; Kim, Z.H.; Kang, C.; Kim, J.S. Coumarin-Cu(II) Ensemble-Based Cyanide Sensing Chemodosimeter. Org. Lett. 2011, 13, 5056–5059. [CrossRef] [PubMed] Choi, M.G.; Cha, S.; Lee, H.; Jeon, H.L.; Chang, S.-K. Sulfide-selective chemosignaling by a Cu2+ complex of dipicolylamine appended fluorescein. Chem. Comm. 2009, 47, 7390–7392. [CrossRef] [PubMed]
Sensors 2016, 16, 79
57.
58.
59. 60.
61.
62. 63. 64.
14 of 14
Zhang, R.; Son, B.; Dai, Z.; Ye, Z.; Xiao, Y.; Liu, Y.; Yuan, J. Highly sensitive and selective phosphorescent chemosensors for hypochlorous acid based on ruthenium(II) complexes. Biosens. Bioelectron. 2013, 50, 1–7. [CrossRef] [PubMed] Koteeswari, R.; Ashokkumar, P.; Malar, E.J.P.; Ramakrishnan, V.T.; Ramamurthy, P. Highly selective, sensitive and quantitative detection of Hg2+ in aqueous medium under broad pH range. Chem. Comm. 2011, 27, 7695–7697. [CrossRef] [PubMed] Dean, J.A. Langès Handbook of Chemistry, 15th ed.; McGraw-Hill: New York, NY, USA, 1999. Jung, H.S.; Han, J.H.; Pradhan, T.; Kim, S.; Lee, S.W.; Sessler, J.L.; Kim, T.W.; Kang, C.; Kim, J.S. A cysteine-selective fluorescent probe for the cellular detection of cysteine. Biomaterials 2012, 33, 945–953. [CrossRef] [PubMed] Son, S.-H.; Kim, Y.; Heo, M.B.; Lim, Y.T.; Lee, T.S. A fluorescence turn-on probe for the detection of thiol-containing amino acids in aqueous solution and bioimaging in cells. Tetrahedron 2014, 70, 2034–2039. [CrossRef] Hwang, C.; Sinskey, A.J.; Lodish, H.F. Oxidized redox state of glutathione in the endoplasmic reticulum. Science 1992, 257, 1496–1502. [CrossRef] [PubMed] Zhang, L.; Duan, D.; Liu, Y.; Ge, C.; Cui, X.; Sun, J.; Fang, J. Highly Selective Off–On Fluorescent Probe for Imaging Thioredoxin Reductase in Living Cells. J. Am. Chem. Soc. 2014, 136, 226–233. [CrossRef] [PubMed] Meng, Q.; Jia, H.; Gao, X.; Wang, Y.; Zhang, R.; Wang, R.; Zhang, Z. Reversible and Selective Fluorescence Detection of Histidine Using a Naphthalimide-Based Chemosensing Ensemble. Chem. Asian J. 2015, 10, 2411–2418. [CrossRef] [PubMed] © 2016 by the authors; licensee MDPI, Basel, Switzerland. This article is an open access article distributed under the terms and conditions of the Creative Commons by Attribution (CC-BY) license (http://creativecommons.org/licenses/by/4.0/).