Int. J. Mol. Sci. 2015, 16, 907-923; doi:10.3390/ijms16010907 OPEN ACCESS
International Journal of
Molecular Sciences ISSN 1422-0067 www.mdpi.com/journal/ijms Article
Development and Application of a Label-Free Fluorescence Method for Determining the Composition of Gold Nanoparticle–Protein Conjugates Dmitriy V. Sotnikov, Anatoly V. Zherdev and Boris B. Dzantiev * A.N. Bach Institute of Biochemistry, Russian Academy of Sciences, Leninsky Prospect 33, Moscow 119071, Russia; E-Mails:
[email protected] (D.V.S.);
[email protected] (A.V.Z.) * Author to whom correspondence should be addressed; E-Mail:
[email protected]; Tel./Fax: +7-495-954-3142. Academic Editor: Bing Yan Received: 2 December 2014 / Accepted: 18 December 2014 / Published: 31 December 2014
Abstract: A method was developed for determining the composition of the conjugates between gold nanoparticles and proteins based on the intrinsic fluorescence of unbound protein molecules. The fluorescence was evaluated after separation of the conjugates from the reaction mixture by centrifugation. Gold nanoparticles obtained using the citrate technique (average diameter 24 nm) were conjugated at pH 5.4 with the following four proteins: human immunoglobulin G (IgG), bovine serum albumin (BSA), recombinant streptococcal protein G (protein G), and Kunitz-type soybean trypsin inhibitor (STI). The compositions of these conjugates were determined using the developed method. The conjugate compositions were dependent on the concentration of the added protein, and in all cases reached saturation. The equilibrium dissociation constants of the gold nanoparticle conjugates with IgG, BSA, protein G, STI in the initial section of the concentration dependence curve were 4, 6, 10, and 15 nM, respectively. Close to saturation, the corresponding values were 25, 76, 175, and 100 nM, respectively. The maximal binding capacities of a single gold nanoparticle for IgG, BSA, Protein G, and STI were 52, 90, 500, and 550, respectively, which agrees well with the hypothesis of monolayer immobilization. Keywords: gold nanoparticles; protein conjugates; tryptophan fluorescence
Int. J. Mol. Sci. 2015, 16
908
1. Introduction Gold nanoparticles are widely used in various fields of biochemistry, medicine, and analytical chemistry because of their unique physical and chemical properties [1–6]. In most cases they are modified with proteins or nucleic acids before application [3,7,8]. The preparation of such complexes has resulted in high demand for the development and improvement of methods to characterize their composition and functional properties. Despite the intense development of this field of knowledge in recent decades, descriptions of the interactions between proteins and gold nanoparticles remain controversial. Some studies [9–11] state that proteins form a monolayer on the surface of gold nanoparticles, whereas other studies [12,13] describe a multilayer immobilization. De Roe et al. [14] found that protein A interacted with gold nanoparticles with an equilibrium dissociation constant of 343.9 nM. By contrast, Ghitescu et al. [15] found that the dissociation constant at low concentrations of protein A was 2.3 nM, and at high concentrations was 500–900 nM. Both these studies were performed using X-ray spectroscopy. Large differences (up to five orders of magnitude) among the dissociation constants have also been observed for gold nanoparticles with other proteins, such as bovine serum albumin (BSA) [11,14,16–18]. The question of cooperativity of the sorption of proteins on nanoparticles also remains unanswered. Data obtained by Lacerda et al. [12] demonstrate that the process of sorption of serum proteins on gold nanoparticles can be characterized by both positive and negative cooperativity depending on the size of the nanoparticles. For example, insulin demonstrates a positive cooperativity for sorption on gold particles with a diameter of 100 nm (Hill coefficient 3.64), and negative cooperativity for particles with a diameter of 20 nm (Hill coefficient 0.63). Because of these uncertainties, a detailed characterization of colloidal conjugates with proteins is required. There are many analytical methods currently available for determining the composition of these conjugates [19]. To obtain accurate information, label-free is preferred because of labeling of any molecule leads to changes in its properties. A label-free method also reduces the number of sample preparation steps, which is desirable as additional steps increase the error in the final value. Tryptophan fluorescence is a promising method for studying the interaction of proteins with nanoparticles because it is present in almost all proteins. This method has been exclusively applied as detection of tryptophan fluorescence caused by the interaction of proteins with nanoparticles [12,18–22]. However, it is known that quenching of the fluorophore by nanoparticles, including gold nanoparticles, is a complex multifactorial process with non-linear dependencies, and in some cases enhancement of the fluorescence is observed instead of quenching [23]. This could have caused the large differences observed among the dissociation constants (range 0.88·10−4 M [21] to 1·10−9 M [18]) for BSA-gold nanoparticles complexes determined by this method. In our work, we used an alternative approach to determine the composition of the gold nanoparticle conjugates with various proteins. This method was based on measurement of the residual fluorescence of the reaction solution after separation from nanoparticles by centrifugation. This approach eliminates the influence of nanoparticles on the protein fluorescence, and allows determining the amount of unbound protein with high accuracy. The following four proteins were selected for this study: human immunoglobulin G (IgG); bovine serum albumin (BSA); a recombinant mutant of protein G from Streptococcus spp. (protein G) formed from three IgG-binding fragments [24]; and Kunitz-type
Int. J. Mol. Sci. 2015, 16
909
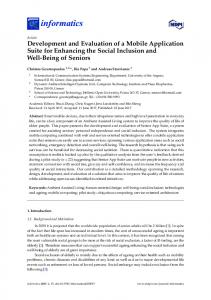
soybean trypsin inhibitor (STI). These proteins were chosen because of their frequent use in immunochemical systems as carrier proteins for low molecular weight haptens (BSA and STI), as receptor molecules (IgG and protein G), and as nanoparticle stabilizers and components of the reaction medium (BSA). In addition, serum albumin and IgG are major protein components in blood [25]. If nanoparticles enter the bloodstream they will mainly interact with these proteins [12,26]. Therefore, the study of these proteins is of great importance for medicine and toxicology. The aim of this study was to develop and test a new label-free method for the characterization of gold nanoparticle-protein conjugates. Potentially, this method could be used also to characterize protein conjugates of other nanoparticles. 2. Results and Discussion 2.1. Measurement of the Dimensions of the Gold Nanoparticles Electron microscopy of the gold nanoparticles showed a high degree of size uniformity. The 57 tested particles had an average diameter of 23.9 ± 2.7 nm, and an axial ratio of 1.20 ± 0.09 (Figure 1). The hydrodynamic diameter of the particles according to data from dynamic light scattering was 25.8 ± 1.5 nm.
Figure 1. Characteristics of the gold nanoparticles. (A) Histogram of particle size distribution; (B) An image of gold nanoparticles from the electron micrograph. 2.2. Using the Protein’s Intrinsic Fluorescence to Determine the Composition of the Protein-Gold Nanoparticle Conjugates The vast majority of proteins have the intrinsic fluorescence, which occurs mainly because of their tryptophan content. Tryptophan has a maximum absorption at 280 nm and emission maximum at 340–360 nm [27]. The proposed method for determining the composition of the protein-gold nanoparticle conjugates is based on comparison of the initial fluorescence of calibration solutions (F0) and the residual
Int. J. Mol. Sci. 2015, 16
910
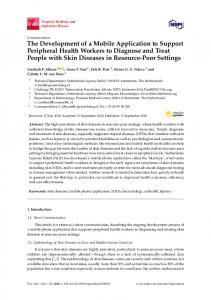
fluorescence of the reaction solutions after separation of the synthesized conjugates (F). The difference between these two values corresponds to the amount of the protein in the conjugate as shown by the following equation: (C0 − Cunbound)/C0 = (F0 − F)/F0 (1) Cconjugated = C0 − Cunbound = C0 (F0 − F)/F0 where C0 is the initially added protein concentration, Cunbound is the protein concentration in the reaction solutions after separation of the synthesized conjugates, and Cconjugated = is the decrease of protein concentration reflecting its binding with the nanoparticles in the course of the conjugation. The experimental setup shown in Figure 2 allows measurement of the fluorescence of proteins in calibration solutions and in supernatants under the same conditions. The fluorescence of tryptophan is dependent on a number of factors, including the composition of its immediate environment. Even small changes in the ionic composition of the solution and in the conformation of the protein can significantly affect the fluorescence signal [27–29]. We have compared BSA fluorescence in distilled water, in citrate solution used for the synthesis of gold nanoparticles in the supernatant after centrifugation of the nanoparticles. The three obtained dependences of the BSA fluorescence at 350 nm from its concentration have different slopes of their linear approximations: (1) BSA fluorescence in water −18.4 arb. units of fluorescence per 1 μg/mL of BSA in the solution; (2) BSA fluorescence in citrate −20.4 arb. units per 1 μg/mL; (3) BSA fluorescence in supernatant −19.8 arb. units per 1 μg/mL (accuracy of measurements < 1%). So, to use guaranteed proper control for comparison and eliminate all potential risks caused by influencing compounds, we recommend comparing the fluorescence of non-adsorbed protein with supernatant solution. Thus, the calibration solutions were prepared using the supernatant (pH 5.4) obtained after centrifugation of gold nanoparticles. The calibration and test samples were measured simultaneously using the same microplate (See Supporting Information 1). Furthermore, because the microplates adsorb protein, which can affect the fluorescence, the measurements were performed immediately after transferring the samples into wells of the microplate.
Int. J. Mol. Sci. 2015, 16
Figure 2. Experimental protocol for determining the composition of gold nanoparticle-protein conjugates using immunoglobulin G (IgG) as an example. F0 is the fluorescence of the calibration solutions, F is the fluorescence of the supernatant after centrifugation of the synthesized conjugates, and ∆F is given by F0 − F.
911
Int. J. Mol. Sci. 2015, 16
912
2.3. Determination of the Concentration of the Gold Nanoparticles The electron microscopy data showed the obtained particles had an average diameter of 24 nm, which was used to obtain a particle volume of v = 7.2 × 10⁻²⁴ m3. Taking into consideration the density of gold (19,300 kg/m3), we calculated the mass of one particle as 1.4 × 10⁻¹⁶ g. For the synthesis, 0.2 mL of 5% HAuCl4 was added to 100 mL of water. Therefore, the concentration of gold in a solution was 0.05 g/L, and, the number of particles per milliliter was n = 3.6 × 10¹¹. 2.4. Determination of the Amount of Protein Adsorbed on the Gold Nanoparticles We have used values of the fluorescence at 350 nm as well as it corresponds to the highest peak of the spectra and also is in accordance to common practice of the characterization of protein fluorescence [27–29]. Individual spectral properties of each system didn’t influence on linearity of the studied main fluorescence at 350 nm as well as on calculation of proteins content in the studied solutions. The dependency of the fluorescence intensity at 350 nm on the concentration of added protein was determined in the calibration solutions and in the test samples (Figure 3). In the concentration range of 0–250 μg/mL, dependence of the intensity of the protein fluorescence on the concentration in the calibration solution was linear (R was >0.99 for all proteins). However, as the fluorescence increased, so did the absolute error in the measurements. Consequently, only the data obtained for proteins with concentrations ≤125 μg/mL were used to calculate the conjugates composition. At higher concentrations, the measurement error was greater than the difference between the values of the fluorescence for the calibration solutions and for the tested samples. At low protein concentrations in the synthesis (≤8 μg/mL), the quantity of unbound molecules of protein was below the detection limit of the method (0.5 μg/mL). In this case, virtually all the added protein was adsorbed on the surface of the nanoparticles (Figure 3). As the concentration of added protein increased, the curves for the calibration solutions and samples became parallel, which indicates saturation was reached. Based on the difference between the signals for the samples and calibration solutions and on the quantity of gold nanoparticles in the solution, which was 1.8 × 10¹² particles/mL taking into consideration the five-fold increase in the concentration after centrifugation of the conjugate and redissolution of the pellet, the quantity of immobilized protein molecules per particle was calculated according to the following equation: [(F0 − F)/F0] × ([L0]/[R0]) = RL
(2)
where F0 is the fluorescence of the calibration solution, F is the fluorescence of the supernatant obtained after centrifugation of the conjugate, [L0] is the concentration of the added protein, [R0] is the concentration of nanoparticles, and RL is the quantity of protein molecules bound to a single gold nanoparticle. The obtained values of protein adsorbed on a single nanoparticle for different added concentrations of four studied proteins are given as curves at Figure 4. As can be seen, the saturation of adsorption capacity is reached for all cases. The concentrations necessary for the saturation lie in the range from 40 to 60 μg/mL.
Int. J. Mol. Sci. 2015, 16
Figure 3. The dependence of the fluorescence intensity of proteins on their concentrations. Fluorescence intensity (F) at 350 nm in the calibration solutions [L]0 (solid squares) and in the supernatants obtained after centrifugation of the conjugates with gold nanoparticles (open circles). Graphs (A,B) are for bovine serum albumin (BSA) (average of six repetitions); (C,D) are for Kunitz-type soybean trypsin inhibitor (STI) (average of three repetitions); (E,F) are for recombinant streptococcal protein G (protein G) (average of three repetitions); and (G,H) are for human immunoglobulin G (IgG) (average of three repetitions). Graphs B, D, F, H show the initial parts of graphs A, C, E, G.
913
Int. J. Mol. Sci. 2015, 16
914
Figure 4. Number of molecules of protein adsorbed on a single nanoparticle. The dependence of the number of molecules of protein adsorbed on a single nanoparticle (RL) on the protein concentration used in the synthesis ([L0]). Graph (A) is for bovine serum albumin (BSA); (B) is for Kunitz-type soybean trypsin inhibitor (STI); (C) is for recombinant streptococcal protein G (protein G); and (D) is for human immunoglobulin G (IgG). 2.5. Determination of the Equilibrium Dissociation Constants of the Protein-Nanoparticle Interaction and the Number of Sorption Sites The constants of the protein-nanoparticle interaction were determined by the Scatchard method [30] in accordance with the following equation: RL/[L] = (N − RL)/KD
(3)
where [L] is the concentration of free protein, RL is the amount of protein molecules bound to a single gold nanoparticle, KD is the equilibrium dissociation constant of the complex, and N is number of binding sites on a single gold nanoparticle. We determined the KD values from curves of the dependence of the RL/[L] ratio on RL. The KD was equivalent to the cotangent of the angle of the tangent. The KD and N were calculated for the protein concentrations that had the following characteristics: (i) a large difference between the supernatant and background signals; and (ii) did not reach saturation. According to (i), protein concentrations ≥16 μg/mL were selected; and for (ii) the range was