materials Article
Synthesis of Au NP@MoS2 Quantum Dots Core@Shell Nanocomposites for SERS Bio-Analysis and Label-Free Bio-Imaging Xixi Fei, Zhiming Liu *, Yuqing Hou, Yi Li, Guangcun Yang, Chengkang Su, Zhen Wang, Huiqing Zhong, Zhengfei Zhuang and Zhouyi Guo * MOE Key Laboratory of Laser Life Science & SATCM Third Grade Laboratory of Chinese Medicine and Photonics Technology, College of Biophotonics, South China Normal University, Guangzhou 510631, Guangdong, China;
[email protected] (X.F.);
[email protected] (Y.H.);
[email protected] (Y.L.);
[email protected] (G.Y.);
[email protected] (C.S.);
[email protected] (Z.W.);
[email protected] (H.Z.);
[email protected] (Z.Z.) * Correspondence:
[email protected] (Z.L.);
[email protected] (Z.G.); Tel./Fax: +86-20-8521-1428 (Z.G.) Academic Editor: Elisabetta Comini Received: 13 April 2017; Accepted: 26 May 2017; Published: 13 June 2017
Abstract: In this work, we report a facile method using MoS2 quantum dots (QDs) as reducers to directly react with HAuCl4 for the synthesis of Au nanoparticle@MoS2 quantum dots (Au NP@MoS2 QDs) core@shell nanocomposites with an ultrathin shell of ca. 1 nm. The prepared Au NP@MoS2 QDs reveal high surface enhanced Raman scattering (SERS) performance regarding sensitivity as well as the satisfactory SERS reproducibility and stability. The limit of detection of the hybrids for crystal violet can reach 0.5 nM with a reasonable linear response range from 0.5 µM to 0.5 nM (R2 ≈ 0.974). Furthermore, the near-infrared SERS detection based on Au NP@MoS2 QDs in living cells is achieved with distinct Raman signals which are clearly assigned to the various cellular components. Meanwhile, the distinguishable SERS images are acquired from the 4T1 cells with the incubation of Au NP@MoS2 QDs. Consequently, the straightforward strategy of using Au NP@MoS2 QDs exhibits great potential as a superior SERS substrate for chemical and biological detection as well as bio-imaging. Keywords: MoS2 quantum dots; Au nanoparticles; surface enhanced Raman scattering; tumor cells
1. Introduction Transition metal dichalcogenide (TMDC) materials have been intensively studied in recent years for their intriguing properties and unique structures [1–4]. Molybdenum disulfide (MoS2 ), as a typical TDMC family number, is particularly promising thanks to its superior optical, electronic, and mechanical properties for the wide applications of photocatalysis, hydrogen evolution, and optical sensors [5–8]. MoS2 has a structure built of covalently bonded S-Mo-S single layers interacting by van der Waals forces and each molybdenum atom is surrounded by six sulphur atoms [9]. It is worth noting that, among the various morphologies of MoS2 , MoS2 quantum dots (MoS2 QDs) display better optical properties mainly due to their larger direct band gap which directly impacts their optical properties when compared with bulk and monolayer MoS2 [10–12]. MoS2 QDs also exhibit the properties of large surface area, excellent solubility, chemical inertia, high stability, and low toxicity, and are potentially applicable in bio-imaging, fluorescent sensors, and cancer therapies [13–19]. However, few reports have studied the application of MoS2 QDs for surface enhanced Raman scattering (SERS). SERS is one of the most sensitive and powerful analytical techniques for detecting molecular vibrational fingerprints with high resolution [20]. The typical material for SERS is noble metal (e.g., Au,
Materials 2017, 10, 650; doi:10.3390/ma10060650
www.mdpi.com/journal/materials
Materials 2017, 10, 650
2 of 11
Ag, and Cu) with nanostructures or rough surfaces which can vastly amplify the SERS signal owing to enhancement mechanism (EM) caused by their local surface plasmon resonance (LSPR) effect [21,22]. In order to obtain SERS performance, many researchers have made efforts to functionalize Materials 2017, 10,better 650 2 of 11 noble metal nanoparticles with graphene and its derivatives due to more hot spots being generated Ag, andmechanism Cu) with nanostructures or rough surfaces which can vastly amplify SERS signal and theAu, chemical (CM) induced by the charge transfer between the the SERS substrates and owing to enhancement mechanism (EM) caused by their local surface plasmon resonance (LSPR) the molecules [23–26]. Interestingly, we found that the MoS2 family can also produce appropriate effect [21,22]. In order to obtain better SERS performance, many researchers have made efforts to SERS activity through CM and provide efficient adsorption for a variety of target molecules [27,28]. functionalize noble metal nanoparticles with graphene and its derivatives due to more hot spots Moreover, the MoS2 -Au can provide strong coupling the coupling being generated andsystem the chemical mechanism (CM)exciton-plasmon induced by the charge transferand between the SERS of the two resonances of contributing to the SERS enhancement [29,30]. Additionally, sharing a substrates are and capable the molecules [23–26]. Interestingly, we found that the MoS 2 family can also produce appropriate SERS activity through CM and at provide efficient adsorption for acan variety of target reduce graphene-like structure, MoS2 can be produced a lower temperature which efficaciously molecules [27,28]. Moreover, the MoS 2-Au system can provide strong exciton-plasmon coupling and the energy consumption and makes it easier to combine with traditional metal nanoparticles when the coupling of the two resonances are capable of contributing to the SERS enhancement [29,30]. compared with graphene. Therefore, the MoS2 -metal nanoparticle composites have advantages of Additionally, sharing a graphene-like structure, MoS2 can be produced at a lower temperature which being SERS substrates. Su et al. achieved sensitive SERS detection of rhodamine 6G by employing can efficaciously reduce the energy consumption and makes it easier to combine with traditional synthesized nanoparticles NPs)-MoS [31]. the Compared withnanoparticle two-dimensional 2 nanocomposites metal Au nanoparticles when(Au compared with graphene. Therefore, MoS2-metal (2D) MoS , 0D MoS QDs have a larger specific surface area and more edge atoms that can composites have advantages of being SERS substrates. Su et al. achieved sensitive SERS detection of lead to 2 2 rhodamine 6G by employing synthesized Au nanoparticles (Au NPs)-MoS 2 nanocomposites [31]. the deficiency of co-ordination of the surface atoms and the increasement of unsaturated bonds for Compared with two-dimensional MoShigher 2, 0D MoS2 QDs have a larger specific surface area and absorbing more analytes, which may(2D) realize SERS performance [31–33]. more edge atoms that can lead to the deficiency of co-ordination of the surface atoms and the In this work, we report a facile and green method to synthesize Au NP@MoS2 QDs nanocomposites increasement of unsaturated bonds for absorbing more analytes, which may realize higher SERS with a performance core@shell [31–33]. nanostructure for the first time. The MoS2 QDs, as a reducer, directly react with the HAuClIn in aqueous solution at and 80 ◦green C without other agents (Scheme 1). The pinhole-free, 4 this work, we report a facile method any to synthesize Au NP@MoS 2 QDs nanocomposites chemical inert, and ultrathin MoSfor shell (with a thickness ca. 1 directly nm) that meets the basic with a core@shell nanostructure the first time. The MoS 2 QDs, as aof reducer, react with the 2 QDs HAuCl4of in shell-isolated aqueous solutionnanoparticle-enhanced at 80 °C without any other agents (Scheme 1). The pinhole-free, chemical requirement Raman spectroscopy (SHINERS) can protect inert, and ultrathin MoS2 QDs shell (with a thickness of ca.of 1 nm) that meets the basic requirement the Au-core from the chemical environment, the surface interest, and the probe moleculesof[34–36]. shell-isolated nanoparticle-enhanced Raman spectroscopy (SHINERS) can protect the Au-core from The as-prepared substrate of AuNP@MoS2 QDs nanocomposites makes full use of the synergistic effects the chemical environment, the surface of interest, and the probe molecules [34–36]. The as-prepared of the eigen properties of MoS2 QDs and the Au NPs exhibit an admirable SERS effect. Furthermore, substrate of AuNP@MoS2 QDs nanocomposites makes full use of the synergistic effects of the eigen the shell-isolated nanoparticles show better bare NPs because of the inert properties of MoS2 QDs and the Au much NPs exhibit anstability admirablethan SERSthe effect. Furthermore, the shellcoatings [35]. Taking that into consideration with the non-toxic andbecause biocompatible MoS we apply isolated nanoparticles show much better stability than the bare NPs of the inert coatings [35]. 2 QDs, Taking2 QDs that into consideration thelabel-free non-toxic near-infrared and biocompatible 2 QDs, we apply AuNP@MoS as the nanoprobewith for the (NIR)MoS SERS imaging of 4T1 cells AuNP@MoS2 QDs as the nanoprobe for thefeatures label-freeof near-infrared (NIR) SERS imaging of been 4T1 cells with a satisfactory result, where the Raman the cellular compounds have increased with a satisfactory result, where the Raman features of the cellular compounds have been increased and the intensity of these Raman signals is sharply enhanced. Thus, AuNP@MoS2 QDs may be a and the intensity of these Raman signals is sharply enhanced. Thus, AuNP@MoS2 QDs may be a promising nano-material for applications such as toxicant detection and bio-analysis. promising nano-material for applications such as toxicant detection and bio-analysis.
Scheme 1. Illustration of the fabrication process of the Au NP@MoS2 QDs nanocomposites and their
SchemeSERS 1. Illustration application. of the fabrication process of the Au NP@MoS2 QDs nanocomposites and their SERS application. 2. Materials and Methods
2. Materials and Methods 2.1. Materials
2.1. Materials Ammonium tetrathiomolybdate [(NH4)2MoS4] was purchased from J&K Chemical Ltd. (Shanghai, China). Tetrachloroauric acid (HAuCl4), hydrazine hydrate (N2H4, 80%), and polyvinyl pyrrolidone
Ammonium tetrathiomolybdate [(NH4 )2 MoS4 ] was purchased from J&K Chemical Ltd. (Shanghai, China). Tetrachloroauric acid (HAuCl4 ), hydrazine hydrate (N2 H4 , 80%), and polyvinyl pyrrolidone
Materials 2017, 10, 650
3 of 11
(PVP, 30 kDa) were bought from China National Medicine Corporation (Shanghai, China). Roswell Park Memorial Institute (RPMI)-1640 and fetal bovine serum (FBS) were obtained from GIBCO (Grand Island, NY, USA). Other reagents were of analytical grade and were used as received without further purification. Deionized water (Milli-Q System, Millipore, Billerica, MA, USA) was used in all experiments. 2.2. Preparation of MoS2 Quantum Dots MoS2 QDs were synthesized via a facile hydrothermal method with the precursor of (NH4 )2 MoS4 . In detail, 5.5 mg (NH4 )2 MoS4 was added into a 20 mL PVP solution (1.1 mg/mL) for dissolution through ultrasonication. After complete dissolution, 200 µL N2 H4 (80%), the reducing reagent, was mixed with the solution. Then, the mixture was transferred to a 50 mL Teflon-lined stainless steel autoclave and kept at 125 ◦ C for 3 h. Once the solution was cooled down to room temperature, the impurities were filtered by a 0.22 µm microporous membrane for colation of the unreacted residue. Finally, the solution was concentrated and further purified to remove the PVP and the residual salts by ultrafiltration (MW = 100 k). 2.3. Synthesis of Au NP@MoS2 QDs Nanocomposites 100 µL of the MoS2 QDs solution and 10 mL of ultrapure water were put into a 50 mL conical flask under vigorous stirring. When heated to 80 ◦ C, 200 µL HAuCl4 (10 mM) was slowly added drop-wise and the color of the mixture changed to aubergine immediately. After a 10-min reaction, the nanocomposites were collected and centrifuged at 10,000 rpm for 20 min performed three times. The pellet was resuspended in deionized water to obtain the proper concentration. Spherical Au NPs with the same size were also synthesized as the control. The synthesis route was as follows: 0.6 mL of HAuCl4 (10 mM) was diluted with 20 mL of ultrapure water under sustained stirring in the heated state. At the time when the solution was boiling, 200 mL of sodium citrate aqueous solution (1%) was added and boiled for another 20 min. The color of the solution changed from golden yellow to jacinth, which indicated the generation of the spherical Au NPs. 2.4. Characterization Transmission electron microscope (TEM) measurements were performed on a Tecnai G2 Spirit T12 (FEI, Hillsboro, OR, USA) operated at 120 kV equipped with an energy-dispersive X-ray (EDX) spectrometer. The UV-Vis absorption spectra of the hybrids were taken by a UV-Vis spectrometer (UV-6100, MAPADA, Shanghai, China). Raman spectra were recorded by using a Renishaw inVia microspectrometer (Renishaw, Derbyshire, England) with an excitation wavelength of 514.5 nm obtained from an Ar+ laser. 2.5. SERS Experiments To investigate the SERS effect, the liquid samples for SERS measurements were prepared by a mixture of CV aqueous solutions with different concentrations and the Au NP@MoS2 QDs suspension. Then, 4 µL of the mixture was dropped on the Si substrate to perform the instant SERS measurement. The SERS spectra was measured by the Renishaw inVia microspectrometer with a 514.5 nm laser excitation. The laser power on the sample was 1 mW with a 9 s accumulation time. All experiments were independently conducted three times. For cellular SERS analysis, the precultured mouse mammary cancer (4T1) cells were seeded on quartz substrates, and incubated with Au NP@MoS2 QDs, Au NPs (100 µM, elemental gold concentration), or MoS2 QDs (100 µM), or in RPMI-1640 medium (10% FBS) at 37 ◦ C for 12 h. Afterwards the cells were rinsed with PBS five times to wash away excess nanoparticles for the Raman test. The measurements were performed directly on individual cells per group in the PBS buffer using a Renishaw inVia confocal Raman microspectrometer with a 785-nm excitation laser. A 50× objective lens with a ~1 µm spot size was applied to focus the laser beam. The SERS spectra were
Materials 2017, 10, 650
4 of 11
Materials 2017, 10, 650
4 of 11
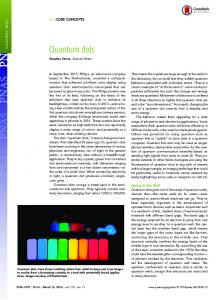
acquired with a 4 s integration time in static mode at a wavenumber center of 1200 cm−1 . The Raman mappingmapping was carried underout theunder streamline mode withmode a 2.45 with s exposure over a wavenumber Raman wasout carried the streamline a 2.45time s exposure time over a − 1 −1 range of 600–1750 . Each experiment conducted atconducted least five times. wavenumber rangecm of 600–1750 cm . Eachwas experiment was at least five times. 3. Results Results and and Discussion Discussion 3. 3.1. Characterizations of Core@Shell Structure Au NP@MoS2 QDs 3.1. Characterizations of Core@Shell Structure Au NP@MoS2 QDs The morphologies of MoS QDs were characterized by TEM analysis (Figure 1A). The sizes of The morphologies of MoS22 QDs were characterized by TEM analysis (Figure 1A). The sizes of the MoS2 QDs are in the range of about 2–5 nm (Figure S1A). Figure 1B clearly displays the TEM the MoS2 QDs are in the range of about 2–5 nm (Figure S1A). Figure 1B clearly displays the TEM images of the Au NP@MoS2 QDs hybrids with nearly spherical shape prepared via a simple method images of the Au NP@MoS2 QDs hybrids with nearly spherical shape prepared via a simple method where the mixture of MoS2 QDs and HAuCl4 was heated to 80 ◦ C for 10 min, and the mean diameter where the mixture of MoS2 QDs and HAuCl4 was heated to 80 °C for 10 min, and the mean diameter of the 43 nm nm (Figure (Figure S1B). S1B). The The color color of of the the mixture mixture changed changed from from light light yellow of the hybrids hybrids is is ca. ca. 43 yellow to to amaranth which demonstrated the formation of Au NPs. During the synthesis, MoS QDs were used 22 QDs were used amaranth which demonstrated the formation of Au NPs. During the synthesis, MoS − to directly AuAu ionsions to gold NPs by theby formation of the MoS /AuCl consistent 4 2redox to directlyreduce reducethethe to gold NPs the formation of 2the MoS /AuClpair, 4 redox pair, with the previous [37].study At higher in Figure the 1C, core@shell structure of the consistent with thestudy previous [37]. Atmagnification higher magnification in1C, Figure the core@shell structure nanocomposites with the ultrathin MoS QDs-coating (pointed by the red arrows) of ca. 1 nm of the nanocomposites with the ultrathin2 MoS2 QDs-coating (pointed by the red arrows) of ca. 1 can nm be seen. The UV-Vis spectrum of the MoS QDs (Figure 1D) illustrates a broad absorption band at 2 can be seen. The UV-Vis spectrum of the MoS2 QDs (Figure 1D) illustrates a broad absorption band around 270 nm which is assigned to the excitonic features of the MoS QDs [38]. After reacting with 2 at around 270 nm which is assigned to the excitonic features of the MoS2 QDs [38]. After reacting with HAuCl44,, aa new new absorption absorption band band consistent consistent with with the the Au Au plasmon plasmon band band at at 578 578 nm nm appears, appears, suggesting suggesting HAuCl the formation formation of ofAu AuNPs. NPs.Meanwhile, Meanwhile, along with existence of the absorption peak at around the along with thethe existence of the absorption peak at around 270 270 nm in the red line, it can be deduced that the integration of Au NP and MoS QDs occurs. The EDX EDX nm in the red line, it can be deduced that the integration of Au NP and MoS22QDs occurs. The spectra exhibit exhibit the the presence presence of of Mo Mo and QDs (Figure (Figure 1E) 1E) and and Mo, Mo, S, S, and and Au spectra and S S elements elements in in the the MoS MoS22 QDs Au elements in in the (Figure 1F), 1F), which which further further demonstrate demonstrate the the generation generation of of the the Au Au elements the nanocomposites nanocomposites (Figure QDs hybrids. hybrids. NP@MoS22 QDs NP@MoS
Figure 1. TEM images of MoS2 QDs (A) and Au NP@ MoS2 QDs at (B) low magnification as well as Figure 1. TEM images of MoS2 QDs (A) and Au NP@ MoS2 QDs at (B) low magnification as well as (C) high magnification (The red arrows pointed to the shells of the hybrids). UV-Vis spectra of MoS2 (C) high magnification (The red arrows pointed to the shells of the hybrids). UV-Vis spectra of MoS2 QDs and Au NP@ MoS2 QDs (D). EDX spectra of MoS2 QDs (E) and Au NP@ MoS2 QDs (F). QDs and Au NP@ MoS2 QDs (D). EDX spectra of MoS2 QDs (E) and Au NP@ MoS2 QDs (F).
3.2. The SERS Activities of Au NP@MoS2 QDs Nanocomposites 3.2. The SERS Activities of Au NP@MoS2 QDs Nanocomposites In order to investigate the SERS performance of the Au NP@MoS2 QDs, herein, we employed In order to investigate the SERS performance of the Au NP@MoS2 QDs, herein, we employed crystal violet (CV) as the probe molecule due to its well-established and distinct Raman features. As crystal violet (CV) as the probe molecule due to its well-established and distinct Raman features. shown in Figure 2, the SERS signal of 5 μM CV with Au NP@MoS2 QDs as the substrate is sharply enhanced. The prominent characteristic peaks of CV at 1539, 1588, and 1620 cm−1 are associated with the ring C–C stretching mode; the band at 1370, 1178, and 916 cm−1 are attributed to the N-phenyl stretching vibration, C–H bending mode, and in-plane phenyl deformation mode, respectively.
Materials 2017, 10, 650
5 of 11
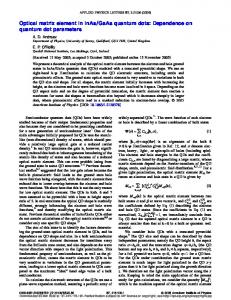
As shown in Figure 2, the SERS signal of 5 µM CV with Au NP@MoS2 QDs as the substrate is sharply enhanced. The prominent characteristic peaks of CV at 1539, 1588, and 1620 cm−1 are associated the ring C–C stretching mode; the band at 1370, 1178, and 916 cm−1 are attributed Materials 2017,with 10, 650 5 of 11 to the N-phenyl stretching vibration, C–H bending mode, and in-plane phenyl deformation mode, respectively. In SERS contrast, the SERS intensity of by CVAu induced Au2NPs is much In contrast, the intensity of CV induced NPs orbyMoS QDsor is MoS much weaker than weaker that by 2 QDs thanNP@MoS that by Au NP@MoS Thethe reasons for SERS the superior SERS performance of the core@shell Au 2 QDs. The reasons superior performance of the core@shell nanohybrids 2 QDs. for nanohybrids are First, as follows. as the enhanced of Au CV on Auare NPs are mainly attributed to are as follows. as theFirst, enhanced signals ofsignals CV on NPs mainly attributed to the the electromagnetic enhancement MoS canprovide providechemical chemicalenhancement, enhancement, the the hybrids electromagnetic enhancement andand as as MoS 2 QDs can 2 QDs combining both of these advantages show a higher higher SERS SERS performance. performance. Second, the MoS2 QDs can adsorb multifarious target molecules effectively. Figure S2 shows the UV-Vis spectra of the 1 mM CV after it was with Au NPsAu or the the absorbance solution and andthe thesolution solution after it incubated was incubated with NPshybrids. or the Obviously, hybrids. Obviously, the intensity of intensity the CV solution after the absorption Au NPs isbymuch higher than that of the absorbance of the CV solution after theby absorption Au NPs is much higher thansolution that of aftersolution absorption the MoS2 QDs wrapped Au NPs. Third, the hybrids canthe behybrids a chosencan semiconductor the afterbyabsorption by the MoS2 QDs wrapped Au NPs. Third, be a chosen system to form asystem molecule-semiconductor system with the CV molecules resonance at 576 nm, semiconductor to form a molecule-semiconductor system with(with the CV molecules (with Figure S2), because the hybrids have a plasmon resonance at 578 nm near the CV molecular resonance. resonance at 576 nm, Figure S2), because the hybrids have a plasmon resonance at 578 nm near the The combined system benefiting from the system coupling effect of multiple (surface CV molecular resonance. The combined benefiting from theresonances coupling effect of plasmon, multiple exciton, and(surface charge-transfer) can lead to and the strong SERS effect can [30].lead Finally, the strong MoS2 QDs shell-isolated resonances plasmon, exciton, charge-transfer) to the SERS effect [30]. substratethe canMoS free2 bare NPs from the harsh chemical and various Finally, QDsAu shell-isolated substrate can freeenvironment bare Au NPs from the metal-molecule harsh chemical interactions, leading to themetal-molecule high SERS detection sensitivity. environment and various interactions, leading to the high SERS detection sensitivity.
Figure 2. SERS μM CV CV in in Au Au NP@MoS NP@MoS2 QDs, MoS2 QDs, and Au NPs aqueous solution, Figure 2. SERS spectra spectra of of 55 µM 2 QDs, MoS2 QDs, and Au NPs aqueous solution, and Raman spectrum spectrum of of the the 11 mM mM CV CV aqueous aqueous solution. solution. and the the normal normal Raman
For quantification, the enhancement factor (EF) was estimated using the following equation: For quantification, the enhancement factor (EF) was estimated using the following equation: × EF = I C EF = SERS × Raman CSERS I where ISERS and IRaman represent the band intensities of Raman the SERS spectrum and the normal Raman spectrum, and CSERS the andband CRamanintensities are the concentrations of the probe for where ISERSrespectively; and IRaman represent of the SERS spectrum and molecules the normalused Raman SERS and normal Raman measurements, respectively. According to the CV characteristic band at spectrum, respectively; and CSERS and CRaman are the concentrations of the probe molecules used for −1 4 1620 EF ofRaman Au NP@MoS 2 QDs is calculated to beAccording 3.6 × 10 and about times stronger than SERScm and, the normal measurements, respectively. toisthe CV 18 characteristic band at 3). This −1 ,Au 4 the that of 2 × 10³) and 30 times stronger than that of MoS 2 QDs (EF ≈ 1.2 × 10 1620 cmthe theNPs EF of(EF Au≈NP@MoS QDs is calculated to be 3.6 × 10 and is about 18 times stronger than 2 3 ) and result the (EF good effect of30 thetimes hybrid as the than substrate. that ofindicates the Au NPs ≈SERS 2 × 10 stronger that of the MoS2 QDs (EF ≈ 1.2 × 10³ ). further evaluate the SERS of the as substrate, SERS spectra of the Au NP@MoS2 This To result indicates the good SERSperformance effect of the hybrid the substrate. QDs To suspension with the addition of different concentrations of are shown in Figure 3A.2 QDs It is further evaluate the SERS performance of the substrate, SERSCV spectra of the Au NP@MoS apparent that the SERS intensity decreases with the decline of the CV concentration along with the suspension with the addition of different concentrations of CV are shown in Figure 3A. It is apparent absence of some intrinsic bands. When the decline concentration of CV decreases toalong 0.5 nm, thethe bands at 804, that the SERS intensity decreases with the of the CV concentration with absence of −1 are still apparent (seen the insert of Figure 3A). The integrated 916, 1178, 1539, 1588, and 1620 cm some intrinsic bands. When the concentration of CV decreases to 0.5 nm, the bands at 804, 916, 1178, intensity of the SERS band at 1620 cm−1 is used for quantification. As plotted in Figure 3B, the linear response from 0.5 nM to 50 μM of CV with the reasonable relationship is defined as y = 473.79x + 4432.15 (R2 ≈ 0.974). In this case, the limit of detection (LOD) is 0.5 nM, exhibiting the excellent SERS activity.
Materials 2017, 10, 650
6 of 11
1539, 1588, and 1620 cm−1 are still apparent (seen the insert of Figure 3A). The integrated intensity of the SERS band at 1620 cm−1 is used for quantification. As plotted in Figure 3B, the linear response from 0.5 nM to 50 µM of CV with the reasonable relationship is defined as y = 473.79x + 4432.15 (R2 ≈ 0.974). Materials 2017,10, 10,650 650 In this case, the limit of detection (LOD) is 0.5 nM, exhibiting the excellent SERS activity. Materials 2017, 66ofof1111
Figure3.3.SERS SERSspectra spectraofofCV CVwith withdifferent differentconcentrations concentrationsinin200 200µM μMAu AuNP@MoS NP@MoS2 2QDs QDsaqueous aqueous Figure concentrations μM Au NP@MoS 2 −1, B). Insert: SERS solution (A) and the corresponding quantitative curves (using the band at 1620 cm − 1 solution (A) and the corresponding corresponding quantitative quantitativecurves curves(using (usingthe theband bandatat1620 1620cm cm−1, B). Insert: SERS spectrumofof0.5 0.5nM nMCV CVininthe the200 200µM μMnanocomposite nanocompositesuspension. suspension. spectrum μM nanocomposite suspension.
In practical practical applications, applications, it isis vital vital to accomplish accomplish uniformity ofof the the SERS-active substrate. substrate. In In practical applications, it it is vital to to accomplish uniformity uniformity of the SERS-active SERS-active substrate. Six different positions on the sample are randomly chosen for SERS measurement, and each position Six positions on on the the sample Six different different positions sample are are randomly randomly chosen chosen for for SERS SERS measurement, measurement, and and each each position position wastested testedthree threetimes. times. InFigure Figure 4A,the theSERS SERSspectrum spectrumofofeach eachsample samplehas hasuniform uniformfeatures featureswith with was was tested three times. In In Figure 4A, 4A, the SERS spectrum of each sample has uniform features with very minimal variations in their signal intensities, which indicates the acceptable reproducibility of very minimal minimal variations variations in their signal signal intensities, intensities, which which indicates indicates the the acceptable acceptable reproducibility reproducibility of very in their of the Au NPs@MoS 2 QDs substrate. For the purpose of further assessment of the hybrids, the SERS the Au NPs@MoS NPs@MoS22 QDs of SERS the Au QDs substrate. substrate. For For the the purpose purpose of of further further assessment assessment of the the hybrids, hybrids, the the SERS −1 were collected to calculate the intensity of five prominent bands at 811, 916, 1178, 1370, and 1620 cm −1 − 1 intensity 1620 cmcmwere collected to calculate the intensity of of five five prominent prominentbands bandsatat811, 811,916, 916,1178, 1178,1370, 1370,and and 1620 were collected to calculate relativestandard standarddeviations deviations(RSDs) (RSDs)with withthe thevalues valuesofof3.6%, 3.6%,3.8%, 3.8%,6.2%, 6.2%,3.9%, 3.9%,and and8.11% 8.11%for forthe the relative the relative standard deviations (RSDs) with the values of 3.6%, 3.8%, 6.2%, 3.9%, and 8.11% for the statistically meaningful analysis (Figure 4B). These RSD values are within the acceptable standard (less statistically 4B). These RSD values areare within the the acceptable standard (less statistically meaningful meaningfulanalysis analysis(Figure (Figure 4B). These RSD values within acceptable standard than 20%) [39]. The main reason for the satisfactory reproducibility of the as-prepared hybrids may than 20%) [39]. The reason for the reproducibility of theofas-prepared hybrids may (less than 20%) [39].main The main reason forsatisfactory the satisfactory reproducibility the as-prepared hybrids be attributed to the chemically inert MoS 2 QDs-shell that isolates the Au NP from the analyte be to the chemically inert MoS 2 QDs-shell that isolates the Au NP from the analyte mayattributed be attributed to the chemically inert MoS 2 QDs-shell that isolates the Au NP from the analyte molecules,which whichreduces reducesthe thedisturbed disturbedsignals signalsand andenables enablesthe the SERSanalysis analysiswith withmore morewellwellmolecules, molecules, which reduces the disturbed signals and enables the SERSSERS analysis with more well-defined defined molecular interactions. defined molecular interactions. molecular interactions.
Figure4.4.SERS SERSspectra spectraofofCV CVinduced inducedby byAu AuNPs@MoS NPs@MoS2 2QDs QDsatatsix sixrandomly randomlyselected selectedpositions positions(A); (A); Figure Figure 4. SERS spectra of CV induced by Au NPs@MoS2 QDs at six randomly selected positions Uniformities of the SERS intensities of five characteristic Raman bands on the basis of the SERS Uniformities of the SERS intensities of five characteristic Raman bands SERS (A); Uniformities of the SERS intensities of five characteristic Raman bandsononthe thebasis basisof of the the SERS detection of the six samples (B). detection six samples samples (B). (B). detection of of the the six
Besidesthe thesensitivity sensitivityand andthe thereproducibility, reproducibility,the thestability stabilityofofthe thesubstrate substrateisisalso alsoestimated estimatedby by Besides Besides the the SERS sensitivity and theonreproducibility, theofstability of in theAu substrate is also estimated by conducting experiment the fresh sample 5 μM CV NPs@MoS 2 QDs suspension conducting the SERS experiment on the fresh sample of 5 μM CV in Au NPs@MoS2 QDs suspension conducting the SERS experiment the fresh at sample of 5 µM in Au NPs@MoS QDs suspension every ten ten days days as the the substrateon stored °C with with theCV treatment light2avoidance avoidance the every as substrate isis stored at 44 °C the treatment ofof light inin the −1 refrigerator. In Figure 5, it is noted that the average SERS intensity at 1370 cm of the CV shows −1 refrigerator. In Figure 5, it is noted that the average SERS intensity at 1370 cm of the CV shows aa degreeofofdecay decayofofabout about36.6% 36.6%after after60 60days, days,offering offeringan anacceptable acceptablestability stabilityofofthe theSERS SERSsubstrate. substrate. degree contrast,for forthe theAu AuNPs NPssystem, system,the thesignals signalsfrom fromCV CVshow showmore morethan thanaa63.4% 63.4%decrease decreaserelative relativetoto InIncontrast, the initial response (Figure S3). Thus, Au NPs@MoS 2 QDs, taking advantages of high SERS activity, the initial response (Figure S3). Thus, Au NPs@MoS2 QDs, taking advantages of high SERS activity, adequate reproducibility, and satisfactory stability, may be a promising candidate for applications in
Materials 2017, 10, 650
7 of 11
every ten days as the substrate is stored at 4 ◦ C with the treatment of light avoidance in the refrigerator. In Figure 5, it is noted that the average SERS intensity at 1370 cm−1 of the CV shows a degree of decay of about 36.6% after 60 days, offering an acceptable stability of the SERS substrate. In contrast, for the Au NPs system, the signals from CV show more than a 63.4% decrease relative to the initial response (Figure S3). Thus, Au NPs@MoS2 QDs, taking advantages of high SERS activity, adequate reproducibility, and satisfactory stability, may be a promising candidate for applications in pollutant detection and biological systems. Materials 2017, 10, 650 7 of 11
Figure 5. 5. The The SERS SERS stability stability of of Au Au NPs@MoS NPs@MoS2 QDs. Figure 2 QDs.
3.3. Cellular SERS Measurement and Label-Free Bio-Imaging 3.3. Cellular SERS Measurement and Label-Free Bio-Imaging With the discovery of the prominent SERS features and the great biocompatibility of the MoS2 With the discovery of the prominent SERS features and the great biocompatibility of the QDs [28,40,41], we further investigate the capability of the Au NP@MoS2 QDs core@shell MoS2 QDs [28,40,41], we further investigate the capability of the Au NP@MoS2 QDs core@shell nanostructures for biomedicine applications. 4T1 cells treated with the nanohybrids or Au NPs for nanostructures for biomedicine applications. 4T1 cells treated with the nanohybrids or Au NPs for 12 h were used for Raman scanning under the confocal Raman microspectrometer with laser 12 h were used for Raman scanning under the confocal Raman microspectrometer with laser excitation excitation at 785 nm. Figure 6 demonstrates the mean vibrational spectra of 40 SERS spectra of 4T1 at 785 nm. Figure 6 demonstrates the mean vibrational spectra of 40 SERS spectra of 4T1 cells with or cells with or without each label-free SERS probe. The SERS spectra were obtained in static mode with without each label-free SERS probe. The SERS spectra were obtained in static mode with a wavenumber a wavenumber center at 1200 cm−1. No Raman signal is observed in the cells without nanoparticles or − 1 center at 1200 cm . No Raman signal is observed in the cells without nanoparticles or with MoS2 with MoS2 QDs under our experimental conditions. After incubation of the Au NPs for 12 h, only a QDs under our experimental conditions. After incubation of the Au NPs for 12 h, only a small number small number of the Raman peaks appeared from the vibration of the cellular compositions, such−as of the Raman peaks appeared from the vibration of the cellular compositions, such as 749 cm 1 , −1, 1556 cm−1, and 1646 cm−1. Furthermore, 749 cm−1 ,1835 cm−1, 1016 cm−1, 1136 cm−1, 1320 cm−1, 1353−cm − − 1 − 1 − 1 1 − 835 cm , 1016 cm , 1136 cm , 1320 cm , 1353 cm , 1556 cm 1 , and 1646 cm−1 . Furthermore, the SERS intensities are relatively weak (Table S1). Although the hybrid-induced mean SERS the SERS intensities are relatively weak (Table S1). Although the hybrid-induced mean SERS spectrum spectrum of 4T1 cells had a similar spectral pattern when compared with that of the Au NPs, more of 4T1 cells had a similar spectral pattern when compared with that of the Au NPs, more intense intense SERS signals were acquired and more abundant SERS peaks emerged. The SERS spectrum SERS signals were acquired and more abundant SERS peaks emerged. The SERS −1 spectrum caused caused by the Au NP@MoS2 QDs system shows intense vibration bands at 835 cm (ring breathing by the Au NP@MoS2 QDs system shows intense vibration bands at 835 cm−1 (ring−1 breathing mode mode of tyrosine or asymmetric O–P–O stretching vibration of DNA/RNA), 1010 cm (symmetric ring of tyrosine or asymmetric O–P–O stretching vibration of DNA/RNA), 1010 cm−1 (symmetric ring −1 (C–N stretching mode of protein, chain C–C stretching of breathing mode of phenylalanine), 1130 cm− breathing mode of phenylalanine), 1130 cm 1 (C–N stretching mode of protein, chain C–C stretching lipid, or C–O/C–C in disaccharide) and 1600 cm−1−(phenylalanine More distinct SERS 1 (phenylalanineorortyrosine). of lipid, or C–O/C–C in disaccharide) and 1600 cm tyrosine). More distinct SERS bands were associated with the protein at 655 cm−−11 (C–C twisting in protein), 976 cm−−11 (tryptophan or bands were associated with the protein at−1 655 cm (C–C twisting in protein), 976 cm (tryptophan or ring deformation in tyrosine), 1224 cm (random coils Amide III), 1554 cm−1 (Amide II), 1572 cm−1 ring deformation in tyrosine), 1224 cm−1 (random coils Amide III), 1554 cm−1 (Amide II), 1572 cm−1 (Amide II and tryptophan), etc. These data indicate that the Au NP@MoS2 QDs can be used as a SERS (Amide II and tryptophan), etc. These data indicate that the Au NP@MoS2 QDs can be used as a SERS probe in the complex cellular environment. Detailed assignments are summarized in Table S2. probe in the complex cellular environment. Detailed assignments are summarized in Table S2.
breathing mode of phenylalanine), 1130 cm−1 (C–N stretching mode of protein, chain C–C stretching of lipid, or C–O/C–C in disaccharide) and 1600 cm−1 (phenylalanine or tyrosine). More distinct SERS bands were associated with the protein at 655 cm−1 (C–C twisting in protein), 976 cm−1 (tryptophan or ring deformation in tyrosine), 1224 cm−1 (random coils Amide III), 1554 cm−1 (Amide II), 1572 cm−1 (Amide2017, II and etc. These data indicate that the Au NP@MoS2 QDs can be used as a SERS Materials 10, tryptophan), 650 8 of 11 probe in the complex cellular environment. Detailed assignments are summarized in Table S2.
Figure 6. 6. The The mean mean SERS SERS spectra spectra of of 4T1 4T1 cells cells triggered triggered by by MoS MoS2 QDs, QDs, Au Au NPs, NPs, and and the the nanohybrids nanohybrids Figure 2 after incubation of 12 h. after incubation of 12 h.
Materials 2017, 10, 650
8 of 11
Figure 7. The label-free NIR SERS imaging and detection of 4T1 cells. The images are taken after
Figure 7. The label-free NIR SERS imaging and detection of 4T1 cells. The images are taken after incubation of Au NPs (A–C) and Au NPs@MoS2 QDs (D–F). (G) The raw SERS spectral lines of incubation of Au NPs (A–C) and Au NPs@MoS2 QDs (D–F). (G) The raw SERS spectral lines of different spots randomly marked in the imaging of C and F. different spots randomly marked in the imaging of C and F.
The as-synthesized Au NP@MoS2 QDs were further used for label-free SERS mapping with the integrated intensity from 1200 to 1700 cm−1. Figure 7A–C shows an ambiguous and heterogeneous signal distribution because of the weak vibrational signals of the components in cells induced by Au NPs. In contrast, the 4T1 cells under the existence of Au NP@MoS2 QDs reveal a clear SERS image with a defined outline which is well in accordance with the bright-field microscopic image (Figure 7D–F). The overlap images of the SERS and bright-field images suggest that the endocytosed nanostructures
Materials 2017, 10, 650
9 of 11
The as-synthesized Au NP@MoS2 QDs were further used for label-free SERS mapping with the integrated intensity from 1200 to 1700 cm−1 . Figure 7A–C shows an ambiguous and heterogeneous signal distribution because of the weak vibrational signals of the components in cells induced by Au NPs. In contrast, the 4T1 cells under the existence of Au NP@MoS2 QDs reveal a clear SERS image with a defined outline which is well in accordance with the bright-field microscopic image (Figure 7D–F). The overlap images of the SERS and bright-field images suggest that the endocytosed nanostructures are situated almost in the cytoplasm. The Raman features of the spots that were randomly marked in the SERS images (Figure 7C,F) have been plotted in Figure 7G. These raw spectral lines from the 4T1 cells caused by the SERS probes corresponding to the mean spectra in Figure 7G further demonstrate the much more effective SERS activity of the Au NP@MoS2 QDs with a better signal-to-noise ratio. The spectral fluctuations of the six SERS lines also reveal a heterogeneous cellular composition in the cytoplasmic areas. In addition, the plentiful cellular SERS bands of the SERS spectral lines originating from a 4T1 cell containing the hybrids (the right part of Figure 7G) with inevitable autofluorescence background are observed without any interference, which demonstrates the superiority of the Au NP@MoS2 QDs as SERS active probes for cellular SERS analysis. It is worth noting that the Raman signatures of the cellular components can be prone to being drowned out in the inherent Raman features of graphene and its derivatives when they are selected as the SERS substrates for cell analysis [24,42]. Hence, MoS2 QDs may be the better alternative due to their intrinsic vibrational bands in the Raman-silence region of cells. 4. Conclusions Au NP@MoS2 QDs with an ultrathin MoS2 QDs shell of ca. 1 nm have been successfully prepared by a rapid reduction of the Au precursor with MoS2 QDs. The nanocomposites show high SERS sensitivity for the detection of CV with a LOD of 0.5 nM and are much more competitive than pure Au NPs and MoS2 QDs, which is mainly due to the additional chemical enhancement mostly caused by the MoS2 QDs and great adsorbability of the MoS2 QDs. Furthermore, the SERS reproducibility experiment has a satisfactory result, as the RSDs of the main Raman bands’ intensities are less than 8.11%, and the SERS stability of the nanocomposites has been proven. We have revealed the capability of Au NP@MoS2 QDs to be an ultrasensitive SERS probe for cell analysis and label-free SERS imaging. In conclusion, Au NP@MoS2 QDs have a promising future as a high performance SERS-active substrate for pollutants or toxicant detection associated with our daily life and biological analysis. Supplementary Materials: The following are available online at www.mdpi.com/1996-1944/10/6/650/s1, Figure S1: The mean diameter of MoS2 QDs (A) and Au NP@ MoS2 QDs (B), respectively, Figure S2: UV-Vis spectra of a 1 mM CV solution, and the remaining solution of 1 mM CV after the adsorption by 1 mM Au NPs or Au NP@MoS2 QDs, Figure S3: The stability of Au NPs, Table S1: The assignments of the Raman bands of 4T1 cells incubated with AuNPs, Table S2: The assignments of the Raman bands of 4T1 cells incubated with AuNP@MoS2 QDs. Acknowledgments: This work is supported by the National Natural Science Foundation of China (61335011, 61675072, 21505047, 11404116, and 61275187), the Natural Science Foundation of Guangdong Province of China (2014A030310306, S2013040016223 and 2014A030311024), the Science and Technology Project of Guangdong Province of China (2012A080203008 and 2014A020212282), and the Science and Technology Innovation Project of the Education Department of Guangdong Province of China (2013KJCX0052). Author Contributions: Zhouyi Guo, Zhiming Liu, and Xixi Fei conceived and designed the experiments. Xixi Fei performed the experiments, data analysis, and wrote this paper. Yuqing Hou, Yi Li, Guangcun Yang, Chengkang Su, Zhen Wang, Huiqing Zhong, and Zhengfei Zhuang performed data analysis. Zhouyi Guo and Zhiming Liu revised the paper. Conflicts of Interest: The authors declare no conflict of interest.
References 1.
Chen, Y.; Tan, C.L.; Zhang, H.; Wang, L.Z. Two-dimensional graphene analogues for biomedical applications. Chem. Soc. Rev. 2015, 44, 2681–2701. [CrossRef] [PubMed]
Materials 2017, 10, 650
2. 3. 4. 5. 6. 7. 8. 9. 10. 11.
12. 13.
14.
15.
16. 17. 18. 19.
20. 21. 22. 23. 24.
10 of 11
Liu, T.; Cheng, L.; Liu, Z. Two Dimensional Transitional Metal Dichalcogenides for Biomedical Applications. Acta Chim. Sin. 2015, 73, 902–912. [CrossRef] Mak, K.F.; He, K.L.; Shan, J.; Heinz, T.F. Control of valley polarization in monolayer MoS2 by optical helicity. Nat. Nanotechnol. 2012, 7, 494–498. [CrossRef] [PubMed] Zaumseil, J. Electronic Control of Circularly Polarized Light Emission. Science 2014, 344, 702–703. [CrossRef] [PubMed] Wang, Q.H.; Kalantar-Zadeh, K.; Kis, A.; Coleman, J.N.; Strano, M.S. Electronics and optoelectronics of two-dimensional transition metal dichalcogenides. Nat. Nanotechnol. 2012, 7, 699–712. [CrossRef] [PubMed] Gao, W.; Wang, M.; Ran, C.; Li, L. Facile one-pot synthesis of MoS2 quantum dots-graphene-TiO2 composites for highly enhanced photocatalytic properties. Chem. Commun. 2015, 51, 1709–1712. [CrossRef] [PubMed] Qiao, W.; Yan, S.; Song, X.; Zhang, X.; Sun, Y.; Chen, X.; Zhong, W.; Du, Y. Monolayer MoS2 quantum dots as catalysts for efficient hydrogen evolution. RSC Adv. 2015, 5, 97696–97701. [CrossRef] Tan, Y.; He, R.; Cheng, C.; Wang, D.; Chen, Y.; Chen, F. Polarization-dependent optical absorption of MoS2 for refractive index sensing. Sci. Rep. 2014, 4, 7523. [CrossRef] [PubMed] Ganatra, R.; Zhang, Q. Few-Layer MoS2 : A Promising Layered Semiconductor. ACS Nano 2014, 8, 4074–4099. [CrossRef] [PubMed] Bhanu, U.; Islam, M.R.; Tetard, L.; Khondaker, S.I. Photoluminescence quenching in gold—MoS2 hybrid nanoflakes. Sci. Rep. 2014, 4, 5575. [CrossRef] [PubMed] Lee, H.S.; Min, S.-W.; Chang, Y.-G.; Park, M.K.; Nam, T.; Kim, H.; Kim, J.H.; Ryu, S.; Im, S. MoS2 Nanosheet Phototransistors with Thickness-Modulated Optical Energy Gap. Nano Lett. 2012, 12, 3695–3700. [CrossRef] [PubMed] Arul, N.S.; Nithya, V.D. Molybdenum disulfide quantum dots: Synthesis and applications. RSC Adv. 2016, 6, 65670–65682. [CrossRef] Ren, X.; Pang, L.; Zhang, Y.; Ren, X.; Fan, H.; Liu, S. One-step hydrothermal synthesis of monolayer MoS2 quantum dots for highly efficient electrocatalytic hydrogen evolution. J. Mater. Chem. A 2015, 3, 10693–10697. [CrossRef] Xu, S.; Li, D.; Wu, P. One-Pot, Facile, and Versatile Synthesis of Monolayer MoS2 /WS2 Quantum Dots as Bioimaging Probes and Efficient Electrocatalysts for Hydrogen Evolution Reaction. Adv. Funct. Mater. 2015, 25, 1127–1136. [CrossRef] Dong, H.; Tang, S.; Hao, Y.; Yu, H.; Dai, W.; Zhao, G.; Cao, Y.; Lu, H.; Zhang, X.; Ju, H. Fluorescent MoS2 Quantum Dots: Ultrasonic Preparation, Up-Conversion and Down-Conversion Bioimaging, and Photodynamic Therapy. ACS Appl. Mater. Interfaces 2016, 8, 3107–3114. [CrossRef] [PubMed] Lin, H.; Wang, C.; Wu, J.; Xu, Z.; Huang, Y.; Zhang, C. Colloidal synthesis of MoS2 quantum dots: Size-dependent tunable photoluminescence and bioimaging. New J. Chem. 2015, 39, 8492–8497. [CrossRef] Gu, W.; Yan, Y.; Cao, X.; Zhang, C.; Ding, C.; Xian, Y. A facile and one-step ethanol-thermal synthesis of MoS2 quantum dots for two-photon fluorescence imaging. J. Mater. Chem. B 2016, 4, 27–31. [CrossRef] Jin, X.; Fan, X.; Tian, J.; Cheng, R.; Li, M.; Zhang, L. MoS2 quantum dot decorated g-C3 N4 composite photocatalyst with enhanced hydrogen evolution performance. RSC Adv. 2016, 6, 52611–52619. [CrossRef] Gan, Z.; Gui, Q.; Shan, Y.; Pan, P.; Zhang, N.; Zhang, L. Photoluminescence of MoS2 quantum dots quenched by hydrogen peroxide: A fluorescent sensor for hydrogen peroxide. J. Appl. Phys. 2016, 120, 104503. [CrossRef] Qian, X.M.; Nie, S.M. Single-molecule and single-nanoparticle SERS: From fundamental mechanisms to biomedical applications. Chem. Soc. Rev. 2008, 37, 912–920. [CrossRef] [PubMed] Otto, A.; Mrozek, I.; Grabhorn, H.; Akemann, W. Surface-enhanced Raman scattering. J. Phys. 1992, 4, 1143–1212. [CrossRef] Ko, H.; Singamaneni, S.; Tsukruk, V.V. Nanostructured Surfaces and Assemblies as SERS Media. Small 2008, 4, 1576–1599. [CrossRef] [PubMed] Luo, P.; Li, C.; Shi, G. Synthesis of gold@carbon dots composite nanoparticles for surface enhanced Raman scattering. Phys. Chem. Chem. Phys. 2012, 14, 7360–7366. [CrossRef] [PubMed] Liu, Z.; Hu, C.; Li, S.; Zhang, W.; Guo, Z. Rapid intracellular growth of gold nanostructures assisted by functionalized graphene oxide and its application for surface-enhanced Raman spectroscopy. Anal. Chem. 2012, 84, 10338–10344. [CrossRef] [PubMed]
Materials 2017, 10, 650
25.
26.
27.
28. 29.
30. 31.
32.
33. 34.
35.
36. 37.
38. 39.
40.
41.
42.
11 of 11
Xu, S.; Jiang, S.; Wang, J.; Wei, J.; Yue, W.; Ma, Y. Graphene isolated Au nanoparticle arrays with high reproducibility for high-performance surface-enhanced Raman scattering. Sens. Actuators B 2016, 222, 1175–1183. [CrossRef] Ge, J.; Li, Y.; Wang, J.; Pu, Y.; Xue, W.; Liu, X. Green synthesis of graphene quantum dots and silver nanoparticles compounds with excellent surface enhanced Raman scattering performance. J. Alloys Compd. 2016, 663, 166–171. [CrossRef] Ling, X.; Fang, W.; Lee, Y.H.; Araujo, P.T.; Zhang, X.; Rodriguez-Nieva, J.F.; Lin, Y.; Zhang, J.; Kong, J.; Dresselhaus, M.S. Raman enhancement effect on two-dimensional layered materials: Graphene, h-BN and MoS2 . Nano Lett. 2014, 14, 3033–3040. [CrossRef] [PubMed] Muehlethaler, C.; Considine, C.R.; Menon, V.; Lin, W.-C.; Lee, Y.-H.; Lombardi, J.R. Ultrahigh Raman Enhancement on Monolayer MoS2 . ACS Photonics 2016, 3, 1164–1169. [CrossRef] Najmaei, S.; Mlayah, A.; Arbouet, A.; Girard, C.; Leotin, J.; Lou, J. Plasmonic Pumping of Excitonic Photoluminescence in Hybrid MoS2 -Au Nanostructures. ACS Nano 2014, 8, 12682–12689. [CrossRef] [PubMed] Lombardi, J.R.; Birke, R.L. Theory of Surface-Enhanced Raman Scattering in Semiconductors. J. Phys. Chem. C 2014, 118, 11120–11130. [CrossRef] Su, S.; Zhang, C.; Yuwen, L.; Chao, J.; Zuo, X.; Liu, X.; Song, C.; Fan, C.; Wang, L. Creating SERS hot spots on MoS2 nanosheets with in situ grown gold nanoparticles. ACS Appl. Mater. Interfaces 2014, 6, 18735–18741. [CrossRef] [PubMed] Wu, J.-Y.; Zhang, X.-Y.; Ma, X.-D.; Qiu, Y.-P.; Zhang, T. High quantum-yield luminescent MoS2 quantum dots with variable light emission created via direct ultrasonic exfoliation of MoS2 nanosheets. RSC Adv. 2015, 5, 95178–95182. [CrossRef] Liu, T.; Chao, Y.; Gao, M.; Liang, C.; Chen, Q.; Song, G.; Cheng, L.; Liu, Z. Ultra-small MoS2 nanodots with rapid body clearance for photothermal cancer therapy. Nano Res. 2016, 9, 3003–3017. [CrossRef] Li, J.F.; Anema, J.R.; Wandlowski, T.; Tian, Z.Q. Dielectric shell isolated and graphene shell isolated nanoparticle enhanced Raman spectroscopies and their applications. Chem. Soc. Rev. 2015, 44, 8399–8409. [CrossRef] [PubMed] Li, J.F.; Tian, X.D.; Li, S.B.; Anema, J.R.; Yang, Z.L.; Ding, Y.; Wu, Y.F.; Zeng, Y.M.; Chen, Q.Z.; Ren, B.; et al. Surface analysis using shell-isolated nanoparticle-enhanced Raman spectroscopy. Nat. Protoc. 2013, 8, 52–65. [CrossRef] [PubMed] Li, J.F.; Huang, Y.F.; Ding, Y.; Yang, Z.L.; Li, S.B.; Zhou, X.S.; Fan, F.R.; Zhang, W.; Zhou, Z.Y.; Wu, D.Y.; et al. Shell-isolated nanoparticle-enhanced Raman spectroscopy. Nature 2010, 464, 392–395. [CrossRef] [PubMed] Kim, J.; Byun, S.; Smith, A.J.; Yu, J.; Huang, J. Enhanced Electrocatalytic Properties of Transition-Metal Dichalcogenides Sheets by Spontaneous Gold Nanoparticle Decoration. J. Phys. Chem. Lett. 2013, 4, 1227–1232. [CrossRef] [PubMed] Chikan, V.; Kelley, D.F. Size-dependent spectroscopy of MoS2 nanoclusters. J. Phys. Chem. B 2002, 106, 3794–3804. [CrossRef] Dinish, U.S.; Yaw, F.C.; Agarwal, A.; Olivo, M. Development of highly reproducible nanogap SERS substrates: Comparative performance analysis and its application for glucose sensing. Biosens. Bioelectron. 2011, 26, 1987–1992. [CrossRef] [PubMed] Teo, W.Z.; Chng, E.L.K.; Sofer, Z.; Pumera, M. Cytotoxicity of Exfoliated Transition-Metal Dichalcogenides (MoS2 , WS2 , and WSe2 ) is Lower than That of Graphene and its Analogues. Chemistry 2014, 20, 9627–9632. [CrossRef] [PubMed] Zhang, X.D.; Zhang, J.; Wang, J.; Yang, J.; Chen, J.; Shen, X.; Deng, J.; Deng, D.; Long, W.; Sun, Y.M.; et al. Highly Catalytic Nanodots with Renal Clearance for Radiation Protection. ACS Nano 2016, 10, 4511–4519. [CrossRef] [PubMed] Dresselhaus, M.S.; Jorio, A.; Hofmann, M.; Dresselhaus, G.; Saito, R. Perspectives on Carbon Nanotubes and Graphene Raman Spectroscopy. Nano Lett. 2010, 10, 751–758. [CrossRef] [PubMed] © 2017 by the authors. Licensee MDPI, Basel, Switzerland. This article is an open access article distributed under the terms and conditions of the Creative Commons Attribution (CC BY) license (http://creativecommons.org/licenses/by/4.0/).