Design Automation for Embedded Systems, 2, 5–32 (1996)
c 1996 Kluwer Academic Publishers, Boston. Manufactured in The Netherlands. °
System Level Hardware/Software Partitioning Based on Simulated Annealing and Tabu Search PETRU ELES
[email protected];
[email protected] Department of Computer and Information Science, Link¨oping University, S-58183 Link¨oping, Sweden and Computer Science and Engineering Department, Technical University Timisoara, Bv. V. Parvan Nr. 2, RO-1900 Timisoara, Romania ZEBO PENG
[email protected] Department of Computer and Information Science, Link¨oping University, S-58183 Link¨oping, Sweden KRZYSZTOF KUCHCINSKI
[email protected] Department of Computer and Information Science, Link¨oping University, S-58183 Link¨oping, Sweden ALEXA DOBOLI
[email protected] Computer Science and Engineering Department, Technical University Timisoara, Bv. V. Parvan Nr. 2, RO-1900 Timisoara, Romania Received February 6, 1996; Revised June 10, 1996 Abstract. This paper presents two heuristics for automatic hardware/software partitioning of system level specifications. Partitioning is performed at the granularity of blocks, loops, subprograms, and processes with the objective of performance optimization with a limited hardware and software cost. We define the metric values for partitioning and develop a cost function that guides partitioning towards the desired objective. We consider minimization of communication cost and improvement of the overall parallelism as essential criteria during partitioning. Two heuristics for hardware/software partitioning, formulated as a graph partitioning problem, are presented: one based on simulated annealing and the other on tabu search. Results of extensive experiments, including real-life examples, show the clear superiority of the tabu search based algorithm. Keywords: Hardware/software partitioning, co-synthesis, iterative improvement heuristics, simulated annealing, tabu search.
1.
Introduction
New tools which extend design automation to system level have to support the integrated design of both the hardware and software components of an embedded system [39], [18]. The input specification accepted by such design tools describes the functionality of the system together with some design constraints and is typically given as a set of interacting processes. Many embedded systems have strong requirements concerning the expected performance. Satisfaction of these performance constraints can frequently be achieved only by hardware implementation of some components of the specified system. This can be realized by using dedicated ASICs (application specific integrated circuits) or FPGAs (fieldprogrammable gate arrays) as part of the implementation architecture. Another solution in
6
ELES, PENG, KUCHCINSKI, AND DOBOLI
order to meet design requirements is to develop an ASIP (application specific instructionset processor) with a carefully selected instruction-set and architecture, which produces the required performance for the given application [20]. The term “hardware/software co-design” is used today to denote the cooperative development process of both the hardware and the software components of a system. According to traditional methodologies the hardware and software parts of an application are separately developed and their final integration is based on ad hoc methods, which increases time-to-market and cost, and very often decreases quality and reliability of the product. Research in hardware/software co-design aims to develop methodologies and tools for a systematic and concurrent development of the hardware and software components, providing interaction and exploration of trade-offs along the whole design process. Thus, the actual area of co-design covers several aspects of the design process: system specification and modeling, co-simulation of heterogeneous systems, partitioning, system verification, compilation, hardware and software synthesis, interface generation, performance and cost estimation, and optimization. The reader can find overviews concerning the main trends of this very dynamic area in [7], [9], [11], [12], [18], [31], [39]. This paper concentrates on the selection of the appropriate part of the system for hardware and software implementation respectively, known as the hardware/software partitioning problem. Hardware/software partitioning is one of the main challenges during the design of embedded applications, as it has a crucial impact both on the cost and the overall performance of the resulted product. For small systems with a very well understood structure and functionality, the number of realistic alternatives of hardware/software partitioning is small. Thus, assignment of functionality to the hardware and software domains can be performed using an ad hoc approach based on the designer’s experience and intuition [6]. The main problems to be solved are in this case hardware and software synthesis, co-simulation, and interface generation. If the specified system is large, with a complex functionality resulting from a high number of interacting components, the number of partitioning alternatives is extremely large and their impact on cost and performance cannot be estimated without support of a design tool [18]. Different partitioning schemes can be investigated with support of high performance heuristics based on adequate cost functions and estimations. Such a computer aided partitioning technique is a crucial component of any co-design environment [8]. Several approaches have been presented for the partitioning of hardware/software systems. They differ in the initial specification, the level of granularity at which partitioning is performed, the degree of automation of the partitioning process, the cost function, and the partitioning algorithm. In [23], [17], [3], [34], [38], [1], [33] automatic partitioning is performed, while the approaches presented in [2], [14], [27], [10] are based on manual partitioning. Partitioning at a fine grained level is performed in [23], [17], [3]. In [2], [28], [38], [1], [41] partitioning is performed at a coarser granularity. Iterative improvement algorithms based on neighborhood search are widely used for hardware/software partitioning. In order to avoid being trapped in a local minimum heuristics are implemented which are very often based on simulated annealing [17], [35], [1]. This is mainly due to the fact that simulated annealing algorithms can be quickly implemented
SYSTEM LEVEL HARDWARE/SOFTWARE PARTITIONING
7
and are widely applicable to many different problems. At the same time a limitation of this method is the relatively long execution time and the large amount of experiments needed to tune the algorithm. In [38] a hardware/software partitioning algorithm is proposed which combines a hill climbing heuristic with binary search algorithm. It minimizes hardware cost while satisfying certain performance constraints. This differs from our approach which tries to maximize performance under given hardware and software cost constraint. The partitioning strategy presented in [28] combines a greedy algorithm with an outer loop algorithm which takes into account global measures. Similar to [34] and [41] this approach is based on exact knowledge of execution times for each task implemented in hardware or software and of all communication times. These assumptions impose hard restrictions on the features of the system specifications accepted as input. In our approach we do not necessarily impose such limitations, which broadens the range of applications. Integer Linear Programming formulations of the hardware/software partitioning problem are proposed in [5], [33]. The approach described in [1] is similar to ours in the sense that performance has to be maximized (in terms of execution time) choosing the appropriate implementation technology for a set of tasks, under certain cost assumptions. Estimations used during optimization, which is based on simulated annealing, are valid only under the assumption of a single, statically scheduled process as the software component. Our design environment accepts as input a system level, implementation independent specification of an application. The synthesized system has to produce maximal performance (in terms of execution speed) using a given amount of hardware and software resources. Automatic partitioning at a coarse grain level (process, subprogram, loop, block) is our approach to achieve this goal during system level design. As performance and cost estimations at this level are inherently approximate, our design process allows re-partitioning in later steps which is performed by moving functionality from one domain to the other, if needed [37]. Our partitioning strategy is based on metric values derived from profiling (simulation), static analysis of the specification, and cost estimations. We consider that minimization of communication cost between the software and the hardware partition and improvement of the overall parallelism are of outstanding importance during partitioning at system level. Relatively low performances reported in [34] and [14] are, for example, caused by high communication costs between the hardware and software domains, which have not been minimized. We have implemented first a simulated annealing based algorithm for hardware/software partitioning. We show that important reduction of execution time can be achieved by considering even small application specific improvements at algorithm design. We then implemented our partitioning algorithm using the tabu search method. Based on extensive experiments we show that tabu search results in much better execution speed and clearly outperforms simulated annealing. The paper is divided into 5 sections. Section 2 introduces the structure of the hardware/software co-synthesis environment and discusses some assumptions concerning the input specification and the target architecture. Partitioning steps, the metric values, and the proposed cost function are presented in section 3. In section 4 we discuss our simulated
8
ELES, PENG, KUCHCINSKI, AND DOBOLI
Figure 1. Overview of the co-synthesis environment.
annealing and tabu search based partitioning heuristics, evaluate their performance and compare them based on results of extensive experiments. Finally, section 5 presents the conclusions. 2.
The Co-Synthesis Environment
An overview of the structure of our hardware/software co-synthesis environment is depicted in Figure 1. The input specification describes system functionality without prescribing the hardware/software boundary or implementation details. A basic assumption is that this specification is formulated as a set of processes interacting via messages transmitted through communication channels. We also assume that this specification is executable and that profiling information can be generated. The current implementation accepts input designs specified in an extended VHDL which includes a synchronous message passing mechanism for process communication. The interprocess synchronization and communication mechanism provided by standard VHDL [25] is at a low level and its semantics is defined in terms of simulation. This makes reasoning about processes and their interaction as well as synthesis extremely difficult and inefficient. In [15] we present a model for system-level specification of interacting VHDL processes and describe the synthesis strategy we have developed for it. According to the model, processes are the basic modules of the design, and they interact using a synchronous
SYSTEM LEVEL HARDWARE/SOFTWARE PARTITIONING
9
message passing mechanism with predefined send/receive commands. Communication channels are represented by VHDL signals. Using this model, communication interfaces between processes can be easily established or modified during automatic partitioning, when new processes are created or functionality is moved from one process to another. Designs formulated according to this model are translated by a simple preprocessor into standard VHDL models for simulation purpose [15]. In the context of our co-synthesis environment, a VHDL description corresponding to our system-level specification model can be simulated, partitioned, and synthesized into hardware and software components. When the final partitioning is done, the hardware implementation is synthesized by the CAMAD high-level synthesis (HLS) system [36]. The hardware implementation is considered as a specialized coprocessor which interacts with the software generated by a compiler [21]. We have made the following assumptions concerning the target architecture: 1. There is a single programmable component (microprocessor) executing the software processes (with a run-time system performing dynamic scheduling); 2. The microprocessor and the hardware coprocessor are working in parallel (the architecture does not enforce a mutual exclusion between the software and hardware); 3. Reducing the amount of communication between the microprocessor (software partition) and the hardware coprocessor (hardware partition) improves the overall performance of the application. This paper concentrates on the front-end of the co-synthesis environment, which performs extraction of performance critical regions and hardware/software partitioning. 3.
Partitioning Steps and the Cost Function
Partitioning starts from an initial system specification described as a set of processes interacting through communication channels. This specification is further decomposed into units of smaller granularity. The partitioning algorithm generates as output a model consisting of two sets of interacting processes: the processes in one set are marked as candidates for hardware implementation, while the processes in the other set are marked as software implementation candidates. The main goal of partitioning is to maximize performance in terms of execution speed. In order to achieve this we distribute functionality between the software and the hardware partitions taking into account communication cost and overall parallelism of the synthesized system. Thus, the following three objectives have to be considered: 1. To identify basic regions (processes, subprograms, loops, and blocks of statements) which are responsible for most of the execution time in order to be assigned to the hardware partition; 2. To minimize communication between the hardware and software domains; 3. To increase parallelism within the resulted system at the following three levels:
10
ELES, PENG, KUCHCINSKI, AND DOBOLI
–
internal parallelism of each hardware process (during high-level synthesis, operations are scheduled to be executed in parallel by the available functional units);
–
parallelism between processes assigned to the hardware partition;
–
parallelism between the hardware coprocessor and the microprocessor executing the software processes.
The partitioning algorithm takes into account simulation statistics, information from static analysis of the source specification, and cost estimations. At the same time, all major decisions taken by the design tool can be influenced through user interaction. Statistics data are collected from simulation of an internal representation generated by a front-end compiler, loading the system with sets of typical input stimuli. Two types of statistics are used by the partitioning algorithm: 1. Computation load (CL) of a basic region is a quantitative measure of the total computation executed by that region, considering all its activations during the simulation process. It is expressed as the total number of operations (at the level of internal representation) executed inside that region, where each operation is weighted with a coefficient depending on its relative complexity: X N act j × φopj ; N act j is the number of activations of C Li = op j ∈B Ri
operation op j belonging to the basic region B Ri ; φopj is the weight associated to that operation. The relative computation load (RCL) of a block of statements, loop, or a subprogram is the computation load of the respective basic region divided by the computation load of the process the region belongs to. The relative computation load of a process is the computation load of that process divided by the total computation load of the system. 2. Communication intensity (CI) on a channel connecting two processes is expressed as the total number of send operations executed on the respective channel. 3.1.
The Partitioning Steps
Hardware/software partitioning is performed in four steps, which are shown in Figure 2: 1. Extraction of blocks of statements, loops, and subprograms: During the first partitioning step processes are examined individually to identify performance critical regions that are responsible for most of the execution time spent inside a process (regions with a large CL). Candidate regions are typically loops and subprograms, but can also be blocks of statements with a high CL. The designer guides identification and extraction of the regions and decides implicitly on the granularity of further partitioning steps in two ways: a.
By identifying a certain region to be extracted (regardless of its CL) and assigning it to the hardware or software partition (see also section 3.3.). This, for instance,
SYSTEM LEVEL HARDWARE/SOFTWARE PARTITIONING
11
Figure 2. The partitioning steps.
can be the case for some statement sequence on which a hard time constraint has been imposed which can be satisfied only by hardware implementation. b.
By imposing two boundary values: – –
a threshold X on the RCL of processes that are examined for basic region extraction; a threshold Y on the RCL of a block, loop, or subprogram to be considered for basic region extraction.
The search for candidate regions in processes with RCL greater than X is performed bottom-up, starting from the inner blocks, loops, and the subprograms that are not containing other basic regions. When a region has been identified for extraction, a new process is built to have the functionality of the original block, loop, or subprogram and communication channels are established to the parent process. In [16] we show how extraction of critical regions and process generation is solved in our current implementation. 2. Process graph generation: During the second step an internal structure, called the process graph, is generated. This step will be discussed in section 3.2.
12
ELES, PENG, KUCHCINSKI, AND DOBOLI
3. Partitioning of the process graph: We formulate hardware/software partitioning as a graph partitioning problem performed on the process graph. In section 4 we present two algorithms which have been implemented for graph partitioning and compare their performance. 4. Process merging: During the first step one or several child processes are possibly extracted from a parent process. If, as result of step 3, some of the child processes are assigned to the same partition with their parent process, they are, optionally, merged back together. 3.2.
The Process Graph
The input to the second partitioning step is a set of interacting processes. Some of them are originally specified by the designer, others are generated during extraction of basic regions. Statistics concerning computation load of the generated processes and communication intensity on the newly created channels are automatically recomputed during the first partitioning step. The data structure on which hardware/software partitioning is performed is the process graph. Each node in this graph corresponds to a process and an edge connects two nodes if and only if there exists at least one direct communication channel between the corresponding processes. The graph partitioning algorithm takes into account weights associated to each node and edge. Node weights reflect the degree of suitability for hardware implementation of the corresponding process. Edge weights measure communication and mutual synchronization between processes. The weights capture simulation statistics (CL, RCL, and CI) and information extracted from static analysis of the system specification or of the internal representation resulted after its compilation. The following data extracted from static analysis are captured: Nr opi : total number of operations in the dataflow graph of process i; Nr kind opi : number of different operations in process i; L path i : length of the critical path (in terms of data dependency) through process i. The weight assigned to process node i, has two components. The first one, W 1iN , is equal to the CL of the respective process. The second one is calculated by the following formula: W 2iN = M C L × K iC L + M U × K iU + M P × K iP − M S O × K iS O ; where: K iC L is equal to the RCL of process i, and thus is a measure of the computation load; K iU =
Nr opi ; K iU is a measure of the uniformity of operations in process i; Nr kind opi
K iP =
Nr opi ; K iP is a measure of the potential parallelism inside process i; L path i
SYSTEM LEVEL HARDWARE/SOFTWARE PARTITIONING
P K iS O
=
op j ∈S Pi
13
wopj
; K iS O captures the suitability of operations of process i for softnr opi ware implementation. S Pi is the set of such operations (floating point computation, file access, pointer operations, recursive subprogram call, etc.) in process i and wopj is a weight associated to operation op j , measuring the degree to which the operation has to be implemented in software; a large weight associated to such an operation dictates software implementation for the given process, regardless of other criteria. The relation between the above-named coefficients K C L , K U , K P , K S O is regulated by four different weight-multipliers: M C L , M U , M P , and M S O , controlled by the designer. Both components of the weight assigned to an edge connecting nodes i and j depend on the amount of communication between processes i and j. The first one is a measure of the total data quantity transferred between the two processes. The second one does not consider the number of bits transferred but only the degree of synchronization between the processes, expressed in the total number of mutual interactions they are involved in: X X wdck × C Ick ; W 2iEj = C Ick ; W 1iEj = ck ∈Ch i j
ck ∈Ch i j
where Ch i j is the set of channels used for communication between processes i and j; wdck is the width (number of transported bits) of channel ck in bits; C Ick is the communication intensity on channel ck . 3.3.
Cost Function and Constraints
After generation of the process graph hardware/software partitioning can be performed as a graph partitioning task. The weights associated to the nodes and edges must be combined into a cost function which guides partitioning towards the desired objective and has to be easily updated after passing from a current solution to a new one. Our hardware/software partitioning heuristics are guided by the following cost function which is to be minimized: P W 2iEj P ∃(i j) X N (i)∈H w W 1i W 1iEj + Q2 × C(H w, Sw) = Q1 × N H (i j)∈cut ! ÃP P N N (i)∈H w W 2i (i)∈Sw W 2i ; − Q3 × − NH NS where H w and Sw are sets representing the hardware and the software partition respectively; N H and N S are the cardinality of the two sets; cut is the set of edges connecting the two partitions; (i j) is the edge connecting nodes i and j; and (i) represents node i. Minimization of this function produces an implementation which corresponds to the partitioning objectives stated at the beginning of section 3. The partitioning objectives are captured by the three terms of the cost function: –
The first term represents the total amount of communication between the hardware and the software partition. Decreasing this component of the cost function reduces the total
14
ELES, PENG, KUCHCINSKI, AND DOBOLI
amount of communication between partitions, which is a primary design goal. As a second effect it also improves parallelism between processes in the hardware partition and those implemented in software. This is an implicit result of reduced interaction between the two partitions. –
The second term stimulates placement into hardware of processes which have a reduced amount of interaction with the rest of the system relative to their computation load and, thus, are active most of the time. This strategy improves parallelism between processes inside the hardware partition where P physical resources are allocated for real parallel execution. For a given process i, ( ∃(i j) W 2iEj )/W 1iN is the total amount of interaction the process is involved in, relative to its computation load. The whole term represents the average of this value over the nodes in the hardware partition.
–
The third term in the cost function pushes processes with a high node weight into the hardware partition and those with a low node weight into the software one, by increasing the difference between the average weight of nodes in the two partitions. This is a basic objective of partitioning as it places time critical regions into hardware and also exploits the potential of hardware to implement internal parallelism of processes.
The criteria combined in the cost function are not orthogonal, and sometimes compete with each other. Moving a high node weight process into hardware, for instance, can produce an increase in the communication between partitions. This competition between partitioning objectives is controlled by the designer through the cost multipliers Q1, Q2, and Q3 which regulate the relative influence of the different metrics. Minimization of the cost function has to be performed in the context of certain constraints. Thus, our heuristics have to produce a partitioning with a minimum for C(H w, Sw), so that the total hardware and software cost is within some user specified limits: X X H costi ≤ Max H ; S costi ≤ Max S . (i)∈H w
(i)∈Sw
A preassignment of processes which are definitively assigned to one of the partitions can be performed optionally by the designer. Often this preassignment is formulated in terms of the weights: nodes with a weight smaller than a given limit have to go into software and those with a weight greater than a certain limit should be assigned to hardware: W 2iN ≥ Lim1 ⇒ (i) ∈ H w;
W 2iN ≤ Lim2 ⇒ (i) ∈ Sw.
Cost estimation has to be performed before graph partitioning, for both the hardware and software implementation alternatives of the processes. In the current implementation of our environment, the CAMAD high level synthesis system [36] produces hardware cost estimations in terms of design area. Software cost, in terms of memory size, is estimated for each process through compilation by our VHDL to C compiler [21]. 4.
Partitioning Algorithms and Experimental Results
As a final step of the hardware/software partitioning process the weighted graph is to be partitioned into two subgraphs. The partitions containing nodes assigned to hardware and
15
SYSTEM LEVEL HARDWARE/SOFTWARE PARTITIONING
Table 1. Characteristics of the random graphs. number of nodes 20 40 100 400
probability 0.1 0.05 0.015 0.008
0.15 0.1 0.02 0.015
0.2 0.15 0.05 0.025
0.25 0.2 0.1 0.04
software respectively, are generated so that design constraints are satisfied and the cost function is minimal. Hardware/software partitioning, formulated as a graph partitioning problem, is NP complete. In order to efficiently explore the solution space, heuristics have to be developed which hopefully converge towards an optimal or near-optimal solution. We have implemented two such algorithms, one based on simulated annealing (SA) and the other on tabu search (TS). Both perform neighborhood search and, to avoid being trapped by a local optimum, they allow, at certain stages of the search, uphill moves performed in a controlled manner. In this section we discuss the two algorithms, evaluate their performance and compare them based on results of extensive experiments. 4.1.
Experimental Evaluation of the Partitioning Algorithms
For evaluation of the partitioning algorithms we used both random and geometric graphs [40] generated for experimental purpose, and graphs resulted from compilation of two real-life examples (see sections 4.4 and 4.5). Random graphs are defined by two characteristics: the number of nodes and a constant specifying the probability that any given pair of nodes is connected. Geometric graphs are defined by their number of nodes and the expected average degree of the nodes. Different from random graphs, geometric graphs are not uniformly connected but present clusters in their structure. Weights and costs are assigned to the graph components during generation. We generated for our experiments 32 graphs altogether, 16 random and 16 geometric. Eight graphs (4 random, 4 geometric) have been generated for each dimension of 20, 40, 100, and 400 nodes. The characteristics of the 16 random graphs are given in Table 1. We generated geometric graphs with an average degree of 0.85, 2, 4, and 10, for each of the four dimensions. Experiments have been carried out assuming the following main objectives: –
To tune the algorithms for each graph dimension and to determine values of the generic parameters so that partitioning converges with a high probability towards an optimum for all test graphs of the given dimension and the run time is minimized.
–
To compare efficiency of the two algorithms.
It still has to be clarified what we call an optimum in this context. For the 20 node graphs it was possible to run exhaustive search to get the real optimum which we later
16
ELES, PENG, KUCHCINSKI, AND DOBOLI
Figure 3. Simulated annealing algorithm.
used as a reference value. For each of the other graphs we performed, in preparation to the experiments, very long and extremely expensive runs (both in terms of time and computing power) using both SA and TS. We used aggressively very long cooling schedules, for SA, and a high number of restarting tours, for TS (see sections 4.2 and 4.3). These runs have been performed starting with different initial configurations and finally the best ever solution produced for each graph (in terms of minimal value of the cost function) has been considered as the optimum for the further experiments. During experiments with SA an additional difficulty originates from the random nature of this algorithm. The same implementation with unchanged parameters can produce different results, for the same graph, in different runs. During our experiments we considered that a certain configuration of parameters produces an optimum for a graph, with a sufficient probability, if for 100 consecutive runs of the SA algorithm we got each time the optimal partitioning. All experiments presented in the paper were run on SPARCstation 10.
4.2.
Partitioning with Simulated Annealing
Simulated annealing selects the neighboring solution randomly and always accepts an improved solution. It also accepts worse solutions with a certain probability that depends on the deterioration of the cost function and on a control parameter called temperature [30]. In Figure 3 we give a short description of the algorithm. With x we denote one solution consisting of the two sets H w and Sw. x now represents the current solution and N (x now ) denotes the neighborhood of x now in the solution space. For implementation of this algorithm the parameters TI (initial temperature), TL (temperature length), α (cooling ratio), and the stopping criterium have to be determined. They define the so called cooling schedule and have a decisive impact on the quality of the partitioning and the CPU time consumed. As result of our experiments we determined for each
17
SYSTEM LEVEL HARDWARE/SOFTWARE PARTITIONING
Table 2. Cooling schedules. TI
α
TL
number of nodes 20 40 100 400
SM
IM
SM
IM
SM
IM
400 500 500 1400
400 450 450 1200
90 200 500 7500
75 150 200 2750
0.96 0.98 0.98 0.998
0.95 0.97 0.97 0.995
graph dimension values for TI, TL, and α which are presented in Table 2. Two values have been determined for each parameter: one corresponds to the SA algorithm that uses simple moves (SM) at generation of a new solution, the other to the algorithm based on improved moves (IM) which will be explained later. With cooling schedules defined by these values the algorithms produced an optimal partitioning for each graph with the respective number of nodes. The definition of the stopping criterium assumes that the system is considered as frozen if for three consecutive temperatures no new solution has been accepted. A problem specific component of the SA algorithm is the generation of a new solution x 0 starting from the current one x now . We implemented two strategies for solution generation: the simple move and the improved move. For the simple move a node is randomly selected for being moved to the other partition. The configuration resulted after this move becomes the candidate solution x 0 . Random node selection is repeated if transfer of the selected node violates some design constraints. The improved move accelerates convergence by moving together with the randomly selected node also some of its direct neighbors (nodes which are in the same partition and are directly connected to it). A direct neighbor is moved together with the selected node if this movement improves the cost function and does not violate any constraint. This strategy stimulates transfer of connected node groups instead of individual nodes. Experiments revealed a negative side effect of this strategy: the repeated move of the same or similar node groups from one partition to the other, which resulted in a reduction of the spectrum of visited solutions. To produce an optimal exploration of the solution space we combined movement of node groups with that of individual nodes: nodes are moved in groups with a certain probability p. After analysis of experimental results the value for p was fixed at 0.75. In Figure 4 we present the algorithm for generation of a candidate solution according to the improved move. The improved move has been developed as result of a problem specific design of the neighborhood structure. The influence of this solution on the cooling schedule is shown in Table 2. The reduction of TI, TL, and α produces a reduction of the cooling time and consequently of partitioning time. Partitioning times and the speedup produced by the improved strategy are presented in Table 3 and in Figure 5. The times shown are the average CPU time needed for running the SA algorithm, with the parameters given in Table 2, for all graphs of the given dimension. The speedup, which already is significant for small graphs, is growing with the number of nodes and becomes more than 400% for 400 nodes graphs.
18
ELES, PENG, KUCHCINSKI, AND DOBOLI
Figure 4. Generation of a new solution with improved move. Table 3. Partitioning time with SA. CPU time (s) number of nodes 20 40 100 400
speedup SM
IM
0.28 1.57 7.88 4036
0.23 1.27 2.33 769
22% 24% 238% 425%
Figures 6, 7 (for 100 nodes) and 8, 9 (for 400 nodes) illustrate the strategy of solution space exploration followed by the SA algorithm. A comparison of the curves in Figures 6 and 8 with those in Figures 7 and 9 respectively, demonstrates the much faster convergence provided by the improved moves. In Figures 8 and 9, illustrating the design space exploration for 400 nodes, it is easy to observe the difference between the average quality of the visited solutions for the simple and improved moves. Evolving on a path which is much closer to the best solution, exploration with improved moves reaches faster the optimal partitioning. 4.3.
Partitioning with Tabu Search
In contrast to simulated annealing, tabu search controls uphill moves not purely randomly but in an intelligent way. The tabu search approach accepts uphill moves and stimulates convergence toward a global optimum by creating and exploiting data structures to take advantage of the search history at selection of the next move [19]. Two key elements of the TS algorithm are the data structures called short and long term memory. Short term memory stores information relative to the most recent history of the search. It is used in order to avoid cycling that could occur if a certain move returns to a recently visited solution. Long term memory, on the other side, stores information on the global evolution of the algorithm. These are typically frequency measures relative to the occurrence of a certain event. They can be applied to perform diversification which is meant to improve exploration of the solution space by broadening the spectrum of visited solutions. In Figure 10 we give a brief description of our implementation of the TS algorithm. In
19
SYSTEM LEVEL HARDWARE/SOFTWARE PARTITIONING
Figure 5. Partitioning times with SA: simple moves (SM) and improved moves (IM). Table 4. Parameters and CPU time with TS. numbers of nodes
τ
Nr f b
Nr r
CPU time (s)
20 40 100 400
7 7 7 18
30 50 50 850
0 0 0 2
0.008 0.04 0.19 30.5
a first attempt an improving move is tried. If no such move exists (or it is tabu and not aspirated) frequency based penalties are applied to the cost function and the best possible non tabu move is performed; this move can be an uphill step. Finally, in a last attempt, the move which is closest to leave the tabu state is executed. We consider as a candidate solution xk the configuration obtained from x now by moving node k from its current partition to the other one, if this movement does not violate any constraints. In the tabu list we store the list of the reverse moves of the last τ moves performed, which are considered as being forbidden (tabu). The size τ of this list (the tabu tenure) is an essential parameter of the algorithm. In Table 4 we present the optimal values for τ as resulted from our experiments. Under certain circumstances it can be useful to ignore the tabu character of a move (the tabu is aspirated). The tabu status should be overridden when the selected move improves the search and it does not produce any cycling in the exploration of the design space. We ignore the tabu status of a move if the solution produced is better than the best obtained so far. For diversification purpose we store (in the long term memory structure) the number of iterations each node has spent in the hardware partition. Three means of improving the search strategy by diversification have been implemented:
20
ELES, PENG, KUCHCINSKI, AND DOBOLI
Figure 6. Variation of cost function during simulated annealing with simple moves for 100 nodes.
1. For the second attempt to generate a new configuration (Figure 10) moves are ordered according to a penalized cost function which favors the transfer of nodes that have spent a long time in their current partition: P i |1C i | 0 × pen(k) 1Ck = 1Ck + Nr o f nodes where
pen(k) =
−C H ×
N ode in H wk Niter
µ ¶ N ode in H wk −C S × 1 − Niter
if node k ∈ H w if node k ∈ Sw
N ode in H wk is the number of iterations node k spent in the hardware partition; Niter is the total number of iterations; Nr o f nodes is the total number of nodes; Coefficients have been experimentally set to C H = 0.4 and C S = 0.15. 2. We consider a move as forbidden (tabu) if the frequency of occurrences of the node in its current partition is smaller than a certain threshold; thus, a move of node k can be accepted if: N ode in H wk > TH Niter ¶ µ N ode in H wk > Ts 1− Niter
if node k ∈ H w if node k ∈ Sw
SYSTEM LEVEL HARDWARE/SOFTWARE PARTITIONING
Figure 7. Variation of cost function during simulated annealing with improved moves for 100 nodes.
Figure 8. Variation of cost function during simulated annealing with simple moves for 400 nodes.
21
22
ELES, PENG, KUCHCINSKI, AND DOBOLI
Figure 9. Variation of cost function during simulated annealing with improved moves for 400 nodes.
Figure 10. Tabu search algorithm.
SYSTEM LEVEL HARDWARE/SOFTWARE PARTITIONING
23
The thresholds have been experimentally set to TH = 0.2 and TS = 0.4. 3. If the system is frozen (more than Nr f b iterations have passed since the current best solution was found) a new search can be started from an initial configuration which is different from those encountered previously. The total number of iterations performed for partitioning is influenced by parameters Nr f b (number of iterations without improvement of the solution after which the system is considered frozen) and Nr r (number of restarts with a new initial configuration). The minimal values needed for an optimal partitioning of all graphs of the respective dimension and the resulted CPU times are presented in Table 4. The times have been computed as the average of the partitioning time for all graphs of the given dimension. It is interesting to mention that restarting tours were necessary only for the 400 nodes graphs. Figures 11 and 12 illustrate the strategy of design space exploration for the TS algorithm applied to a 400 nodes and 100 nodes graph respectively. Figure 12 shows a very fast convergence for 100 nodes, without restarting tours. Partitioning of the 400 nodes graph needed two restarting tours for diversification, which is shown in Figure 11. The two additional detail pictures given in this figure focus successively on the area close to the optimum, in order to illustrate how the algorithm guides the exploration of the solution space towards an optimum by a succession of diversification moves, uphill and improving steps. 4.4.
Comparative Evaluation of the SA and TS Approaches
The experiments presented in the previous sections lead to the following main conclusions concerning hardware/software partitioning based on SA and on TS respectively: 1. Near-optimal partitioning can be produced both by the SA and TS based algorithm. 2. SA is based on a random exploration of the neighborhood while TS is completely deterministic. The deterministic nature of TS makes experimental tuning of the algorithm and setting of the parameters less laborious than for SA. At the same time adaptation of the SA strategy for a particular problem is relatively easy and can be performed without a deep study of domain specific aspects. Although, specific improvements can result, as we have shown, in large gains of performance. On the contrary, development of a TS algorithm is more complex and has to consider particular aspects of the given problem. 3. Performances obtained with TS are excellent and are definitely superior in comparison to those given by SA (on average more than 20 times faster), as shown in Table 5 and in Figure 13. This conclusion is very important especially in the context that, to our knowledge, no TS based hardware/software partitioning approach has yet been reported, while SA continues to be one of the most popular approaches for automatic partitioning. Finally, we compared our SA and TS-based heuristics with a classical iterative-improvement approach, the Kernighan-Lin (KL) algorithm [29]. Given the relatively limited capacity of the KL-based algorithm to escape from local minima and its sensitivity to the
24
ELES, PENG, KUCHCINSKI, AND DOBOLI
Figure 11. Variation of cost function during tabu search partitioning for 400 nodes.
25
SYSTEM LEVEL HARDWARE/SOFTWARE PARTITIONING
Figure 12. Variation of cost function during tabu search partitioning for 100 nodes. Table 5. Partitioning times with SA and TS. CPU time (s) number of nodes SAa (tSA )
TS (tTS )
0.23 1.27 2.33 769
0.008 0.04 0.19 30.5
20 40 100 400
a. SA algorithm with improved moves.
Figure 13. Partitioning times with SA, TS, and KL.
tTS /tSA 0.034 0.031 0.081 0.039
26
ELES, PENG, KUCHCINSKI, AND DOBOLI
initial configuration, we had to perform several runs for each graph, with randomly selected starting configurations. The number of necessary restarting tours differs depending on the graph dimension. It has been fixed so that all graphs of a given dimension are optimally partitioned with a sufficiently high probability (for 100 consecutive runs we got each time the optimal partitioning, in the sense introduced in section 4.1). As shown in Fig. 13, partitioning times with KL are slightly better than those with SA for small and medium graphs. For the 400 nodes graphs SA outperforms the KL-based algorithm. TS is on average 10 times faster than KL for 40 and 100 nodes graphs, and 30 times faster for graphs with 400 nodes. 4.5.
Examples
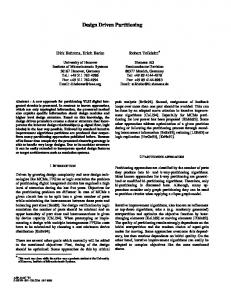
The conclusions presented above are based on experiments with random and geometric graphs, as discussed in section 4.1. In order to validate our system level partitioning approach we performed two further experiments on real-life models: the Ethernet network coprocessor and the OAM block of an ATM switch. Both models were specified at system level in VHDL. After simulation, basic regions were extracted and the annotated process graph has been generated. Partitioning was performed using both the SA based and the TS algorithm, with the cost function presented in section 3.3 and a constraint on the hardware cost representing 30% of the cost of a pure hardware implementation. The Ethernet network coprocessor is given in [32] as an example for system specification in SpecCharts and has been used, in a HardwareC version, in [22] and [24]. We have rewritten it in VHDL, as a model consisting of 10 cooperating processes (730 lines of code). These processes are depicted as rectangles in Figure 14. The coprocessor transmits and receives data frames over a network under CSMA/CD (Carrier Sense Multiple Access with Collision Detection) protocol. Its purpose is to off-load the host CPU from managing communication activities. The host CPU programs the coprocessor for specific operations by means of eight instructions. Processes rcv-comm, buffer-comm, and exec-unit are dealing with enqueuing and decoding/executing these instructions. Transmission to the network is performed in cooperation by three processes. Process DMA-xmit gets a memory address from the host CPU and accesses directly the memory in order to read the data. This data is forwarded successively to a second process (xmitframe) which packages it in frames according to a prescribed standard. Frames are then sent as a series of bytes to process xmit-bit which outputs them on the serial network line. If a collision is detected normal transmission is suspended, a number of jam bytes are generated and after waiting a certain time the frame will be retransmitted. After a successful transmission, the unit waits for a period of time required between frames before attempting another transmission. In parallel to the above processes, other four processes deal with reception from the network. Process rcvd-bit continuously reads bits from the serial line of the network and sends a succession of bytes to the buffering process rcvd-buffer. Process rcvd-frame receives the data from rcvd-buffer and filters out those frames which have as destination the host system. It first waits to recognize a start-of-frame pattern and then compares the following two bytes with the address of the host. If the addresses are equal the rest of the bytes
SYSTEM LEVEL HARDWARE/SOFTWARE PARTITIONING
27
Figure 14. The Ethernet network coprocessor.
belonging to the frame are read and sent to process DMA-rcvd which writes them to a local memory. After the first partitioning step, extraction of performance critical blocks, loops, and subprograms, we got a VHDL specification consisting of 20 processes, represented as ovals in Figure 14. Process graph generation and graph partitioning produced a hardware partition with 14 processes and a software partition with 6 processes. Processes implemented in software are shaded in the figure. The most time critical part of those processes that are handling transmission and reception of data on the ethernet line as well as processes which are strongly connected to them have been assigned to hardware and the rest belong to the software partition. This corresponds to the results reported in [22] and [24], which have been obtained following a different approach. Our second example implements the operation and maintenance (OAM) functions corresponding to the F4 level of the ATM protocol layer [13]. This level handles OAM functionality concerning fault management, performance monitoring, fault localization, and activation/deactivation of functions. ATM (asynchronous transfer mode) is based on a fixed-size virtual circuit-oriented packet switching methodology. All ATM traffic is broken into a succession of cells. A cell consists of five bytes of header information and a 48-byte information field. The header field contains control information of the cell (identification, cell loss priority, routing and switching information). Of particular interest in the header are the virtual path identifier (VPI) and the virtual channel identifier (VCI). They are used to determine which cells belong to a given connection.
28
ELES, PENG, KUCHCINSKI, AND DOBOLI
The OAM functions in the network are performed on five hierarchical levels associated with the ATM and Physical layers (PhL) of the protocol reference model [26]. The two highest levels, F4 and F5, are part of the ATM protocol layer. The F4 level handles the OAM functionality concerning virtual paths (VP) [4]: –
Fault management: when the appearance of a fault is reported to the F4 block, special OAM cells will be generated and sent on all affected connections; if the fault persists, the management system (MS) should be notified.
–
Performance monitoring: normal operation of the network is monitored by continuous or periodic checking of cell transmission.
–
Fault localization: when a fault occurs it might be necessary to localize it; for this purpose special loop back OAM cells are used.
–
Activation/Deactivation: a special protocol for activation and deactivation of OAM functions that require active participation of several F4 blocks, e.g. performance monitoring, has to be implemented.
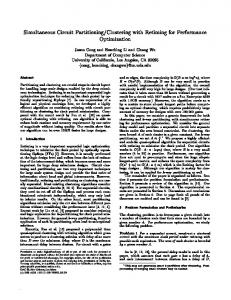
To perform these functions, in addition to normal user cells, specially marked ATM cells are used. They are the OAM cells: activation/deactivation cells, performance management cells, and fault management cells (FMC). We specified functionality of the F4 block of an ATM switch as a VHDL model consisting of 19 interacting processes (1321 lines of code). These processes are depicted as rectangles in Figure 15. The model resulted after extraction of basic regions has 27 processes, represented as ovals in Figure 15. The resulted process graph has been partitioned into 14 processes assigned to hardware and 13 to software. Processes implemented in software are shaded in the figure. Processes performing the filtering of input cells and those handling user cells (which constitute, by far, the majority of received cells) were assigned to hardware. Processes handling exclusively OAM cells (which are arriving at a very low rate), and those assigned to functions which are executed at a low rate and without a hard time constraint (like inspect-table, or clear-error-status, for example) were assigned to software. Our experiments with the ethernet coprocessor and the OAM block confirmed perfectly the conclusions drawn from experiments with geometric and random graphs. Using parameters extracted from Tables 2 and 4 both the SA based algorithm and the algorithm using TS produced, from the first attempt, an optimal1 partitioning. These initial parameters were for both examples the following: TL = 75, TI = 400, α = 0.95 for SA, and τ = 7, Nr f b = 30, Nr r = 0 for TS. Partitioning times, with these parameters, were (in seconds): 0.25 (ethernet coprocessor), 0.60 (OAM block) for SA, and 0.011 (ethernet coprocessor), 0.02 (OAM block) for TS. This result is important since it confirms that the parameters resulted from our experiments can be used successfully for partitioning different applications which eliminates or, at least,
SYSTEM LEVEL HARDWARE/SOFTWARE PARTITIONING
29
Figure 15. The OAM block of an ATM switch.
reduces drastically the laborious and time consuming task of tuning the heuristics. Because the structure of the process graphs generated from the two VHDL models is simpler than that of the artificial graphs, the parameters and corresponding partitioning time could be subsequently reduced to the values given in Table 6. Partitioning times for the two examples confirmed the clear superiority of the TS algorithm over that based on SA, with more than an order of magnitude. Considering the whole partitioning process with its four steps, as depicted in Figure 2, graph partitioning is the most time consuming task. This is not surprising given the polynomial complexity of the algorithms corresponding to the other three steps. The most complex part of the extraction algorithm for basic regions is to perform the analysis needed for generation of the interfaces to the new processes [16]. This is why finding fast heuristics for graph partitioning was our main concern. For the ethernet coprocessor and the OAM block the time needed for the other three steps together, is of the same magnitude as the time for graph partitioning. As the number of processes to be partitioned becomes larger, the dominance of graph partitioning time becomes more and more evident.
30
ELES, PENG, KUCHCINSKI, AND DOBOLI
Table 6. Partitioning of the VHDL models. number of processes
partitioning with SA
partitioning with TS tTS /tSA
model initial model Ethernet cop. OAM block
5.
10 19
after extr. of basic regions 20 27
TI
TL
α
tSA (s)
τ
Nr f b
Nr r
tTS (s)
400 400
40 50
0.90 0.90
0.08 0.10
7 7
5 5
0 0
0.006 0.007
0.075 0.07
Conclusion
We have presented an approach to automatic hardware/software partitioning of system level, implementation independent specifications. Partitioning is performed at the granularity level of blocks, loops, subprograms, and processes and produces an implementation with maximal performance using a limited amount of hardware and software resources. We considered that minimization of communication cost between the hardware and software partition and improvement of the overall parallelism are of crucial importance for the resulted performance. Partitioning is based on metric values derived from simulation, static analysis of the specification, and cost estimations. All these information are captured as weights on nodes and edges of the process graph. A cost function that combines these weights and guides partitioning towards the desired objective has been developed. We formulated hardware/software partitioning as a graph partitioning problem and solved it by implementing two iterative improvement heuristics based on simulated annealing and tabu search respectively. The algorithms have been evaluated based on extensive experiments using both random and geometric graphs as well as real-life examples. We have demonstrated that both algorithms can produce high quality solutions. We have also shown that performances obtained with TS, which until now has been ignored in the context of system level partitioning, are definitely superior in comparison to those given by even improved implementations of SA, or by classical algorithms like KL. This is important as, for a high number of nodes, partitioning times with SA or KL can be prohibitively long, which hinders an efficient exploration of different design alternatives. The algorithms we presented can be used also for partitioning purposes other than system level hardware/software partitioning. They can be, for instance, equally useful, and can be easily extended, for partitioning at finer levels of granularity.
Notes 1. We use “optimal” in the sense introduced in section 4.1. For the ethernet coprocessor we verified optimality of the solution by running exhaustive search.
SYSTEM LEVEL HARDWARE/SOFTWARE PARTITIONING
31
References 1. J. K. Adams and D. E. Thomas. Multiple-process behavioral synthesis for mixed hardware-software systems. In Proc. International Symposium on System Synthesis, pp. 10–15. 1995. 2. P. M. Athanas and H. F. Silverman. Processor reconfiguration through instruction-set metamorphosis. Computer, 11–18, March 1993. 3. E. Barros, W. Rosenstiel and X. Xiong. A method for partitioning UNITY language in hardware and software. In Proc. European Design Automation Conference EURO-DAC/VHDL, pp. 220–225. 1994. 4. Generic requirements for operations of broadband switching systems. Bellcore TANWT-001248 issue 2, October 1993. 5. A. Bender. Design of an optimal loosely coupled heterogeneous multiprocessor system. In Proc. European Design & Test Conference, pp. 275–281. 1996. 6. G. Boriello, P. Chou and R. Ortega. Embedded system co-design towards portability and rapid integration. In Hardware/Software Co-Design, NATO ASI 1995, G. De Micheli and M. G. Sami (eds.), Kluwer Academic Publishers, Boston, 1996. 7. K. Buchenrieder and J. W. Rozenblit. Codesign: An overview. In Codesign—Computer-Aided Software/Hardware Engineering, J. Rozenblit and K. Buchenrieder (eds.), IEEE Press, 1995. 8. K. Buchenrieder, A. Sedlemeier and C. Veith. Industrial hardware/software co-design. In Hardware/Software Co-Design, NATO ASI 1995, G. De Micheli and M. G. Sami eds., Kluwer Academic Publishers, Boston, 1996. 9. R. Camposano and J. Wilberg. Embedded system design. Design Automation for Embedded Systems 1: 5–50, 1996. 10. P. H. Chou, R. B. Ortega and G. Boriello. The Chinook hardware/software co-synthesis system. In Proc. International Symposium on System Synthesis, pp. 22–27. 1995. 11. G. De Micheli. Computer-aided hardware-software codesign. IEEE Micro, 10–16, August 1994. 12. G. De Micheli. Hardware/software codesign: Application domains and design technologies. In Hardware/Software Co-Design, NATO ASI 1995, G. De Micheli and M. G. Sami (eds.), Kluwer Academic Publishers, Boston, 1996. 13. M. De Prycker. Asynchronous Transfer Mode: Solution for Broadband ISDN. Ellis Horwood, New York, 1993. 14. M. Edwards and J. Forrest. A development environment for the cosynthesis of embedded software/hardware systems. In Proc. European Design Automation Conference EDAC, pp. 469–473. 1994. 15. P. Eles, K. Kuchcinski, Z. Peng and M. Minea. Synthesis of VHDL concurrent processes. In Proc. European Design Automation Conference EURO-DAC/VHDL, pp. 540–545. 1994. 16. P. Eles, Z. Peng and A. Doboli. VHDL system-level specification and partitioning in a hardware/software co-synthesis environment. In Proc. Third International Workshop on Hardware/Software Codesign, IEEE, pp. 49–55. 1994. 17. R. Ernst, J. Henkel and T. Benner. Hardware-software co-synthesis for microcontrollers. IEEE Design & Test of Computers, 64–75, September 1993. 18. D. D. Gajski and F. Vahid. Specification and design of embedded hardware-software systems. IEEE Design & Test of Computers, 53–67, Spring 1995. 19. F. Glover, E. Taillard and D. de Werra. A user’s guide to tabu search. Annals of Operations Research 41: 3–28, 1993. 20. G. Goosens, J. van Praet, D. Lanneer, W. Geurts and F. Thoen. Programmable chips in consumer electronics and telecommunications. In Hardware/Software Co-Design, NATO ASI 1995, G. De Micheli and M. G. Sami (eds.), Kluwer Academic Publishers, Boston, 1996. 21. P. Gr¨un. VHDL to C Compilation in a Hardware/Software Co-Synthesis Environment, Master Thesis, Technical University of Timisoara, 1995. 22. R. K. Gupta and G. De Micheli. System synthesis via hardware-software co-design. Technical Report No. CSL-TR-92-548, Comp. Syst. Lab., Stanford Univ., 1992. 23. R. K. Gupta and G. De Micheli. Hardware-software cosynthesis for digital systems. IEEE Design & Test of Computers, 29–41, September 1993. 24. R. K. Gupta. Co-synthesis of hardware and software for digital embedded systems. Kluwer Academic Publishers, Boston, 1995. 25. IEEE standard VHDL language reference manual. IEEE Std 1076–1993, IEEE Press, 1994.
32
ELES, PENG, KUCHCINSKI, AND DOBOLI
26. B-ISDN operation and maintanace principles and functions. ITU-T Recommendation I.610, 1993. 27. T. Ben Ismail and A. A. Jerraya. Synthesis steps and design models for codesign. Computer, 44–52, February 1995. 28. A. Kalavade and E. A. Lee. A global criticality/local phase driven algorithm for the constrained hardware/software partitioning problem. In Proc. Third International Workshop on Hardware/Software Codesign, pp. 42–48. 1994. 29. B. W. Kernighan and S. Lin. An efficient heuristic procedure for partitioning Graphs. Bell Systems Tech. J. 49(2): 291–307, 1970. 30. S. Kirkpatrick, C. D. Gelatt and M. P. Vecchi. Optimization by simulated annealing. Science 220(4598): 671–680, 1983. 31. L. Lavagno, A. Sangiovanni-Vincentelli and H. Hsieh. Embedded system codesign. In Hardware/software co-design, NATO ASI 1995, G. De Micheli and M. G. Sami (eds.), Kluwer Academic Publishers, Boston, 1996. 32. S. Narayan, F. Vahid and D. D. Gajski. Modeling with SpecCharts, Technical Report #90-20, Dept. of Inf. and Comp. Science, Univ. of California, Irvine, 1990/1992. 33. R. Niemann and P. Marwedel. Harware/software partitioning using integer programming. In Proc. European Design & Test Conference, pp. 473–479. 1996. 34. K. A. Olukotun, R. Helaihel, J. Levitt and R. Ramirez. A software-hardware co-synthesis approach to digital system simulation. IEEE Micro, 48–58, August 1994. 35. Z. Peng and K. Kuchcinski. An algorithm for partitioning of application specific systems. In Proc. European Design Automation Conference EDAC, pp. 316–321. 1993. 36. Z. Peng and K. Kuchcinski. Automated transformation of algorithms into register-transfer level implementation. IEEE Transactions on Computer-Aided Design of Integrated Circuits and Systems 13(2): 150–166, February 1994. 37. E. Stoy and Z. Peng. A design representation for hardware/software co-synthesis. In Proc. Euromicro Conference, pp. 192–199. 1994. 38. F. Vahid, J. Gong and D. Gajski. A binary-constraint search algorithm for minimizing hardware during hardware/software partitioning. In Proc. European Design Automation Conference EURO-DAC/VHDL, pp. 214–219. 1994. 39. W. H. Wolf. Hardware-software co-design of embedded systems. Proceedings of the IEEE 82(7): 967–989, July 1994. 40. C. W. Yeh, C. K. Cheng and T. T. Y. Lin. Optimization by iterative improvement: An experimental evaluation on two-way partitioning. IEEE Transactions on Computer-Aided Design of Integrated Circuits and Systems 14(2): 145–153, February 1995. 41. T. Y. Yen and W. Wolf. Sensitivity-driven co-synthesis of distributed embedded systems. In Proc. International Symposium on System Synthesis, pp. 4–9. 1995.