Prior to that she obtained her B.Tech (Bachelor of. Technology) degree in Electronics and Electrical. Communications Engineering from the Indian Institute of.
Distributed Prognostic Health Managemen t with Gaussian Process Regression Sankalita Saha MCT/NASA ARC Moffett Field, CA 94035 Sankalita. Saha&nasa. gov
Bhaskar Saha MCT/NASA ARC Moffett Field, CA 94035 bhaskar.saha&nasa.gov
Abstract—Distributed prognostics architecture design is an enabling step for efficient implementation of health management systems. A major challenge encountered in such design is formulation of optimal distributed prognostics algorithms. In this paper. we present a distributed GPR based prognostics algorithun whose target platform is a wireless sensor network. In addition to challenges encountered in a distributed implementation, a wireless network poses constraints on connnunication patterns, thereby making the problem more challenging. The prognostics application that was used to demonstrate our new algorithms is battery prognostics. In order to present trade-offs within different prognostic approaches, we present comparison with the distributed implementation of a particle filter based prognostics for the same battery data. TABLE OF CONTENTS 1. INTRODUCTION ................................................................. 1 2. RELATED WORK ..............................................................1 3. DISTRIBUTED PROGNOSTICS ARCHITECTURE ................ 2 4. GPR BASED PROGNOSTICS .............................................. 2 5. DISTRIBUTED GPR ...........................................................4 6. EXPERIMENTS AND RESULTS .......................................... 4 7. CONCLUSIONS .................................................................. 6 REFERENCES ........................................................................7 BIOGRAPHY
..........................................................................7 1. INTRODUCTION
Computational complexity has always been one of the stumbling blocks for sophisticated prognostic algorithms that have the ability to manage the uncertainties in system health management. Distributed prognostics running on a network of inexpensive embedded devices can serve as an enabling technology for implementing efficient and viable health management systems that involve complex interaction of hybrid elements and subsystems. In such a scenario, multiple sensors monitor various components, subsystems and hierarchically the entire system. The measurements taken from these sensors are then processed by suitable diagnostic algorithms to determine the current health of the system, while the prognostic algorithms determine the future health conditions. A centralized architecture for such a health management system has several disadvantages such as: (a) increased amounts of sensor data collected for more refined analysis (e.g., high frequency vibration data from rotating machinery) that overwhelms the computing power of a single processing unit (b) increasingly more complex
Abhinav Saxena SGT/NASA ARC Moffett Field, CA 94035 abhinay.saxenaL&nasa.gov
Kai Goebel NASA ARC Moffett Field, CA 94035 kai. RoebelCt^nasa. gov
algorithms – intensive in terms of memory as well as computation speed – which hamper performance and (c) vulnerability to loss of complete functionality in case of a crash of the central processor, ,'monitor. Clearly, for such increasingly multi-tasking and complex health management systems, efficient distributed architectures need to be designed where multiple smart sensor devices monitor different parts of a system and collaborate when computation intensive algorithms or large amounts of data are involved that cannot be handled efficiently by a single processor/node. The advances in smart sensor technology that combine the power of embedded computing devices with sensors and wireless transmission technology have made the design and implementation of such systems feasible and cost-efficientAn important design problem of such systems is formmulation of efficient and robust distributed health management algoritlnns that can take advantage of the distributed architecture. Gaussian process regression (GPR) based prognostics algorithms form an important class of health management solutions, since it is possible to model any kind of system behavior using a suitable mixture of Gaussian processes in a Bayesian inference framework. They offer the flexibility to incorporate prior knowledge about the underlying processes in a convenient and intuitive manner. However, they are computation and memory intensive algorithms and hence may benefit by distributed implementations in order to meet resource constraints for onboard deployment on aerospace systems with large amounts of sensor data. In this paper, we present a distributed prognostics algorithm based on GPR. The target platform in our design is a wireless smart sensor network that has, of late, gained immense importance for deployment in various fields. The results are evaluated on a battery prognostics application. Besides presenting details of the distributed GPR based prognostics system; we present a comparison of the computation performance and robustness results with a particle filter based implementation of the prognostics system and analyze the trade-offs involved in their distributed implementations. 2. RELATED WORK A significant body of work dealing with distributed implementation of prognostic algorithms does not exist. This is because the field of prognostics is still maturing.
However ; a few efforts have been made recently. For example, in [1] the authors briefly outline a distributed pro gnostics system architecture where tasks are distributed at a very high level, such as identifying the different system modules and where they fit into a given system using prognostics. In [2] a distributed network of smart sensor elements integrated using a knowledge-driven environment is presented which will perform health management at various levels of hierarchy including sensor, process, and system levels. This network will be used as an element of the prototype intelligent rocket test facility being implemented at NASA Stennis Space Center. In [3] a hardware multi-cellular sensing and conununication network (a smart "skin") is presented where the external structure with embedded sensors would detect and react to impacts caused by projectiles. Distributed prognostics architecture have been explored earlier as shown in ([5], [6]), where the prognostics algorithms were based on particle filters. GPR based pro gnostics al gorithms form an important class of regression techniques that are used in many applications and has been applied to the prognostics problem as well [4]. Efficient implementations of GPR have been explored for other applications but have not been investigated in the context of prognostics and health management ([7], [8]). Most of these methods suggest clustering ofdatasets into independent groups and applying GPR on them individually while averaging the results from the separate clusters to obtain the final result. However, these methods are not very suitable for applications where the datasets involve time series connmonly encountered in prognostics applications. In this paper, we propose a new efficient distributed GPR algorithm without compromising on performance. 3. DISTRIBUTED PROGNOSTICS ARCHITECTURE In this section we provide a brief overview of our distributed health management architecture. Further description of this architecture can be obtained in ([5], [9]). The architecture is comprised of a network of smart sensor devices that monitor the health of various subsystems or modules. The health management system includes various tasks of which the most important are sensing, diagnostics and prognostics operations. The sensors collect component signals and monitor them using low-weight dia gnostics algorithms and collaborate when heavy weight computations — such as complex prognostics — are required. Prognostics operations are triggered based on user defined thresholds. An example of such a distributed pro gnostics system is shown in Figure
1 ^ Central Server C
CE
1 CE /
/
Base
station / CE
CE \
CE CE
CE
Figure 1. Overview of distributed prognostics system architecture. (_adapted from figure 1 in [51). The sensor devices consist of a sensor or a set of sensors and a communication device, i.e., a wireless transreceiver or wired communication capabilities besides an embedded processing element. We call these multifunctional devices Computing Elements (CEs). Though in many instances wired sensor network may be preferable, in this paper we focus on wirelessly connected devices which provide
enhanced flexibility. There are two main operating modes for the CE: diagnostics and prognostics ([5]). The CEs are arranged in clusters and monitor and hierarchically manage the health of the whole system. The main mode of operation for a CE is sensing and diagnostics where it monitors a given sub-system or component through a low weight diagnostics algorithn. During this monitoring, if a CE detects a critical condition, it raises a flag to start the prognostics mode. In this mode the CEs form a cluster that collaboratively performs the prognostics task. The prognostics task is expected to be computationally expensive involving complex algorithms as well as increased data. The increase in data is due to increase in the frequency of component signal sampling for more accurate prognostic estimates. In many cases, if the CE does not have enough computational resource to perforni the overheads of the distributed system management, the base station performs these tasks which include as scheduling, synchronization, load distribution and so on. In the prognostics mode it is not necessary that all CEs within a cluster participate in the prognostics task. This is because the diagnostics operations continue uninterrupted in the prognostics mode and some of the CEs may lack the necessary computing power to support the additional new task. To ensure that a participating CE can support such multi-tasking efficiently the prognostics algorithms need to be distributed efficiently. In many cases the sensor capabilities of the CEs may not be utilized at all, i.e., they could act as monitors for the rest of
the system - schedule tasks, detect failures and initiate recovery, provide access to resources such as an external database and so on. These CEs are specially designated as base stations. The base station is also, typically, connected to a more power computing resource (to aid in collection and storage of system data) which in our case was a PC.
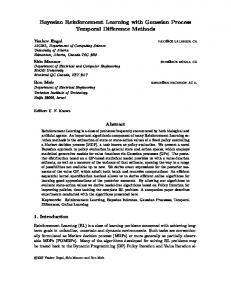
RCT, the Warburg impedance R,,w and the electrolyte resistance RE, whose values change with various aging and fault processes. It was observed that a high degree of linear correlation existed between the C/1 capacity (capacity at nominal rated current of IA) and the internal impedance parameter RE +RCT . For further details, the reader is referred to [11].
Figure 2 shoves, in detail, the typical execution flow in our health management architecture. As mentioned earlier, each CE monitors different components or subsystems such as battery health, actuator faults, health of electronic components and so on. It can also be responsible for diagnostic monitoring of a sub-system comprising multiple components. For further details on the architecture, the reader is referred to [9]. 0 • All CEs running 0 Diagnostic routines
w^ -
Figure 3. Lumped Parameter Model of a Battery.
./ f l
a
y7
Overview of GPR
1 C=reporr0size lithium-ion cells (i.e., Gen 2 cells) that were cycle-life tested at the Idaho National Laboratory under the Advanced Technology Development (ATD) Program. The battery model used in the particle filter based prognostic algoritmz is shown in figure 3. The parameters of interest are the double layer capacitance C DL, the charge transfer resistance
GPR is a probabilistic technique for nonlinear regression that computes posterior degradation estimates by constraining the prior distribution to fit the available training data [10]. It provides variance around its mean predictions to describe associated uncertainty in the predictions. A Gaussian Process (GP) is defined as a collection of random variables any finite number of which has a joint Gaussian distribution. A GP f(x) is completely specified by its mean filnction m(x) and co-variance function k(x, x') defined as:
m(x) = E [f (x)], k (x , x' ) = E[(.f (x) — m (x))(f (xr) — m(x•' ))], and f (x) - GP(m (x), k(x, x')).
(1)
The index set X E T is the set of possible inputs, which need not necessarily be a time vector. However, in the case of prognostics application, this set of points is a time vector. Given prior information about the GP and a set of training points 4X,, f ) I i = 1,... n} , the posterior distribution over functions is derived by imposing a restriction on prior joint distribution. This condition specifies that only those functions that agree with the observed data points be considered while the rest are eliminated. These functions can be assumed to be noisy, as in real world situations we have access to only noisy observations rather than exact function values i.e. y7 = f (x) + 6 , where 6 is additive IID
N(0, 671 ). Once a posterior distribution is obtained it can be used to assess predictive values for the test data points. The following equations describe the predictive distribution for GPR Error! Reference source not found..
Prior
important to have optimized communication load.
y C fr. ~
o K(x, x) + 6n K(X, X,,,,)
(2)
K(X,,,,,X) K(X,,,X,,,)
Posterior fes, I X, y, X., —N(.f. ,cov(f,,t)),where Jfast = E[.f,, I X,y,X,.,,]=K(X,X,,,,)[K(X,X)+6n
I]-'y,
(3)
cov(f.sr) =K(X,esr>X.s,)— K(X,,s, >X) +o-nl]-'K(X,Xres )
A crucial ingredient in a Gaussian process predictor is the covariance function that encodes the assumptions about the functions to be learnt by defining the relationship between data points. The covariance stricture also incorporates prior beliefs of the underlying system noise. GPR requires a prior knowledge about the form of covariance function, which must be derived from the context if possible. Furthermore, covariance functions consist of various hyper-parameters that define their properties. Setting right values of such hyper-parameters is yet another challenge in learning the desired functions. Although the choice of covariance function must be specified by the user, corresponding hyperparameters can be learned from the training data using a gradient based optimizer such as maximizing the marginal likelihood of the observed data with respect to hyperparameters [10]. GPR was used to regress the evolution of internal parameters of the battery with time. The relationship between these parameters and the battery capacity was again learned from experimental data. As stated earlier, battery capacity was linearly related to the internal parameter values, and when regressed through GPR, almost constant confidence bounds were obtained for this relationship. We regressed the internal parameters with time and transferred the predicted values to the capacity domain to express capacity decay with time. 5. DISTRIBUTED GPR One of the most computationally expensive steps in a GPR algorithm is the Cholesky decomposition. Since Cholesky decomposition is a very popular matrix factorization method, various efficient distributed methods have been developed. However, a major drawback of most of these distributed methods is the use of extensive inter-processor communication. As shown in details in [12], cormrnrnication overhead can increase very quickly for most distributed Cholesky decomposition schemes. Though a few new schemes for more efficient communication patterns have been explored, they are not suitable for wireless sensor network. In our case, since the target platform is a wireless network, use of such distributed schemes is not possible and hence other forms of distributed GPR have to be investigated. Note that, in a wireless sensor network communication overhead contributes to overall increase in power consumption as well and hence it is even more
An interesting approach to distributed GPR implementation is the clustering of the dataset into multiple group and application of GPR to each of them individually [7]. Thus, once this clustering is performed, the data is sent to the different CEs which then apply GPR locally. The most common approach of clustering in such cases is spatial clustering [8]. However, such an approach would not work for prognostics application. In prognostics, prediction of remaining useful life will have to be made from regression of training data, and hence spatial clustering would not be able to encompass the temporal behavior of the data and crucial information may be lost. Such loss of information would lead to increase in uncertainty bounds of the prediction and in general degradation in performance. Thus, in our new proposed method; we present a different clustering method. Instead of clustering the data using spatial proxinuty, we sample the dataset uniformly to generate multiple clusters containing equal data points. GPR would then be applied to these clusters individually. At the end of the individual GPR routines, instead of weighted averaging as proposed in [7], we perforni a simple averaging. Since the different clusters were generated using uniform sampling, all of the clusters would statistically have equal weights and hence all the prediction results have equal importance. However, an important consideration in such a clustering scheme to work is assuring that no information is lost while splitting up the dataset. This can be achieved by ensuring the Nyquist sampling rate is applied. Thus, if the highest frequency of the target application is fH and the dataset is clustered into in groups, the dataset on which GPR is being applied should have been sampled at a rate of fs, where fs is as follows fs>2 *m*fH (2) Once, the clustering is complete, the relevant sensor data is transmitted to the CEs. Each CE then applies GPR to the data individually. Thus each CE may have its own covariance matrix and set of hyper-parameters distinct from the rest. 6. EXPERIMENTS AND RESULTS The distributed GPR based algorithm was evaluated using MATLAB based simulation. In addition, distributed implementation of particle filter based battery prognostics is also presented in order to compare the two approaches. An overview of the particle filter based implementation is given below. Overview of Distributed Particle Filter based Prognostics
Particle filters (PFs) are based on Bayesian learning networks and essentially implement a recursive Bayesian filter using Monte Carlo (MC) simulations. The system is
represented as a state which at any given instant is estimated in terms of a finite number of particles (points) representing sampled values from the unknown state space, and a set of associated weights denoting discrete probability masses. The evolution of the state over time is expressed by generation and recursive update of the particles from a nonlinear process model that describes the progression in time of the system under analysis, a measurement model, a set of available measurements and an a priori estimate of the state probability distributed function (pdf). Figure 4 shows the algoritlmuc flow of a PF system.
generality for all CEs Nn = N/M, where M is the number of CEs. (2) Any given CE„ has a particle population representing the full state pdf To ensure this, we perform a parametric approximation of the state pdf at the global resampling step. A mixture of Gaussians is fitted to the particle population of each CE using a least squares method. For further details please refer to [6].
Results
No yes
Figure 4. The flow of a particle filter system. As shown in figure 4 ; an important step in a particle filter step is resampling. Without it the variance of the particle weights quickly increases, thereby causing degradation in inference because the effective number of particles used for the state representation decreases. Unfortunately, all the steps in a PF except resampling can be easily distributed over independently executing CEs. The resampling step essentially consists of combining all the particles after a state update and redrawing particles from the same probability density based on some function of the particle weights such that the weights of the new particles are approximately equal. This could lead to overheads in communication when implemented serially, since all the particle values — which are typically large (minimum of 100 for most applications) — from different CEs performing the other steps concurrently have to be collected y and redistributed again. In [6], a distributed implementation of the resampling scheme — called parameterized resampling — was proposed Which lead to an efficient distributed PF based prognostics algoritlmi. In this approach, the cominunication load was reduced by performing resampling locally at each CE for most iterations and resampling globally (across all CEs) after every few iterations. In order to ensure the statistical invariance of the particle population after resampling, the following conditions were imposed: (1) Each CE operates on a statistically significant number of particles, i.e. No >> 1, where N„ denotes the number of particles for CE,,, (EN„ = N). Without loss of
As mentioned in section 4, the application data was a battery aging data collected from INL. The INL battery data contained aging information — battery capacity values — from week 0 till week 68. The initial few points of the dataset were used for learning purposes after which battery capacity prediction was performed. Figure 5, shows the prediction for RE+R CT with time at three different prediction points (32, 48 and 52 weeks) using the distributed implementation of GPR based prognostics on 2 CEs. The plot also includes a 9.5% confidence bound. The mean values from this RE+RcT evolution curve was used to predict the battery capacity. From figure 5 it may be observed that the predictions at week 32 failed to follow the actual trend. Thus, when this trend was used for the capacity prediction, it led to incorrect EOL predictions i.e.. the EOL was predicted to be far later than the actual value. As more data was used for learning, the predictions became better as can be seen with the predictions at weeks 48 and 52. The corresponding EOL pdf is shown in figure 6. The actual failure as shown by the data was at week 64.4563 while the mean value of the predicted EOL using GPR was at week 66.5. PE + RCT trending 0.045 ............. ............ .............. . ........................... . ............................ .......... . Prediction @ 32 Weeks Prediction @ 48 Weeks .......... ...... ............. ... .......... '...... ...
0.04
^—,
Prediction @ 52 Weeks ............................. ;l
0.035 RE + RCT Groundtruth
C^u
oos
............._................._............................
/....._.... _ _..
0 .025
........................ ..^ .......
.....
4..............
.........
0015 , ' 0
10
20
30
40
50
60
70
weeks
Figure 5. Distributed GPR based RE+ RCT prediction with 95% confidence bounds at weeks 32, 48 and 52.
80
7. CONCLUSIONS In this paper, a new distributed GPR based prognostics algorithm targeted towards wireless sensor networks has been presented. A proof-of-concept demonstration of this new algorithm has also been sho-wri in details. The results, as demonstrated in figures 5 and 6, show that although the PF results are marginally better in terms of narrower uncertainty bounds and predicting the EOL earlier than the actual failure; the GPR performance is satisfactory. Future work involves implementation of the proposed new algorithm on sensors in order to evaluate the algorithms more thoroughly as well as explore other challenges posed by such detailed implementations. Exploring other methods of distributing the tasks as well different network architectures for more optimized performance is an important direction of future research as well. Particle Filter Prediction ti 0 0 9E a
n 0.^
m
i3 0 BE CL
J
ry O.f ...........
X
0.7E
X^ L5
0.i
RUL pdfs X
n m
U
!............
0.6E
U
I 0 0
10
20
30
40
50
60
70
Time (weeks)
Figure 7. Distributed particle filter based EOL predictions for battery capacity at week 52.
The tracking and prediction performance for the distributed particle filter based battery pro gnostics is shown in figure 7. The squares represent the real data, while the solid line represents the mean tracking performance of the distributed PF until week 52. After week 52 the solid line represents the mean PF prediction (62 week) with the cyan patch showing the uncertainty bounds. The execution time measurements were performed on the distributed GPR implementations using MATLAB simulations as well. The distributed implementation execution time usin g 2PEs was observed to be 1.313 secs while for the execution time using a single PE was observed to be 1.780.5 secs-
6
REFERENCES [ 1 ] M. Roemer, C. Byington, G. Kacprzynski and G. Vachtsevanos, "An Overview of Selected Prognostic Technologies with Reference to an Integrated PHM Architecture", In Proc. of the First Intl. Forum on Integrated System Health Engineering and Management in Aerospace, 2005. [2] J. Sclunalzel, F. Figueroa, J. Morris, S. Mandayam and R. Polikar, "An Architecture for Intelligent Systems Based on Smart Sensors", IEEE Transactions on Instrumentation and Measurement, Vol. 54, No. 4, Aug. 2005, pp. 1612-1616. [3] M. Prokopenko, P. Wang, D. C. Price, P. Valencia, M. Foreman, A. J. Fanner, "Self-organizing Hierarchies in Sensor and Conununication Networks". Artificial Life, Special Issue on Dynamic Hierarchies, Vol. 11(4), 407- 426, 2005[4] K. Goebel, B. Saha, A. Saxena, J. Celaya, J. Christophersen, "Prognostics in Battery Health Management", In IEEE Instrumentation and Measurement Magazine, 2008, Vol. 1(4). pp. 33-40. [5] S. Saha, B. Saha and K. Goebel. "Distributed Prognostics Usin g Wireless Embedded Devices". In IEEE International Conference on Pro gnostics and Health Management, Denver, CO, USA, October 2008[6] S. Saha, B. Saha and K. Goebel. "Communication Optimizations for a Wireless Distributed Prognostic Framework". Proceedings of IEEE Aerospace Conference, 2009, Big Sky, MT. [7] V. Tresp, "A Bayesian Conunittee Machine", Neural Computation archive, Vol. 12 , Issue 11, Nov. 2000, pp.: 2719 — 2741. [8] A. Choudhury, P. B. Nair, and A. J. Keane, "A data parallel approach for large-scale Gaussian process modelnig," Proceedings of the Second SIAM International Conference on Data Mining, Arlington, VA, USA, April 11-13, 2002. [9] B. Saha, S. Saha, K. Goebel, "A Distributed Prognostic Health Management Architecture", In Proceedings of MFPT, 2009. [10] C. E. Rasmussen, and C. K. I. Williams, "Gaussian Processes for Machine Learning," The MIT Press Cambridge MA, 2006.
[8] B. Saha and K. Goebel, "Uncertainty Management for Diagnostics and Prognostics of Batteries using Bayesian Techniques", in Proc. 2008 IEEE Aerospace Conference, March 2008. [9] K. Eswar. C.-H. Huang and P. Sadayappan, "On Mapping Data and Computation for Parallel Sparse Cholesky Factorization," In Proceedings of Fifth Symposium on the Frontiers of Massively Parallel Computation,
BIOGRAPHY Sankalita Saha is a research scientist with Mission Critical Technologies at the Prognostics Center- of Excellence, NASA Ames Research Center. She received the M.S. and PhD. degrees in Electrical Engineering fi-om University of Maryland, College Park in 2007. Prior to that she obtained her B.Tech (Bachelor of Technology) degree in Electronics and Electrical Communications Engineering from the Indian Institute of Technology, Kharagpur in 2002. Bhaskar Saha received a Ph.D. degree from the School of Electrical and Computer Engineering at Georgia Institute of Technology, Atlanta, GA, USA in 2008. He received the M.S. degree also from the same school and his B. Tech. (Bachelor of Technology) degree from the Department of Electrical Engineering, Indian Institute of Technology, Kharagprrr, India. He is currently a Research Scientist with Mission Critical Technologies at the Prognostics Center of Excellence, NASA Ames Research Center. His research is focused on applying various classification, regression and state estimation techniques for predicting remaining useful life of systems and their components, as well as developing hardware-in-the-loop testbeds and prognostic metrics to evahrate their performance. He has been an IEEE member since 2008 and has published more than 10 papers on these topics.
'AN
Abhinav Saxena is a Research Scientist with SGT Inc. at the Prognostics Center of Excellence NASA Ames Research Center, Moffet Field CA. His research focus lies in developing and evaluating prognostic algorithms for engineering systems rising soft computing techniques. He has a PhD
in Electrical and Computer Engineering from Georgia Institute of Technology, Atlanta. He earned his B.Tech in 2001 from Indian Institute of Technology (IIT) Delhi, and Masters Degree in 2003 from Georgia Tech. Abhinav has been a GM manufacturing scholar and is also a member of IEEE, AAAI and ASME. Kai Goebel Goebel is a senior scientist at NASA Ames Research Center where he leads the Prognostics Center of Excellence (prognostics. are. nasa.gov). Prior to that, he worked at General Electric's Global Research Center in Niskayuna, NY from 1997 to 2006 as a senior research scientist. He has carried out ' applied research in the areas of artifrcral intelligence, soft computing, and information fission. His research interest lies in advancing these techniques for real time monitoring, diagnostics, and prognostics. He has fielded numerous applications for aircraft engines, transportation systems, medical systems, and manufacturing systems. He holds half a dozen patents and has published more than 75 papers. He received the degree ofDiplomIngenreur from the Technrsche Universitdt Munchen, Germany in 1990. He received the MS. and Ph.D. front the University of Calfornia atBerkeley in 1993 and 1996, respectively.


![( ) ( ) ( ) ( ) ( ) ( ) ( ) ] ( ) ( )t ( ) ( ) ( ) ( ) ( )t - CiteSeerX](https://m.moam.info/img/260x300/-t-t-citeseerx_5bbca477097c47f57b8b46c9.jpg)

