Rapid and Direct Quantification of Longitudinal Relaxation Time (T1) in Look-Locker Sequences Using an Adaptive Neural. Network. H. Bagher-Ebadian1,2, ...
Rapid and Direct Quantification of Longitudinal Relaxation Time (T1) in Look-Locker Sequences Using an Adaptive Neural Network H. Bagher-Ebadian1,2, R. Paudyal1,2, T. Mikkelsen3, Q. Jiang1, and J. R. Ewing1,2 Neurology, Henry Ford Hospital, Detroit, Michigan, United States, 2Physics, Oakland University, Rochester, Michigan, United States, 3Neurosergery, Henry Ford Hospital, Detroit, Michigan, United States
1
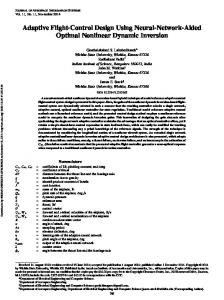
Introduction: Fast and accurate measurement of the longitudinal relaxation time T1, has become increasingly important to quantitatively estimate tissue physiological parameters such as perfusion, capillary permeability, and the volume of extravascular-extracellular space using R1 (R1=1/ T1) maps in dynamic contrast-enhanced MRI (DCE-MRI) [1-5]. In the past, we have used an imaging variant of the Look-Locker sequence, the T One by Multiple Readout Pulses (TOMROP) sequence, for estimates of the temporal variation of contrast agent concentration in tissue and blood [6]. The Look-Locker (LL) sequence provides accurate T1 estimates, with the advantages of shorter acquisition time, and a wide range of sampling times post-inversion [7]. In the Look-Locker experiment, the relationship between T1 and the acquired signal in the Bloch equation is fairly complex. Finding the T1 value for the LL is generally accomplished by some form of multi-dimensional curve fitting used to estimate a set of unknown parameters (T1, tip-angle, M0, etc) in the LL signal [7]. However, these fitting methods are sensitive to initial guesses and a biased estimation of one parameter will bias estimates of the other parameters. In this study, an Adaptive Neural Network (ANN) is trained and employed as an unbiased estimator of T1. The presented estimator was tested by simulating the LL signal at different levels of SNR and results of its application to the DCE experimental data were compared with the T1 maps estimated by conventional methods (Simplex-least square fitting) and the values of T1 reported by literature. Materials and Methods: We hypothesized that, given a signal generated by a LL model, an ANN could be trained to directly estimate T1. The analytical equation of the Look-Locker signal (Gelman et al [7] was considered as the gold standard of training and a set of LL signals for a wide range of T1’s were generated. For each T1 value LL signal inputs were generated by varying the other independent parameters in the synthetic model of signal (T2*, M0 etc). A range of Gaussian noise (SNRs of 10, 15, 20, 30, 50, and 100) was added to all simulated signals; simulated signals were input to the ANN and their T1 value was used as the ANN training output. To characterize the generalization error the ANN was trained and validated by the KFolding Cross Validation (KFCV) method [8-9]. The average error, calculated by the Area Under Receiver Operator Characteristic (AUROCC) of the ANN validated on the K omitted subsets then served as the estimate of the generalization error. In this study, to assure a very reliable estimate of the generalization error, K was set to 20 for ~900,000 samples (45000 in each fold). The ANN thus Figure 1: Left and Center: ANN estimated T1 maps before constructed had a single output, an estimate of T1 value. To illustrate (Left) and after injection of Gadomer in a U251 model of and test the ANN’s accuracy for analysis of the experimental LL cerebral tumor. Right: ΔR1. These maps were constructed data, it was also applied to the LL sequences acquired from 19 using an ANN trained by an analytical model. CrI:NIH nude rats implanted with U251n cells (2x10^5 cells/0.1 ml) intracerebrally. All rats with 2-week old tumors, were scanned using a 7T magnet, Bruker Avance console, and Bruker-supplied RF coils. A T-One by Multiple Read-Out Pulses (TOMROP) sequence acquired at baseline and every 145 s following injection of a contrast agent, Gadomer (Schering AG). Figure 1 illustrates an example of pre and post contrast T1 maps estimated by the model-trained ANN, and a map of ΔR1. To check the accuracy of the ANN in temporal estimation, the ΔR1 maps for each slice were constructed and the lesion time signature, normal area and sagittal sinus were plotted and compared. Results demonstrated that the model-trained ANN was capable of estimating a reliable map of T1. Results and discussion: This study proposes an ANN trained by an analytical input to demonstrate the flexibility of ANNs, and the multiple paths that these instruments offer in the assessment of nonlinear input-response systems. This pilot study imply possibility that generation of an ANN based on the Shutter Speed Model, with a wide range of model conditions (transfer constants, compartmental water exchange rates and sizes, etc.) as model training sets. In this study an accurate estimator for direct and rapid quantification of longitudinal T1 relaxation time is proposed. Beside simulation, to illustrate and test the method’s accuracy for analysis of the experimental LL data, it was also applied to the LL sequences acquired from 19 animals (3 slices each with U251 tumor (An example is shown in figure 2). Experimental results of the proposed method for all 19 animals were also compared to the results of the conventional method (Simplex method with least square fitting). Results imply that the proposed and conventional methods are highly correlated (r=0.83, p