1) in brackets the corresponding strain carrying the reporter plasmid. 2) the data were ... ET12567 pUZ8002 p2. topA. Îp1 (MSz-4). topA .... mapping. (A) A magnified view of the topA upstream region showing the location of transcriptional start ...
Table S1 Table S1. Oligonucleotides Oligonucleotide
Sequence
Description
H5xylE_FW
GGGGAGGCCCAGCGTCGACCGGAGAGAAG AGCGAAGTTGATGAACAAAGGTGTAATGCGA C
Construction of H1 strain
PacIxylE_RV
GGTTAATTAATCAGGTCAGCACGGTCATGA
Construction of H1 strain
PacIFRT_FW
GGTTAATTAAATTCCGGGGATCCGTCGACC
Construction of H1 strain
3543RP1
GTGGAGACGTGCGGAGGAGCGGGCGGGTC TGAGCCGGGCTGTAGGCTGGAGCTGCTTC
Construction of H1 strain
prom1_PacI_FWD CCGTTGCGGGCTTTTCCCGTTTGACACGGGG GCGGGAGGTTAATTAAATTCCGGGGATCCGT CGACC prom1_PacI_RV
topAp1 disruption
CCCGGGGTCGGGTCGTTCTGTGTTTCGATCG TGACGCTGTTAATTAATGTAGGCTGGAGCTGC TTC
topAp1 disruption
prom2_PacI_FWD CGGAGCGGGTCAGCACTCCGGGCGGCAGGA ACGGGGTTTTAATTAAATTCCGGGGATCCGTC GACC
topAp2 disruption
prom2_PacI_RV
CCCCCGTGTCAAACGGGAAAAGCCCGCAAC GGCCACTCGTTAATTAATGTAGGCTGGAGCT GCTTC
topAp2 disruption
3543_400FW
GTGGACCACGACGCGGGTGC
translation start mapping
3543_77RV
GATCGTCTTCGCCTTGGCGGG
translation start mapping
GTAAAACGACGGCCAG
translation start mapping
blap1apraFW
CCCTGATAAATGCTTCAATAATATTGAAAAAG GAAGAGTATAACTTATGAGCTCAGCCAATC
ampR gene replacement
balp2apraRV
AATCTAAAGTATATATGAGTAAACTTGGTCTGA CAGTTAAGTTCCCGCCAGCCTCGCAGA
ampR gene replacement
pForHyg6902
GTGCCGTTGATCGTGCTATG
apraR gene replacement
pRevHyg6902
CCTTGCCCCTCCAACGTCATCTCGTTCTCCGCT CATGAGCTCAGGCGCCGGGGGCGG
apraR gene replacement
M13FW
topApromBamHIFW GCGGATCCGATCTTCGCGGGAGTGGTGTTC topApromNdeIRV
CGCATATGCGCTCTTCTCTCCGGTCGACGC
pFLUXH cloning pFLUXH cloning
prom3543RTPCRFW GATCGAAACACAGAACGACC
RT-qPCR/promoter mapping
prom_p2_3543_FW CCGTTGCGGGCTTTTCCCG
RT-qPCR/promoter mapping
prom3_topA_FW
GGGTTCGTCGGGTTACCG
promoter mapping
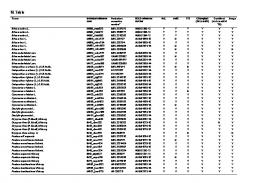
Table S2. Characterization of S. coelicolor strains under different supercoiling conditions
Strain 1)
Inducer/antibiotic
TopA level2)
topAp1 specific transcript3)
topA overall transcript
gyrB overall transcript
Reporter plasmid4)
M145 (MS10)
none
1.00
1.00± 0.15
1.002) ± 0.11
1.002) ± 0.04
-0.030 See Fig. 5 and Fig. 3
PS04 (MS11)
none
below detection
2.473) ± 0.20
0.05 ± 0.01
0.84 ± 0.11
-0.037 See Fig. 3
PS04 (MS11)
Thiostrepton 2.0 µg/ml
0.64
nd
1.31 ± 0.10
1.00 ± 0.05
nd
PS04 (MS11)
Thiostrepton 5.0 µg/ml
1.25
nd
7.44 ± 0.35
1.86 ± 0.27
-0.0335) See Fig. S4
PS07 (MS12)
none
0.86
1.14 ± 0.08
1.28 ± 0.08
nd
-0.031 See Fig. S4
PS07 (MS12)
Thiostrepton 5.0 µg/ml
3,44
0.91 ± 0.02
19.52 ± 0.21
nd
-0.0244) See Fig. S4
M145 (MS10)
Novobiocin 1.0 µg/ml
1.01
0.87 ± 0.17
0.87 ± 0.11
2.33 ± 0.27
nd
M145 (MS10)
Novobiocin 5.0 µg/ml
0.91
0.83 ± 0.10
0.80 ± 0.13
8.34 ± 1.10
-0.0186) See Fig. 5
1)
in brackets the corresponding strain carrying the reporter plasmid
2)
the data were related to the wild type strain (M145) equated to 1.00
3)
the transcript specific to topAp1 promoter was determined in the MG04 strain (PS04, with the reporter genes replacing topA in the native locus, under control of the topA promoter)
4)
the median value of superhelical density was calculated using Fiji Software
5)
the value calculated 60 minutes after exposition to thiostrepton
6)
the value calculated 10 minutes after exposition to novobiocin
Figure S1 A p2 -10
Ts2
TCGGAGCGGGTCAGCACTCCGGGCGGCAGGAACGGGGTTCGTCGGGTTACCGTTCGAGTG Ts1'
p1 -10
GCCGTTGCGGGCTTTTCCCGTTTGACACGGGGGCGGGAGGTACCGTCACACTCCGCAGCG Ts1
TCACGATCGAAACACAGAACGACCCGACCCCGGGACCACGGCCTGGGGAGGCCCAGCGTC GACCGGAGAGAAGAGCGAAGTTGTCCCCGACCAGCGAGACCGCGAAGGGCGGCCGACGAC translation start codon
Double Promoter Deletion
B
conjugation scheme
Double Promoter Deletion
C
exconjugants screening RV1
FW1
Δp1 (MSz-4)
p2
p2
topA
topA Ts2 Ts2
Ts1'/Ts1
Ts1'/Ts1
+
FW1
RV2 FW2
ET12567 pUZ8002 topA
apra
topA
apra Ts2
Ts1'/Ts1
H5 cosmid exconjugants
+
FW2/RV2
FW1/RV2
Figure S1. Construction of p1 and/or p2 mutants of the S. coelicolor topA promoter. (A) To disrupt p1 (MSz-4) or p2 (MSz-1a) promoter of the topA gene the seqenece (underlined) upstream transcription start point (red) was replaced with TTAATTAA seqence recognized by PacI restriction enzyme. For more details see Materials and Metods. (B) To disrupt the p1 and p2 promoters, we used the MSz-4 strain conjugated to the H5 cosmid carrying a double p1/p2 mutation. Screening the double exconjugants with specific oligonucleotides. (C) Double promoter deletion resulted in the introduction of an apramycin resistance cassette in place of the p2 promoter and was detected using FW2/RV2 oligonucleotides (control H5 cosmid - marked with +). The proper recombination pattern was not detected in any of the tested exconjugants. PCR analysis with FW1/RV1 oligonucleotides shows that the promoter region remained intact.
Figure S2 A
Growth analysis
Wet weight [g]
0.08
0.06
0.04
0.02
TopA--
TopA
Δp2
Δp1
B
Δp1
TopA--
Δp2
TopA
Figure S2. Analysis of the growth and differentiation of S. coelicolor topA promoter mutants. (A) The growth rate of S. coelicolor topA promoter mutants (Δp1 and Δp2), quantified by weighing the cell pellet collected after 24 hours of growth in liquid 79 medium. The wild type strain (TopA) and TopA-depletion strain (TopA-) served as control samples. (B) The sporulation of the topA promoter mutants (Δp1 and Δp2) was examined on solid MS medium. The wild type strain (TopA, sporulating) and TopAdepletion (TopA-, nonsporulating, white) strains served as controls.
Figure S3 Relative TopA level
4.0 3.5 3.0 2.5 Western Blotting
2.0
Inducer [µg/ml]
PS07 0.0
0.2
0.5
1.0
2.0
5.0
10.0
1.5 anti-TopA serum
1.0 0
2
4
6
8
10
Inducer [µg/ml]
Figure S3. Analysis of TopA level in the PS07 strain growing constantly in the presence of increasing amounts of the inducer, as assessed by western blot with anti-TopA polyclonal antibodies.
Figure S4 Plasmid Isolation MS12
WT σ relaxed/nicked
0
10
20
30
Plasmid Isolation
[minutes] 0 60
MS11
10
20
30
60
120
WT
σ relaxed/nicked -0.01
-0.01 -0.02 -0.02
-0.03 -0.04
-0.03 -0.04
Figure S4. The isolation of the reporter plasmid pWHM3Hyg (A) The plasmid isolated from MS12 (a derivative of TopA overproducing PS07 strain) cultured in the presence of the inducer (5µg/ml) in time up to 60 minutes (B) The plasmid isolated from MS11 (a derivative of TopA-depleted PS04 strain) cultured in the presence of 5 µg/ml of thiostrepton in time up to 120 minutes. Both strains were compared to the plasmid isolated from the wild type strain not exposed to thiostrepton.
Figure S5 Reporter gene activity MG03 strain 30000
20000
10000
0
1
2
5
10
Novobiocin [µg/ml]
Reporter gene activity Relative activity [%]
140
MG03
120
MG03 strain
100
topAp
topAp
80
topA
60
native topA locus
luxCDABE pFLUXH
40 20
30 42 Temp. [°C]
Figure S5. The influence of novobiocin and heat shock on the expression of the reporter gene under control of topA promoter in a wild type background. (A) The luciferase activity in the MG03 strain (see the scheme below) after treatment with increasing concentrations of novobiocin. (B) The luciferase activity in the MG03 strain after exposure to 42°C (120 minutes) normalized to standard conditions (30°C).
Figure S6
relative promoter activity [%]
p1-specific transcript 100 60 40
0
10
20
30
40
50
60
70
60
70
Time of 42°C exposition [min]
relative promoter activity [%]
p2-specific transcript 100 60 40
0
10
20
30
40
50
Time of 42°C exposition [min]
Figure S6. The specific activty of the topA p1 and p2 promoters under heat shock conditions. The level of each transcript was quantified using RT-qPCR. The transcript level isolated from cells not exposed to 42°C was estimated as 100%.
Figure S7 A
RNA-Sequencing 5'-end mapping of mRNA
sco3543
topA
3918027 Ts2
3917973 Ts1'
3917967 Ts1
B Site Ts1 Ts1' Ts2
Chromosome position S1 mapping RNA-Sequencing 3917968 3917973 3918029
3917967 3917973 3918027
Figure S7. Identification of the topA transcription start point using 5'-end differential mapping. (A) A magnified view of the topA upstream region showing the location of transcriptional start points (Ts1/Ts1' and Ts2). The number above corresponds to the chromosomal locus of each site. (B) A comparison of the chromosomal loci of the Ts1/Ts1' and Ts2 sites using S1 nuclease mapping and 5'-end mapping.
Figure S8 A
RT-qPCR 30
28 topAM145
26
CT
hrdBM145
hrdB
24
22
topA
20 0
1
2
3
4
5
thiostrepton [μg/ml]
B
RT-qPCR
Relative hrdB transcription [%]
120
100
80
60
40
20
0
10
20
60
42°C exposition [min]
Figure S8. RT-qPCR analysis of hrdB gene transcription in S. coelicolor. (A) A comparison of Ct values for hrdB (blue) and topA (orange) transcripts. RNA was isolated from PS04 strains with different DNA supercoiling levels. The Ct values corresponding to the wild type level of transcript for hrdB (empty arrow) and topA (filled arrow) are marked. (B) Relative hrdB transcription after exposure of the wild type strain to temperature stress (42°C).
Figure S9 A
Quantitative Western Blotting 2.8 30
2.8 42
5.6 30
5.6 42
8.4 30
8.4 11.2 11.2 42 30 42
Cell lysate [µg] Temp [°C]
anti-TopA serum
B linear correlation
18000
Band intensity
30°C 42°C
14000
10000
6000
2000 0
2
4
6
8
10
12
Cell lysate [µg]
Figure S9. Quantitative western blotting. (A) The detection of TopA protein in S. coelicolor cell lysate using anti-TopA polyclonal antibody. Prior to disruption, the cells were exposed to an elevated temperature (42°C) for 60 min. Cells that had not been heat-shocked served as a control. Different amounts of cell lysate (µg of total protein) were loaded on the gel, as indicated. (B) The correlation of band intensity and the amount of total protein loaded for quantitative Western blotting (the range of linear correlation is marked in grey). The band intensity was measured using ImageJ2x software.
MIQE form. RT-qPCR and sample information Experimental Design Definition of experimental and control groups
E
Streptomyces coelicolor at different stages of culture and/or culture exposed to high temperature
Number within each group Assay carried out by the core or investigator’s laboratory
E
Each sample was repeated in 1-3 biological replicates
D
Assay carried out by investigator lab
Acknowledgment of authors’ contribution
D
-
Description
E
Streptomyces coelicolor growing for 24 hours (180 rpm shaking, 37ºC ) in liquid 79 medium. To induce heat-shock cell were exposed to 42ºC for 10-120 minutes
Volume/mass of sample processed
D
50-100 mg of vegetative hyphae after 24 hours of growth
Microdissection or macrodissection
E
-
Processing procedure
E
Collected hyphae was washed with 5ml of cold PBS buffer and immediately processed using manufacturers protocol (see also section: Name of kit and details of any modifications)
If frozen, how and how quickly?
E
-
If fixed, with what and how quickly?
E
-
Sample
Sample storage conditions and duration (especially E for FFPE2 samples)
-20ºC until use
Nucleic acid extraction Procedure and/or instrumentation
E
Total RNA from S. coelicolor vegetative hyphae was isolated using modified manufacturers protocol (see details below)
Name of kit and details of any modifications
E
Total RNA was isolated using GeneJet RNA Isolation Kit (Thermo Scientific) usinge the modified manufacturers protocol (Bacterila Total RNA purification procedure D) #1 step 2: before lysis, cell were treated with 200 µl of lysozyme solution (1mg/ml); #2 step 3: 4-5 drops of zirconia beads in PBS buffer were added and vortexed for 1 min to increases cell disruption efficiency; #3 step 4 and step 5: the volumes of lysis buffer and 100% ethanol were doubled
Source of additional reagents used
D
-
Details of DNase or RNase treatment
E
DNA traces were removed by treatment of 2 µg of isolated RNA with RNase-free DNase I (Thremo Scientific) following manufacturers instruction
Contamination assessment (DNA or RNA)
E
RNA after DNase I treatment served as template for standard PCR reaction with RT3543RV and prom3543RTPCR_FW oligonucleotides. No detectable product after 30 reaction cycles proved elimination of DNA traces (chromosomal DNA)
Nucleic acid quantification
E
The RNA quality was tested using standard gel electrophoresis in the presence of ethidium bromide. Only RNA samples with no detectable degradation was used for cDNA synthesis. The RNA quantity was measured spectrophotometrically
Instrument and method
E
NanoDrop 1000 Spectrophotometer
Purity (A260/A280)
D
samples with OD ratio of at least 1,8 were used for further analysis
Yield
D
-
RNA integrity
E
agarose-gel electrophoresis
RIN/RQI or Cq of 3’ and 5’ transcripts
E
not performed
Electrophoresis traces
E
not performed
Inhibition testing (Cq dilutions, spike, or other)
E
not performed
Reverse transcription Complete reaction conditions
E
cDNA was synthesized from 1 µg of total RNA using iScript Reverse Transcription Kit (Bio-Rad) following manufacturer instructions
Amount of RNA and reaction volume
E
1 µg in 20 µl
Priming oligonucleotides (if using GSP) and concentrations
E
random primers, according to the manufacturer instructions
Reverse transcriptase and concentration
E
according to the manufacturer instructions
Temperature and time
E
according to the manufacturer instructions
Manufacturer of reagents and catalogue numbers
D
Bio-Rad
Cqs with and without reverse transcription
D
not performed
Storage conditions of cDNA
D
-20ºC
qPCR target information Gene symbol
E
see primer and amplicon information on this file
Sequence accession number
E
see primer and amplicon information on this file
Location of amplicon
D
-
Amplicon length
E
see primer and amplicon information on this file
In silico specificity screen (BLAST, and so on)
E
analysis not performed
Pseudogenes, retropseudogenes, or other
homologs?
D
-
Secondary structure analysis of amplicon
D
analysis not performed
Location of each primer by exon or intron
E
not applicable
What splice variants are targeted?
E
not applicable
Primer sequences
E
see primer and amplicon information on this file
RTPrimerDB identification number
D
-
Probe sequences
D
not applicable
Location and identity of any modifications
E
none
Manufacturer of oligonucleotide
D
Sigma Aldrich
Purification method
D
none
qPCR oligonucleotides
qPCR protocol
Complete reaction conditions
E
20 µl reaction contained forward and reverse oligonucleotides in concentration 20 pmol/µl, 10 µl of SYBR Green Master Mix, 120 ng of cDNA
Reaction volume and amount of cDNA/DNA
E
See details above
E
See detail above, Mg and dNTP were supplied in SYBR Green Master Mix
2+
Primer, (probe), Mg , and dNTP concentrations
2+
Polymerase identity and concentration
E
according to the manufacturer instructions
Buffer/kit identity and manufacturer
E
iTaq Universal SYBR Green Supermix (Bio-Rad)
Exact chemical composition of the buffer
D
-
Additives (SYBR Green I, DMSO, and so forth)
E
-
Manufacturer of plates/tubes and catalog number D
Applied Biosystems
Complete thermocycling parameters
E
10 min at 95ºC, followed by 40 cycles of 15 s at 95ºC, 15 s at 58ºC, and 15 s 72ºC. The amplification process was followed by a melting curve analysis
Reaction setup (manual/robotic)
D
-
Manufacturer of qPCR instrument
E
StepOnePlus Real-Time PCR System (Applied Biosystems)
qPCR validation Evidence of optimization (from gradients)
D
-
Specificity (gel, sequence, melt, or digest)
E
Specifity was validated with melt curve analysis (see information on this file)
For SYBR Green I, Cq of the NTC
E
Ct undetected (see information on this file)
Calibration curves with slope and y intercept
E
see information on this file
PCR efficiency calculated from slope
E
see information on this file
CIs for PCR efficiency or SE
D
-
r2 of calibration curve
E
see information on this file
Linear dynamic range
E
Ct20 to Ct35
Cq variation at LOD
E
-
CIs throughout range
D
-
Evidence for LOD
E
-
If multiplex, efficiency and LOD of each assay
E
-
Data analysis qPCR analysis program (source, version)
E
StepOne Software Version 2.3 (Life Technologies)
Method of Cq determination
E
The fluorescence threshold for determining Cq values is automatically set at 1 cycle below the upper limit of the window of linearity
Outlier identification and disposition
E
-
Results for NTCs
E
Ct undetected, see information on this file and section: Contamination assessment (DNA or RNA)
Justification of number and choice of reference genes E
hrdB, see information on this file
Description of normalization method
E
The copy number of each transcript was quantified using calibration curve prepared for H5 cosmid (carrying the S. coelicolor chromosome fragment with targeted gene). For some experiments (see detail in the manuscript) normalized gene expression ratios were calculated by the ΔΔCt method with hrdB as a reference gene.
Number and concordance of biological replicated
D
-
Number and stage (reverse transcription or qPCR) of technical replicates
E
three
Repeatability (intraassay variation)
E
see figures attached to the manuscript
Reproducibility (interassay variation, CV)
D
-
Power analysis
D
-
Statistical methods for results significance
E
-
Software (source, version)
E
algorithms incorporated to the StepOne Software Version 2.3
Cq or raw data submission with RDML
D
-
MIQE form. The oligonucleotides used in qPCR experiments Oligonucleotide
Sequence
hrdBRT_f hrdBRT_r RT3543FWD RT3543RV prom_p2_3543_FW prom2_166RV RTPCR3874RV RTPCR3874FW luxC_FW luxC_RV prom_p1_3543_FW prom1_170_RV
TGCTCTTCCTGGACCTCATC GTAGCCCTTGGTGTAGTCGAA ACGACTTCCAGCCGATCTATGT GGAACACCATGCGCTTGAC CCGTTGCGGGCTTTTCCCG CTTCGCGGTCTCGCTGGTC TCGAGGGACAGGTCTTGTC TCGACTTCGTGACGTACCTCAA CGGCGACAACAGCGTCTA CAACCGCAGCTTGTTGTTCTC GATCGAAACACAGAACGACC GGCCGAGATAGCCCTTGATC
MIQE form. The amplicon details Oligonucleotides
Amplicon name
RT3543FWD/ RT3543RV prom_p2_3543_FW/ prom2_166RV prom_p1_3543_FW/ prom1_170_RV luxC_FW/luxC_RV prom_p2_3543_FW/ luxC_RV hrdBRT_f/hrdBRT_r RTPCR3874FW/RTPCR3874RV
P1+P2 P2 P1 P1+P2_lux P2_lux hrdB gyrase
Amplicon length 186 bp 166 bp 170 bp 88 bp 310 bp 82 bp 100 bp
2
Tm [ºC]
Slope
Efficiency
r
84.87 87.69 85.87 80.65 86.75 82.35 83.99
-3.581 -3.673 -3.788 -3.493 -3.512 nd nd
90.221% 87.176% 83.656% 93.343% 92.636% nd nd
0.998 0.993 0.986 0.994 0.999 nd nd