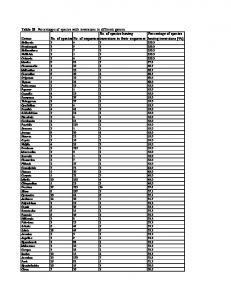
Table S6 Number and mean summary statistic values ...
Recommend Documents
Time to PC of Pde1. Seconds. 0.01 1. 961. 0.97. 0.98. 0.99. 0.99. 0.99. 1. 0.99. Pde1v. PC of Pde1 after adding glucose. mM. 0.01 1e-8. 724. 0.98. 0.98. 0.99.
Transposition of Antibiotic Resistance ... inherited from other datasets. Table S1. Summary of crystallographic data and refinement statistics, Related to Figure 2 ...
triose phosphate isomerase (pfam00121). Y (AigOS1_00553). 5. 5335 ... phosphoglycerate mutase (pfam01676, pfam10143) .... V-type ATP synthase. Subunit I.
S6 Table. Summary of p-values achieved in an Unbalanced ANOVA comparing mean CT values for three reference genes (PTB, UBC and HEL) in ...
Summary of p values obtained from statistical tests of significance carried out for change in mean QUS and texture features estimated from two response groups ...
S6 Table. Sample characteristics and MUAC at each surveillance time point. Time point. Control. Intervention. Sample Age (months). Female MUAC (cm) MUAC ...
Purvalanol B. CDK1/CDK2/CDK4 inhibitor. R547. CDK1/2/4 inhibitor,ATP-competitive ... Senexin A. CDK8 inhibitor, Cyclin-dependent kinase 8. (cdk8) inhibitor.
Dihydropteroate synthase and related enzymes. COG1109. 2.12. 225.87 3.06E-55. 5.89E-52. Phosphomannomutase. COG3668. 1.41. 184.85 2.00E-44. 2.57E- ...
S1 Table. Mean values and 95% confidence intervals in parts per million of the 81 volatile organic compounds included in the predictive models, and measured ...
Flowering time variation in Arabidopsis thaliana. April 15, 2005. S6. Supplementary Table 2. Summary statistics based on individual plants. Condition.
S6 Table. Functional analysis of a random library of wtPTE variants. Changes in phosphotriesterase (PTE; native substrate: paraoxon) and arylesterase (AE;.
Glechoma. N N P A P a un 0 - w N P N w N w N w w w N N 00 N N N N = w w N w Un A = w N P = N = N = N N 00 00 w N N N w N - O w N N w N N.
RAR-related orphan receptor- α. NR1F1. RORβ ... Human homologue of the Drosophila tailless gene. NR2E1 ... V-erbA-related gene|V-erbA-related. NR2F6.
9 Cayman Islands. Cayman Islands. Cayman Islands. Italy. Italy. Portugal. 10 Saint Martin. Saint Martin. Saint Martin. France. France. Uruguay. 11 Saint Barts.
0.6. Time (s). 0.076. 0.095. 0.114. 0.133. 0.152. Pectoralis. Supracoracoideus. Pec adjusted. Supra adjusted. Join. t m om en t (N m. ) -0.14. -0.105. -0.07. -0.035.
Table S6 Number and mean summary statistic values ...
Table S6 Number and mean summary statistic values of non-genic and genic windows (NGW and GW, respectively) in the lowest. 5% quantile for Tajima's D, ...
n Table S6 Number and mean summary statistic values of non-genic and genic windows (NGW and GW, respectively) in the lowest 5% quantile for Tajima’s D, Zeng’s E, Fay & Wu’s H, and θπ for each species. The same information is shown for windows in the top and bottom 5% quantiles for FST . Also included are the number of genes represented by genic windows and the ratio of genic to non-genic windows. NGW