Talbot lithography: Self-imaging of complex structures A. Isoyan,a兲 F. Jiang, Y. C. Cheng, and F. Cerrinab兲 Center for NanoTechnology, University of Wisconsin-Madison, Wisconsin 53706
P. Wachulak, L. Urbanski, J. Rocca, C. Menoni, and M. Marconi NSF ERC for Extreme Ultraviolet Science and Technology, Department of Electrical and Computer Engineering, Colorado State University—Fort Collins, Colorado 80523
共Received 21 July 2009; accepted 5 October 2009; published 3 December 2009兲 The authors present a self-imaging lithographic technique, capable of patterning large area periodic structures of arbitrary content with nanoscale resolution. They start from the original concept of Talbot imaging of binary gratings—and introduce the generalized Talbot imaging 共GTI兲 where periodic structures of arbitrary shape and content form high-definition self-images. This effect can be used to create the complex, periodic patterns needed in the many lithographic fabrication steps of modern semiconductor devices. Since the process is diffraction limited, the achievable resolution depends only on the wavelength, mask patterning, and degree of coherence of the source. Their approach removes all the complex extreme ultraviolet 共EUV兲 reflective masks and optics, replacing them with nanopatterned transmission masks and makes the whole process simple and cost effective. They have successfully verified the GTI concept using first a He–Ne laser, and then demonstrated its potential as a nanolithography method using a compact table-top soft x-ray 共EUV兲 46.9 nm laser source. These sources provide the high degree of coherence needed by diffraction-based imaging and are extendable to shorter wavelengths. They have recorded EUV GTI images up to the sixth Talbot plane, with consistent high quality good results, clearly demonstrating the ability of the GTI method to record high-resolution patterns at large distances. © 2009 American Vacuum Society. 关DOI: 10.1116/1.3258144兴
I. INTRODUCTION The semiconductor industry continues in its relentless pursuit of miniaturization, so that every 3 years or so, the dimensions of the features on an integrated circuit are halved, yielding an increase in density and functionality of electronic circuits. The economic advantages of more devices per unit area outweigh increases in fabrication costs and performance limitations, pushing the industry to seek ever-smaller patterns. As the electronics industry continues to shrink the device size in integrated circuits, optical lithography will reach its practical resolution limit. The semiconductor industry is currently considering the transition from 193 nm to extreme ultraviolet 共EUV兲 lithography, which is based on the use of radiation of wavelength around 13 nm, a region where all materials are highly absorptive and hence only multilayer-coated reflective optics can be used to form images of the patterns to be printed. One of the main problems of EUV lithography is that EUV optical systems are complex and expensive, and today only few exposure tools are available1 thus limiting the development of the technology. An alternative path to the development of EUV lithography can be found in the use of diffractive optics. The interference of two coherent beams generates patterns of highdensity fringes, and these fringes can be recorded in photoresist.2 Using radiation around 13.4 nm it is possible to pattern nanostructures 共see review in Ref. 3兲. Since it does a兲
Electronic mail:
[email protected] Electronic mail:
[email protected]
b兲
2931
J. Vac. Sci. Technol. B 27„6…, Nov/Dec 2009
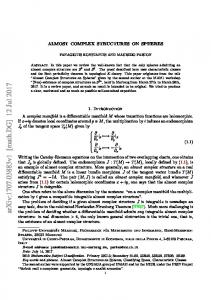
not require complex optics while producing excellent, highmodulation images EUV lithography 共EUV-IL兲 is been used very successfully in the development of advanced photoresists for the next generation lithographic technologies.4 It can create one- or two-dimensional periodic patterns using various configurations, yielding periodic nanostructures with sub-50 nm resolution.5 Higher diffraction orders provide the extension of the traditional interferometric lithography technique to produce periodic structures with a reduction factor of 4X.6 EUV-IL by its nature is limited to periodic structures of dense lines or array of holes or triangles. Holographic projection lithography is the natural extension of this technique to generate arbitrary structures.7,8 The development of compact high flux EUV lasers provides an opportunity to efficiently use interference and coherent imaging for patterning nanometer scale features over large areas.9 Thus, the combination of nanopatterning techniques 共mask fabrication兲 and coherent EUV sources 共illumination兲 allows the creation of complex imaging patterns without complex optical systems. In this work, we report the development of a novel highresolution patterning approach, capable of patterning large area periodic structures of arbitrary content with nanoscale resolution. It is based on Talbot imaging 共TI兲—extended to the generalized Talbot imaging 共GTI兲. The general idea of GTI is illustrated in Fig. 1: a periodic object, historically a simple linear grating, forms highly accurate real images of itself at distances that are integer multiples of a fundamental unit, the Talbot distance ZnT 共in our experiment ZT = 1 mm兲. At these locations phase shifts cancel out and the interfer-
1071-1023/2009/27„6…/2931/7/$25.00
©2009 American Vacuum Society
2931
2932
Isoyan et al.: Talbot lithography: Self-imaging of complex structures
2932
In this article we report the results of an initial demonstration of GTI using several coherent illumination sources. In Sec. I, we present a brief introduction into GTI theory. The mask design and fabrication flow is described in Sec. II, followed by Sec. III describing the results of GTI at 632.8 nm He–Ne laser source and EUV 共soft x-ray兲 table-top 46.9 nm laser source.
II. GTI THEORY While there is a sizable literature on the Talbot effect involving simple periodic gratings,11,12 little is available for the more complex case of repeated arbitrary patterns. Let T共x兲 be the one-dimensional transmission of the object, with T共x兲 = T共x + p兲; T can be real, or complex. A simple Fourier analysis yields FIG. 1. 共Color online兲 Talbot effect: First experimental results in soft x rays 共EUV兲. The mask 共first to the left兲 creates images at the Talbot planes 关atomic force microscope 共AFM兲 images of actual exposures兴. The size of the images shown here is 14.5⫻ 14.5 m2, the individual lines being 500 nm and ZT = 1000 m; only a small area of the mask and exposed patterns is shown for illustrative purposes. Notice the excellent quality of the images at the Talbot planes.
ence of the waves diffracted by the periodic structures recreates the image of the object—without the necessity of any optics. Clearly, GTI is an extension of the classical TI. Interestingly, this more general aspect of TI has received only very little attention in the century and a half elapsed since the original discovery by Talbot10—this can be attributed to the difficulty of creating high-resolution periodic patterns, a topic of little, if any interest until the advent of the semiconductor industry, and to the concomitant need for highly coherent sources. In addition, the development of excellent imaging optics did obviate the need for exploiting the properties of self-imaging objects except for the few areas where no optical system can be easily built. X-ray and EUV are two such regions of great interest for imaging and nanofabrication. We have demonstrated that the combination of a coherent illumination source with a nanofabricated Talbot template allows for the extension of nanolithography in a relatively simple setup: the Talbot template embodies both the information to be written in the exposure field and the image formation system. An advantage of this technique is that any defect on the original mask object is averaged over the entire imaging field, and since the defect/image ratio is, in general, small, the formed image is defect free 共see discussion below兲. The focal or working distance between mask and wafer is also very large. In its simplicity, Talbot imaging opens the door to novel application of nanolithography of periodic patterns, such as high-density memories or magnetic media, where a regular pattern is repeated over and over the area of the field. The ability to form a projected self-image of a complex periodic object has great interest in semiconductor and device fabrication—if one could extend the imaging to the nanometer region. J. Vac. Sci. Technol. B, Vol. 27, No. 6, Nov/Dec 2009
再 冎
T共x兲 = 兺 Cm exp i2 m
mx , p
共1兲
where Cm is the Fourier coefficient, with p the period of the pattern. The incoming electric field Uin共x , z = 0兲 is first transmitted by the object, and then propagates in free space. An extensive analysis of the self-imaging properties of a simple binary grating has been discussed in Ref. 13; while higher orders m introduce and additional phase shift proportional to n2, for the purpose of this article we limit our discussion to the case of the paraxial approximation; a more detailed analysis of the imaging properties will be published elsewhere.14 The propagating field is calculated using Fresnel diffraction, in the simple Fresnel–Kirchhoff approximation, UTrans共x⬘,z兲 =
1 i
冕
+⬁
Uin共x,z = 0兲T共x兲
−⬁
e−ikR dx, R
共2兲
where k = 2 / and R = 冑共x − x⬘兲2 + z2. Assuming the incoming electric field at normal incidence to be of unit amplitude, Uin = 1, normal incident plane wave, by inserting Eq. 共1兲 in Eq. 共2兲 in conjunction with the standard Fresnel approximation, after Fourier transformation we obtain the electric field at a distance z as
冉
UTrans共x⬘,z兲 ⬀ 兺 Cm exp i2 m
冊 冉
冊
m共x − x⬘兲 im2z exp . p p2 共3兲
A self-image is observed after a certain propagation distance zT if the expansion of the object 共1兲 and that of the transmitted electric field 共3兲 are identical. This may happen if and only if
冉
exp
冊
im2z =1 p2
共4兲
for any value of m 共integer兲. This defines the distances znT 共Ref. 15兲 where the paraxial propagation distances satisfies the condition
2933
Isoyan et al.: Talbot lithography: Self-imaging of complex structures
2933
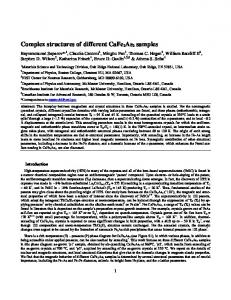
FIG. 2. 共Color online兲 Talbot “carpet,” depicting the intensity of the radiation 共impinging from the top兲 along the propagation direction. The left panel shows the case of a simple grating, the right panel that of a more complex object. Notice the self-images at the znT locations 共Talbot effect兲; laterally displaced self-images are observed at the half-integer positions. However, for the GTI case, no fractional pattern is observed. The figures below the carpets show the intensity profile 共cut lines兲 at the Talbot planes; the similarity is remarkable, although difficult to visualize on the scale of the figure.
znT = n2 → znT = n2p2/ = nzT , p2
共5兲
where n is an integer and zT is the same Talbot distance derived by Lord Rayleigh in 1881.16 We note that in the GTI there is no connection between znT and the near-field Fresnel number, NF = a2 / z, where a is the feature width, not the period. Using a similar proof, any two-dimensional arbitrary periodical pattern will also form self-images at the propagation distance z = zT, as long as the periodicity is the same in the two directions. We note that the final image is formed by the superposition of the orders coming from all the contributing unit cells, so that individual defects are averaged out and contribute very little energy to the image power spectrum. Figure 2 shows the map of the intensity of the radiation transmitted by a periodic linear grating 共the simplest type of pattern兲 and by a more complex periodic structure. In the first case, we can see clearly how the image is reconstructed at the different Talbot planes located at distances zT. A simple geometrical optics analysis further shows that these Talbot planes correspond to the distance where all the diffraction orders overlap, thus reconstructing the original object, or mask. Most important, this overlap repeats periodically so there are a large number of Talbot images 共infinite for a perfectly coherent illumination and an infinitely wide object, as foreseen by Talbot兲. There is a rich set of diffraction phenomena that can be observed in a Talbot system.17 As the value of p / decreases, other effects 共e.g., nonparaxial propagation, polarization兲 must be included explicitly;13 as JVST B - Microelectronics and Nanometer Structures
discussed below, in the experiment section we have observed excellent imaging up to the sixth Talbot plane. III. MASK DESIGN AND FABRICATION The analysis of the case of a simple linear grating system in TI assumes that the grating is infinite. In practice, we must consider the effect of the finite size of the mask due to the fabrication and other experimental limitations. To start with, the desired pattern to be printed on the wafer is the mask pattern. The question that arises are: 共1兲 what is the optimal size of the mask that should be designed for GTI, and 共2兲 what is the resolution that is attainable with such an imaging system in realistic conditions of finite partial coherence. A simple argument provides a guide to the answer. Let 2W be the lateral size of the Talbot mask template. The angle ␣ subtended by the template at the sample position, i.e., at a distance zT, is then given by sin共␣兲 = W/冑W2 + zT2 = 1/冑1 + 共zT/W兲2 = NA.
共6兲
This is the numerical aperture of an equivalent imageforming optical system, converging with aperture NA = sin共␣兲 to the sample. In this case it is a “virtual” NA, since no optics exist to limit the angle. Alternatively, we can note that the size of the Talbot template determines how many diffraction orders can illuminate the center of the image, and thus the resolution; this latter point of view is essentially identical to the former. If is the wavelength of illumination, then the diffraction limit is given by
2934
Isoyan et al.: Talbot lithography: Self-imaging of complex structures
2934
FIG. 3. 共Color online兲 Optical microscope images of the GTI mask.
⌬ = /2NA = 共/2兲冑共1 + 共zT/W兲2兲,
共7兲
i.e., the resolving power is proportional to the size of the template, and inversely proportional to the Talbot plane distance 共the resolution ⌬ is essentially p / 2, where p = 1 / f cutoff of coherent imaging兲. Further simplifying the relation, we obtain ⌬n = 共/2兲
冑 冉 冊 1+
2np2 W
2
共8兲
,
showing how the resolution improves for smaller periods, larger widths of the object, and smaller Talbot distances. In other hand the total number of unit cells in the mask should be equal M = 2W / p. As follows from Eq. 共8兲 the number of cells in the mask for n Talbot imaging plane can be written as M=
4np
共9兲
冑共共2⌬n兲2 − 2兲 .
For the case of radiation around 13.4 nm, with an object of period p = 1 m, target resolution ⌬n = 10 nm, when using n = 1, we obtain M = 270 with a NA= 0.67. Also we can clearly see that the resolution limit of the GTI equals / 2. As in all imaging systems, the depth of focus depends on the resolution and on the numerical aperture of the system. For a diffraction limited system, we have that DOF =
冋 冉 冊册
2np2 = 1 + 共NA兲2 W
strate coated with 200 nm thick Cr. Three different patterns were fabricated. The optical microscope images of the mask are shown in Fig. 3. The mask total width is 23 mm and it contains 123 unit cells repeated in x and y directions, which corresponds to 3.6 m target resolution. The designed ZT Talbot distance is 10.24 cm, unit cell period is 180 m. For the soft x-ray 共EUV兲 table-top laser system, the mask was fabricated on a ultrathin membrane to yield a high tranmissivity at 46.9 nm. We use 25 nm of SiNH silicon-rich nitride as the carrier, with a transmission T ⬵ 13.5% at 46.9 nm wavelength.19 The Talbot template was patterned using standard electron-beam lithography in a 65 nm thick hydrogen silsesquioxane photoresist. This film efficiently absorbs the radiation at 46.9 nm, with a transmission of approximately 3%.19 The field size of the mask is approximately 600⫻ 600 m at a distance of 1 mm for the first Talbot plane 共Fig. 4兲. The period of the patterns in the mask was 4.845 m, and the smallest features were 140 nm. We note that in order to have a point resolution of 100 nm at the soft x-ray 共EUV兲 wavelength of 46.9 nm, the Talbot mask
2
,
共10兲
where the DOF refers to the length of the region of good imaging.18 As a demonstration of self-imaging lithography, we decided to print standard lithographic resolution test patterns. The design of the self-imaging template, or mask, is relatively simple, with identical periods in the x and y directions. For a given wavelength and image position 共also called “focal distance,” as explained below兲 we compute the period of the two-dimensional object that will yield the correct zT. The actual fabrication process of EUV mask is based on one of the standard processes developed at CNTech for creating EUV-IL optics. For the 632.8 nm wavelength He–Ne laser source we fabricated the mask on a rectangular quartz subJ. Vac. Sci. Technol. B, Vol. 27, No. 6, Nov/Dec 2009
FIG. 4. 共Color online兲 Digital charge-coupled device 共CCD兲 camera recorded images of Talbot imaging at first 共10.24 cm兲, second 共20.48 cm兲, and third 共30.72 cm兲 Talbot planes using He–Ne laser light. Notice the ringing due to the highly coherent imaging conditions.
2935
Isoyan et al.: Talbot lithography: Self-imaging of complex structures
2935
FIG. 5. AFM images of 500 nm test patterns recorded at several Talbot planes in 50 nm thick PMMA.
must have a numerical aperture of at least ⬇0.28; thus, the cell of the mask should be repeated in each direction at least 124 times. We note that the use of shorter wavelengths will allow the use of much thicker mask carriers, tmembrane 艌 100– 200 nm, thus providing much more stable support. IV. EXPERIMENTAL RESULTS At first, we used a simple GTI demonstration using He–Ne 632.8 nm wavelength coherent illumination. The experimental setup of the GTI is very simple and does not include any complicated alignments and adjustments. The GTI fabricated mask has been designed to have 180 m period, hence the first Talbot distance is 10.24 cm. The field size of the mask is 2.2⫻ 2.2 cm2, yielding 0.11 numerical aperture at the first Talbot distance, which has the ability to resolve 3.5 m resolution. These exposure results are shown in Fig. 5. In addition, we show in Fig. 6 the atomic force microscope 共AFM兲 image of a set of 140 nm test patterns rotated at 45° relative to the periodic directions, to show explicitly the ability to print arbitrary features. For the demonstration of GTI at 46.9 nm wavelength illumination we have used a highly coherent table top soft x-ray 共EUV兲 laser developed at Colorado State University. The compact Ne-like Ar capillary discharge laser used in this experiment is configured to produce pulses with energy of approximately 0.1 mJ of 1.2 ns full width at half maximum 共FWHM兲 duration. It can be operated at repetition rates of several hertz producing average power levels in excess of 1 mW with high degree of spatial and temporal coherence. The laser operates using the 46.9 nm 3s1P1 − 3p1S0 transition of Ar+8 ion. An alumina capillary of 3.2 mm in diameter and 27 cm in length filled with Ar is excited with a current pulse approximately 22 kA, a 10%–90% rise time of approximately 55 ns, and a first half-cycle duration of approximately 135 ns.20,21 The relative band width of the soft x-ray JVST B - Microelectronics and Nanometer Structures
共EUV兲 laser is approximately ⌬ / = 10−4, yielding a coherence length of approximately 470 m. The spatial coherence length of the beam is calculated to be 740 m at the distance where the exposure took place. We note that the spatial coherence increases when the capillary length is increased, reaching an almost fully spatial coherent beam for capillaries 36 cm in length.22 The capillary discharge laser equipped with a 27 cm long capillary illuminates the Talbot mask placed 219.5 cm away from the laser. That assures that the beam coherence radius is larger than the size of the single Talbot mask, i.e., ⬇650 ⫻ 650 m2. A polymethyl-metacrylate 共PMMA兲 coated sample was placed in the vicinity of the calculated working
FIG. 6. 共Color online兲 AFM images of 140 nm test patterns rotated by 45° recorded at the first EUV Talbot plane in 50 nm thick PMMA.
2936
Isoyan et al.: Talbot lithography: Self-imaging of complex structures
2936
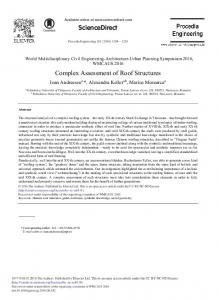
ther, to features only limited by the photoresist resolution and our ability to pattern the original mask. These developments will enable the demonstration of a practical nanopatterning tool for the quick fabrication of large arrays of periodic features that so far were restricted to the use of large synchrotron facilities and opens the possibility of a completely new fabrication approach even for large scale nanolithography with dimensions of less than 10 nm over areas as large as several mm2. Finally, there is no reason to limit GTI to the canonical EUV wavelength of 13.4 nm: the same method can be applied to shorter wavelengths when these will become available, thus extending the imaging ability of the process. In summary, the Talbot imaging is limited by three factors: Our ability to pattern the template, the wavelength of the illuminating source, and its degree of coherence. FIG. 7. 共Color online兲 AFM scan of Talbot imaging on the sixth plane. The sixth Talbot distance is ⬇6 mm, and the pattern is still imaged faithfully.
ACKNOWLEDGMENTS distance of the first Talbot plane, equal to 1 mm. The selfimage of the Talbot mask was generated at this distance and recorded by the photoresist. Typical patterns obtained with an AFM are shown in Fig. 5. The consistency between the images is remarkable and clearly demonstrates the excellent imaging fidelity of the process. We note that for the sake of verification, the samples were also imaged in an SEM 共not shown here兲, yielding similar results, but because of the very thin resist used 共t 艋 50 nm兲 the scanning electron microscope 共SEM兲 image quality is poor. Finally, we show that images were recorded up to the sixth Talbot plane, with good results. We want to note that the sixth talbot plane is not the limit of the GTI mask, being rather the experimental limit since the sample holder stage had only 7 mm working distance. This clearly shows the ability of the method to record high-resolution patterns at large distances. V. CONCLUSION The power of Talbot imaging is evident in the impressive sequence of images shown in Fig. 7. We note that we have recorded excellent images up to the sixth Talbot plane. The technique opens very interesting imaging possibilities, since it does not rely on complex optical systems but rather on the fundamental principles of diffraction and free-space propagation. GTI must not be confused with proximity imaging, as the latter works with the sample in close proximity of the object, i.e., at Fresnel numbers less than 1. Generalized Talbot imaging is ideally suited for highly coherent illumination sources, as demonstrated in our experiment. Its realization relies entirely on the development of short wavelength 共high photon energy兲 sources of sufficient coherence in the soft x-ray 共EUV兲 spectral region. It can be expected that the continuing development of table top laserexcited soft x-ray 共EUV兲 lasers capable to emit in the wavelength region below 20 nm 共Refs. 23 and 24兲 can improve the spatial resolution of table top nanolithography even furJ. Vac. Sci. Technol. B, Vol. 27, No. 6, Nov/Dec 2009
This work was supported in part by the NSF Engineering Research Center for Extreme Ultraviolet Science and Technology under NSF Award No. EEC-0310717 and by the NSF UW Nanoscale Science and Engineering Center 共No. DMR0425880兲. F.J. was supported by the SRC Contract No. 2005OC-985-985.007. This work used the facilities and staff at the UW Synchrotron Radiation Center 共NSF Grant No. DMR-0084402兲, the UW Center for Nanotechnology 共CNTech兲, and the Wisconsin Center for Applied Microelectronics 共WCAM兲. Electron Beam Lithography was performed at the Center for Nanomaterials 共CNM兲 at Argonne National Laboratory. B. J. Lin, J. Microlithogr., Microfabr., Microsyst. 5, 33005 共2006兲, and the references therein. 2 T. A. Savas, M. L. Schattenburg, J. M. Carter, and H. I. Smith, J. Vac. Sci. Technol. B 14, 4167 共1996兲. 3 F. Cerrina, J. Micro/Nanolith. MEMS MOEMS 8, 021201 共2009兲. 4 R. Gronheid and M. J. Leeson, J. Micro/Nanolith. MEMS MOEMS 8共2兲, 021205 共2009兲. 5 V. Auzelyte et al., J. Micro/Nanolith. MEMS MOEMS 8, 021204 共2009兲. 6 A. Isoyan, A. Wüest, J. Wallace, F. Jiang, and F. Cerrina, Opt. Express 16, 9106 共2008兲. 7 Y.-C. Cheng, A. Isoyan, J. Wallace, M. Khan, and F. Cerrina, Appl. Phys. Lett. 90, 023116 共2007兲. 8 F. Jiang, Y.-C. Cheng, A. Isoyan, and F. Cerrina, J. Micro/Nanolith. MEMS MOEMS 8, 021203 共2009兲. 9 P. W. Wachulak et al., J. Micro/Nanolith. MEMS MOEMS 8, 021206 共2009兲. 10 W. H. F. Talbot, Philos. Mag. 9, 403 共1836兲. 11 A. W. Lohmann, H. Knuppertz, and J. Jahns, J. Opt. Soc. Am. A 22, 1500 共2005兲. 12 J. F. Clauser and S. Li, Phys. Rev. A 49, R2213 共1994兲. 13 E. Noponen and J. Turunen, Opt. Commun. 98, 132 共1993兲. 14 F. Jiang and F. Cerrina, 共unpublished兲. 15 J. W. Goodman, Introduction to Fourier Optics, 3rd ed. 共Roberts & Company, Engelwood, CO, 2005兲, pp. 88–91. 16 L. Rayleigh, Philos. Mag. 11, 196 共1881兲. 17 M. Berry, I. Marzoli, and W. Schleich, Phys. World 14, 39 共2001兲. 18 M. Born and E. Wolf, Principles of Optics, 7th ed. 共Cambridge University Press, Cambridge, 1999兲, pp. 489–492. 19 Center for X-Ray Optics, http://www-cxro.lbl.gov/. 20 C. D. Macchietto, B. R. Benware, and J. J. Rocca, Opt. Lett. 24, 1115 共1999兲. 1
2937
Isoyan et al.: Talbot lithography: Self-imaging of complex structures
21
B. R. Benware, C. D. Macchietto, C. H. Moreno, and J. J. Rocca, Phys. Rev. Lett. 81, 5804 共1998兲. 22 Y. Liu, M. Seminario, F. G. Tomasel, C. Chang, J. J. Rocca, and D. T. Attwood, Phys. Rev. A 6303, 033802 共2001兲.
JVST B - Microelectronics and Nanometer Structures
23
2937
Y. Wang, M. A. Larotonda, B. M. Luther, D. Alessi, M. Berrill, V. N. Shlyaptsev, and J. J. Rocca, Phys. Rev. A 72, 053807 共2005兲. 24 Y. Wang, E. Granados, F. Pedaci, D. Alessi, B. Luther, M. Berrill, and J. J. Rocca, Nat. Photonics 2, 94 共2008兲.