Understanding the resolution limit of Displacement Talbot Lithography P.-J.P. Chausse, E.D. Le Boulbar, S. Lis and P.A. Shields Department of Electronic and Electrical Engineering, University of Bath, Bath, UK E-mail :
[email protected] @ManuGaN_UK
Introduction & motivation: Background: Displacement Talbot Lithography (DTL) is a fast new approach to pattern periodic micro-nano structures at the wafer scale. Aim: To determine the mask parameters to optimize the resolution of this lithography method. Why? To find the fundamental resolution limit of this technique. How? MATLAB modeling and experimental comparison.
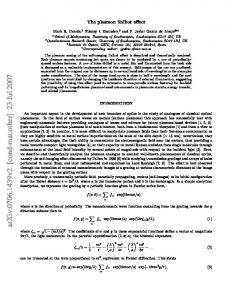
Displacement Talbot Lithography (Eulitha Talbot Effect
z x
TM Phable ):
Resist modeling:
z
Collimated beam: λ=375nm
x x
Dill and Notch models for ultra i-123 resist with MF CD26 developer :
y
(μm)
(μm)
Contrast
Photoresist Substrate
(μm)
(μm)
Talbot self-images of a 600 nm period linear amplitude grating
Impact of the development time on the resist thickness as a function of the illumination dose
(μm)
Intensity seen by the sample after integration over one Talbot Length, ZT
Aerial image: Normalized intensity received by the resist after displacement
Aerial image modeling: 10%
(μm)
Aerial characteristics: Width of primary patterns. Background value.
a)
Contrast of the resist as a function of the development time
Maximum of secondary patterns (unwanted features).
b)
(μm)
10% contrast leads to an exposure threshold of 90% for defining the minimum width of resist features.
(μm)
a) Hexagonal Amplitude mask, b) corresponding Aerial Image
Hexagonal amplitude mask:
Experimental threshold: 70 mJ/cm2
Relative intensity of maximum of secondary patterns
Relative intensity of background
Theoretical diameter (μm)
1.5 um
a)
80 mJ/cm2
b) (μm)
c) (μm)
(μm)
Hexagonal phase mask: 1.5 um
Opening in resist as a function of the exposure dose with a 1.5 um hexagonal mask
Relative intensity of maximum of secondary patterns
Relative intensity of background
Theoretical diameter (μm)
80%
a) 90%
b) (μm)
c) (μm)
(μm)
Conclusion: Opening distribution across a whole 2” wafer for 1.5 um mask as function of the exposure dose
Using 90% contrast thresholds gives experimental inhomogeneity. Choose 80% contrast threshold for resolution calculations and good homogeneity.
Amplitude mask: Small openings on mask lead to small features and a low background. Unwanted secondary pattern intensity could be reduced by choosing the right pitch. Phase mask: Large openings on mask lead to small features and a medium-low background. Unwanted secondary pattern will appear without any possibility to reduce it. In both cases, the DTL resolution can be enhanced but at the expense of an increased secondary pattern and background intensity.