Strabismus, 18(3), 78–82, 2010 Copyright © 2010 Informa Healthcare USA, Inc. ISSN: 0927-3972 print/ 1744-5132 online DOI: 10.3109/09273972.2010.502958
proceedings article
Task-Dependent Representation of Moving Objects Within Working Memory in Obstacle Avoidance Gregor Hardiess, PhD, and Hanspeter A. Mallot, PhD
Strabismus Downloaded from informahealthcare.com by HNO Klinik on 09/15/10 For personal use only.
Faculty of Biology, Cognitive Neuroscience, University of Tuebingen, Germany
ABSTRACT Purpose: The purpose of the study was the quantitative analysis of the working memory representation of dynamic objects related to gaze movement behavior. Methods: Eighteen subjects participated in a virtual street-crossing paradigm. The primary task was collisions avoidance. To investigate the representation format, during a sub-task subjects were asked to reconstruct the traffic scene from memory. Results: The distribution of cars positioned during the sub-task reveals a task-dependent (i.e., collision-relevant) representation of about four cars. In contrast, analysis of gaze behavior did not show a preference for collision-prone cars. Conclusion: Subjects avoided collisions efficiently by applying a gaze strategy adequate to create a representation that fulfills the demands of the task. Collision-prone cars are more likely to be represented in memory, but not more likely to be fixated. KEYWORDS: dynamic objects; representation; visuospatial working memory; gaze movements
INTRODUCTION
Cavanagh, 2004; Luck & Vogel, 1997). In adaptation to the resolution constraint of the sensors, visual exploration makes use of eye movements. Additionally, the process of visual selection draws attention to stimuli that are relevant for the purpose of the task (e.g., Land et al., 1999; Pelz & Canosa, 2001). This selection process helps to create representations purposefully and to fill the VSWM optimally. A very important but poorly understood function of vision is the exploration and representation of dynamic visual scenes. Most behaviors and situations involve task-relevant objects that change their positions over time. One example of such a situation is collision avoidance during the crossing of an interception (Geruschat et al., 2003; Whitebread & Neilson, 2000). Although a certain amount of dynamic objects have to be perceived and processed in order to adjust a convenient passing distance, we perform this complex task often without any effort. Until recently, very little was known about the creation of VSWM representations during such dynamic tasks (Fehd & Seiffert, 2008; Narasimhan et al., 2009).
The prominent role of human vision for the purpose of orienting and navigating successfully is beyond question. But which pieces of information should be selected as important in the complex, everyday surroundings with an almost unlimited amount of visual cues, where all of these stimuli compete for visual attention? Clearly, our brain had to develop selection strategies. Besides task demands that lead to top-down selection processes, two constraints of the human visual system determine the exploration strategies: (i) the retina is limited in resolution and (ii) cognitive processing within the visuospatial working memory (VSWM) (Baddeley, 1986; Baddeley & Hitch, 1974) is limited in capacity (Alvarez & Received 14 May 2010; Accepted 19 May 2010 Correspondence: Dr. Gregor Hardiess, Department of Biology, Cognitive Neuroscience, University of Tübingen, Auf der Morgenstelle 28, 72076 Tübingen. Tel: +49 (0)7071 2974605 Fax: +49 (0)7071 292891. E-mail:
[email protected]
78
Task-Dependent Representation of Moving Objects Within Working Memory in Obstacle Avoidance 79 The purpose of the present study was to investigate the representation of dynamic objects (i.e., cars) in VSWM using a virtual intersection paradigm with the task of collision avoidance. The content of representation was assessed together with the gaze movements carried out to collect relevant information.
MATERIALS AND METHODS
Strabismus Downloaded from informahealthcare.com by HNO Klinik on 09/15/10 For personal use only.
Subjects Eighteen normally sighted subjects participated in this experiment. All subjects were students recruited from the faculty of biology in Tübingen. Informed consent was obtained from each subject after the nature and possible consequences of the study were described. The research followed the tenets of the Declaration of Helsinki and was approved by the institutional human experimentation committee.
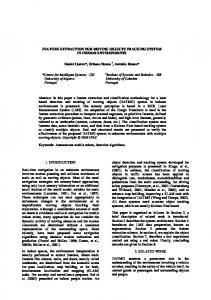
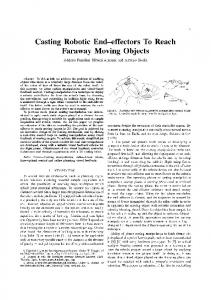
Equipment Eye movements were recorded with a head-mounted eye tracker (model 501, Applied Science Laboratories, Bedford, United States). To record head movements, the ART-track/DTrack system (A.R.T. GmbH, Weilheim, Germany) was used. This device tracks a rigid body fixed to the eye tracker (Figure 1, inset picture). Both trackers had a temporal resolution of 60 Hz. Consequently, gaze was calculated by adding the components for eye-in-head and head-in-space movements together. The experiment was performed using a virtual reality environment displayed on a large, conic projection screen shown in Figure 1. This screen provided a field of view of 150 × 70 degrees to the subject. Subjects were seated upright with their back tightly at the chair and with their head in the axis of the conical screen (eye level at 1.2 m with 1.62 m screen distance). Experimental procedures and rendering of the virtual environment were programmed in the SGI OpenGL Performer™.
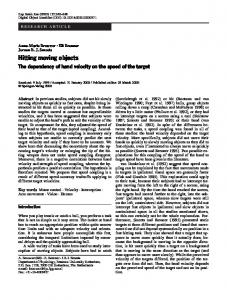
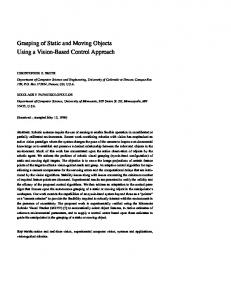
Task Design The primary setup of the task was that of approaching to an intersection and crossing that intersection without having a crash. The intersection road contained two lanes, one for white cars coming from left, and one for red cars coming from the right. Cars were modeled in three lengths (i.e., 5, 7.5, and 10 m; Figure 2). They all drove with a constant speed of 50 km/h. To create realistic traffic situations, we generated exponentially © 2010 Informa Healthcare USA, Inc.
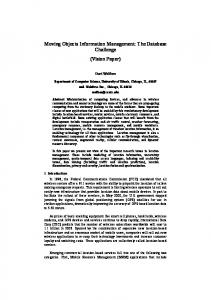
distributed random variables by using the logarithm method (see Knuth, 1997) for calculating the distances between cars. Parameters were adjusted in order to generate a mean traffic density that caused a crash rate of 60% when subjects would cross the intersection with random speed. Each trial consisted of two phases, the phase of passive approach and the interaction phase. Phase 1—Passive Approach During this initial phase, subjects were driven passively with a constant speed of 30 km/h towards the intersection from point S to point E1 (i.e., 31 m, Figure 2). The task for the subjects was to explore the environment, especially the intersecting traffic, in preparation for the active collision avoidance during the second phase. After 3.7 seconds this approach phase was terminated by the appearance of a black bar occluding the entire intersection road with all the cars for 333 ms. Phase 2—Car Positioning or Collision Avoidance In half of the trials subjects had to avoid collisions actively after the disappearance of the black bar by adjusting their own driving speed within the range of 15 to 50 km/h from point E1 to E2 (Figure 2). They could accelerate and decelerate smoothly by pushing a joystick forward and backward, respectively. After point E2 (indicated by a white line, cp. Figure 2) subjects were driven passively across the intersection and the experimental program checked for a possible crash. During this last passive stage visual feedback was prevented by hiding the scene. In each of the collision avoidance trials the traffic constellation was generated in a way that subjects would have a crash in case they didn’t change their initial speed (i.e., 30 km/h). In the other half of trials, subjects had to reproduce as precisely as possible the entire traffic situation (i.e., type, direction, and position of cars) as seen immediately before the black bar appeared. For this purpose they saw the empty intersection road from the point E1. Above the road two pools of cars were presented (Figure 3) for the purpose of selection and positioning with the help of the joystick. Subjects had 30 seconds for this reproduction process; remaining time was indicated by a time bar (cp. Figure 3).
Procedure After instruction of the subject and execution of some test trials (introduced to make subjects familiar with the use of joystick and the task) the tracking devices were calibrated. Additionally, each experimental trial started with a 5-second fixation phase during which a fixation cross was displayed at eye level in the center
Strabismus Downloaded from informahealthcare.com by HNO Klinik on 09/15/10 For personal use only.
80 G. Hardiess and H. A. Mallot
FIGURE 1 Screenshot of the projection screen with the intersection task. Inset picture: picture of the eye tracker with the fixed target for head tracking.
−200m
5m
200m
E2
−10m
E1
−35m
7.5m 10m
S
−66m
FIGURE 2 Task overview. The black arrow symbolizes the approach direction towards the intersection (dark square) of the subject and the white ones these of the white (from left to right) and red (from right to left) cars. S: starting point, E1: end point of the approaching phase and start point of the interaction phase, E2: end point of the collision avoidance phase.
of the screen. The total experiment contained 40 trials. Each trial started with the phase of passive approach to the intersection. Subsequently, subjects had to perform either the car positioning or the collision avoidance subtask. Each of these subtasks was presented 20 times in random order.
RESULTS The primary objective for the subjects was collision avoidance. Subjects showed an overall crash rate of 45.79% ± 13.87%. This crash rate was significantly lower than the 60% chance level for having a crash
FIGURE 3 Screenshot from the positioning task. Above the intersection road cars out of two pools (i.e., all sizes for each color of cars) could be selected with the black bracket for positioning. The white rectangle shows the remaining time.
when crossing the intersection without inspection (t[18] = 4.47, p < 0.001). In the car positioning subjects positioned on average 4.12 ± 1.33 cars in each trial while on average 15.55 ± 2.46 cars had been presented in each trial. Figure 4A shows the distribution of cars positioned in each interval. The distribution of red cars (i.e., moving from right to left) reaches its maximum of over 20% for the interval 20 ± 5 m, clearly before the intersection, related to the driving direction of these cars. The same distribution was found for the white cars. Here, the maximum of positioned cars was within the interval −10 and −20 ± 5 m, and thus clearly before the intersection, too. Additionally, there was a significant difference between the number of positioned cars driving towards the intersection and cars leaving the intersection (t[36] = 16.4, p