The WordPress theme Twen-. tyTen with a simple system of horizontal menus has been used for designing the site. The desi
To be published in Benyoucef, M. et al. (Eds.): E-Technologies, LNBIP 209, Springer, 2015 ©Copyright Springer 2015
Teaching Enterprise Modeling based on Multi-Media Simulation: a Pragmatic Approach Ilia Bider1, Martin Henkel1, Stewart Kowalski1,2, Erik Perjons1 1
DSV Stockholm University, Stockholm, Sweden 2 Gjøvik University College, Norway {ilia|martinh|stewart|perjons}@dsv.su.se
Abstract. The paper addresses the problem of how university students can acquire enterprise modeling skills so that they can build high quality models of organizational structure and behavior in practical settings after their graduation. The best way of learning such skills is apprenticeship where the students follow a modeling master in a real business case. However, in a university classroom setting this is difficult to arrange, if even possible. Therefore, the paper suggests the use of a computer-based simulation as a good approximation to apprenticeship. Moreover, it suggests a pragmatic, low-cost approach making the idea accessible even for courses with a low budget. A business case is simulated by providing the students with multi-media information sources that are usually used by system or business analysts when building models. The sources consist of recorded interviews with the stakeholders, a web-site of the enterprise under investigation, internal protocols from management meetings, results of twitter search on the company name, etc. The paper presents practical guidelines on how to build such simulation based on a trial successfully completed at the Department of Computer and System Sciences at Stockholm University. Keywords: eEducation, modeling skills, Information Systems, simulation, multi-media, apprenticeship
1
Motivation
This paper is devoted to the topic of teaching and learning how to model different aspects of organizational structure and behavior in order to provide proper IT solutions for businesses and public offices. This topic, which is often referred to as business or enterprise modeling, is of special importance for the university programs in Information System (IS), and other IT-related fields such as Computer Science and Software Engineering. Its importance for the IT professionals is well understood, and is discussed in the literature related to university teaching in IT-related fields, see, for example, [1], [2], [3]. The main problem with acquiring enterprise modeling skills, besides the formal knowledge on the syntax and semantics of enterprise modeling languages needed, is that enterprise modeling skills include knowledge on how to extract knowledge from the unstructured reality of business life. While the first kind of knowledge is quite 1
suitable for teaching in the classroom of a university, the second kind is not, as it belongs to the area of tacit knowledge [4] or Ways of Thinking and Practicing (WTP) [5]. The best known solution for acquiring WTP is apprenticeship where the students follow and help a modeling master in a real business case. However, in a university classroom setting this is difficult to arrange, if even possible. Some approximation to a real business case could be achieved by simulating the enterprise in a computer. This type of simulation of real-life objects is already in use in some subject of university teaching, e.g. simulation of a patient in medical profession, where it showed good results [6], [7]. As far as IS and other IT related disciplined are concerned, we found only one example of using simulation of an enterprise for teaching systems analysis, HyperCase, which appeared as early as 1990. According to its designers, HyperCase showed to be more appreciated by the students than traditional methods [8]. Though HyperCase was introduced in 1990, it is still in use [9] as an accompanier for an IS course book [10]. The idea used in existing simulation of real objects for teaching is that the object itself is simulated, e.g. a patient, or an enterprise. With today’s technology, it is certainly possible to create a virtual reality where a student can work through the enterprise, observe what employees are doing, ask them questions, etc. This is the main idea behind HyperCase. Though technically simulating a real enterprise is possible, it comes at a considerable cost. While it may be economically justifiable to simulate an enterprise as an accompanier to a course book that is sold in large volumes, building such a simulator for a single course would be hardly justifiable. In the work reported in this paper, we tested another idea of using simulation in teaching enterprise modeling. Instead of simulating an enterprise, we simulate a situation of an apprenticeship where the students follow a modeling master and help him/her to do some part of the work on building models. More specifically, the analyst chooses the information sources to be used for building a model, and hands the work of building the model to the students. Such sources may include (but are not limited to): (a) interviews with stakeholders, e.g. CEO, CIO, (b) samples of relevant documents, e.g., meetings protocols, forms for managing orders, (c) web-based sources, e.g. a company web site, results of twitter search on company name. To simulate such sources, e.g. using video recorded interviews, is much easier than to build a virtual representation of an enterprise. The goal of this paper is to present practical recommendations on how to build an apprenticeship simulator based on the trial completed at the department of Computer and System Sciences (DSV) at Stockholm University. The simulator has been built for an introductory course in IS for first year students. One of the main learning activities in the course is a project assignment that requires the students in groups to build different types of enterprise models of an imaginary company presented to them. In earlier occasions of the course, the company was presented in form of a text description. The simulator substituted the text description with a web site that contained multi-media sources of information as described above and a number of modeling assignments left to the students by the master. The site also contained some tips on what sources to use when completing particular assignments via links made from assign-
2
ments to these sources. The simulator has been used in two course occasions and got positive feedback from both the students and teachers engaged. Besides working with the simulator on their own, the students meet a teacher three times during the project, two of them for consultations, and one for presentation of the results to the teacher and peers. In the two first meetings, the teacher plays the role of modeling master, which makes the setting more close to the real apprenticeship. In the paper, we use our simulator to illustrate the used design principles, and share our experience obtained when building and using the simulator. We believe that this experience may be of interest to other teachers in courses that have one of their learning objectives to acquire enterprise modeling skills. The rest of the paper is structured in the following manner. Section 2 gives an overview of the trial course, and the project for which a simulator has been built. Section 3 describes the way the imaginary company was presented in the project before the simulator was introduced. Section 4 discusses the new way of presenting the imaginary company – using multi-media information sources – and our experience of developing these sources. Section 5 describes the structure of the project site that integrates all multi-media information sources with the assignments for the students related to building the models. Section 6 gives some results of the trial evaluation through surveying the students and the teachers. Section 7 contains our reflections on using the simulator at two course occasions, and Section 8 contains concluding remarks and plans for the future.
The Trial Course and the Project Business Case
2
The trial has been completed in the frame of the first year course called “IT in Organizations” (ITO). Below, we also will refer to this course as the “trial course”. ITO is a first year course that is mandatory for approximately half of the students who enroll to bachelor programs at DSV. The number of enrolled students is approximately 250. The course is given each fall term, and it is the second course for the students. Before this course they have only completed one other course, “IT for personal use”, which presents basic theories and concepts in IT and computer science. The trial course ITO can be classified as an introduction to IS. The overall goal of the course is to give the students basic knowledge and skills on the analysis, design and development of information systems, including theories, methods and techniques for this. Additionally, the course should create an understanding of how organizations - their goals, products and services, business processes and information - can be changed by using different forms of IS. The length of the course corresponds to five weeks of full-time work for the students. The course is 7.5 credits according to the European Credit and Transfer and accumulation Systems (ECTS). Being an introductory course, the course has a wide scope. It includes an overview of a number of modeling techniques, such as functional modeling (with the help of Icam DEFinition for Function Modeling 0, abbreviated IDEF0 [11]), process modeling (with Business Process Model and Notation, abbreviated BPMN [12]), goal modeling (with Business Motivation Model, abbreviated BMM [13]), and a number of others. The teaching and learning activities in the 3
course include lectures, workshops, tutorials, labs and a project assignment. The project assignment is completed in groups of 4-5 students, and it is built around a fictitious company called “AFFE”. The company is said to be engaged in development and sales of a business game.
3
Presenting the Project Case in a Textual Form
In previous years of the ITO course, the AFFE’s business was presented to the students in a textual form. For example, a textual description of how the company handles invoices was available. Based on this textual description, the students needed to complete a number of tasks. For example, one task was to “Build diagrams of business processes currently used in AFFE’s practice using BPMN”. Based on the textual description, the students were supposed to produce a process diagram. Table 1 gives examples of text fragment from the textual descriptions. As can be seen, the text contained several types of information to cover the company’s current state of affairs, their products, working procedures, the IT system they use, and the organizational changes that the company is planning. Table 1. Fragments of the text description of AFFE Type of information
Example of text fragment
Company background information
“The company has a game development apartment with 14 game developers and a sales department with 20 salespersons. The sales department handles marketing, sales, order processing and delivery.”
Current state of affairs
“The company needs to borrow money to fund further development of the game but the banks are unwilling to lend because of the insufficient profitability. Furthermore, the competition is hardening, as many game development companies start developing similar business games for the Swedish market. AFFE's game is still the best-known business game in Sweden, at least for manufacturing companies.”
Facts on products
“The AFFE game can be played by one user which can take multiple roles in an enterprise governed in the game. The game can also be played by several users who then take different roles in the enterprise.”
Working procedures
“Today, the development of the next game release is completed in the following way: After the previous version of the game has been released, the game developers are gathered to determine what requirements must be met in the next version.”
Facts on systems used
“AFFE currently has the following support systems: a customer record system in the form of an excel sheet, an IT-based financial system for accounting, a version control system for the game's code, …”
4
Type of information
Example of text fragment
Organizational change
“Management has discussed various solutions to increase the company's profitability. They have decided to implement the following five changes:
4
• To offer clients customized variants of the business game. • To offer the game as a cloud service”
Presenting the Project Case as Multi-media Simulation
When designing a new way of presenting the project assignment to the student, we used the following guiding design principles: 1. Give the student a more realistic understanding of the work of system and/or business analysts. As the authors of this paper had experiences of consulting practice, we know that textual presentations like described in Section 3 are seldom handed to an analyst. Thus, using this kind of descriptions may create misconception in the student’s mind of how an analyst works. 2. Use several types of presentation media. This is in-line with principle 1 above. An analyst, normally, does not rely on one type of information sources, but combine several, e.g., interviews with stakeholders, observations, facilitating workshops, documents analysis, etc. 3. Apply a pragmatic, low cost approach. Our goal was to develop an approach that could be used in any course that include modeling assignment without requiring a lot of expensive resources 4. Keep the case already used intact. We tested our approach on the same case as described in Section 3, partly to satisfy the principle 3 above, and partly to have a possibility to make a more adequate evaluation of the impact of the change in case presentation. Based on the principles above we have chosen to use the following types of information sources and media for presenting the case to the students: • Video recording – for simulating interviews with stakeholders. This media could also be used for simulating a facilitating workshop, or a management group meeting. However, we have not chosen to video recorded these latter types of information sources; it would have required much more resources to do (see principle 3 above). • Web-based presentation – for simulating the company’s website, or social media search on the company name. Based on our experience from being analysts, it is very important to use sources such as the web before the first visit to a company. For example, web-based presentations such as the company web page and other public information are important input for an analyst. • Document-based presentation – for simulating internal and/or external document circulating in the company, e.g. protocol from steering committee meeting. 5
In Table 2 below we list all multi-media presentation fragments created for the business case outlined in Section 3. The listing is organized according to the media-type in the first column. The last column shows the approximate costs to produce each fragment in person-hours. The costs are divided in two sub-columns: Design costs (D), and Execution costs (E). The design costs are onetime costs that were required to find out the way to build a component. The execution costs represent the cost of producing the component. When developing a new project site, e.g. for another course, only the execution costs should be taken into consideration. The last row, which is separated by double line does not represent any presentation fragment, but is related to creating a site that integrates all fragments and project assignments. It is added to show the total cost for producing the new way of presenting the project assignment. Table 2. Multi-media presentation fragments of AFFE Media type
Presentation fragment
Costs1 D
E
Video recording
Interview 1 with game development manager (simulated) Interview 2 with sales manager (simulated) Interview 3 with CEO (simulated)
3
2 2 2
Web-based sources
Website of the company (AFFE) (simulated) Twitter feed containing customer opinions (simulated) Financial info from http://www.proff.se/ (simulated) IT systems in use – links to real system vendors websites
1 1 1 0
3 1 1 1
Documentbased sources
Excel sheet 1- sales leads management template (simulated) Excel sheet 2 - customer management template (simulated) Protocol of internal management meeting (simulated)
1 1 0
1 1 1
Integration
Course project site
24
8
1
All costs are in person-hours
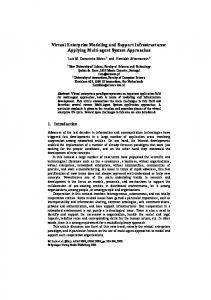
Table 3 shows how various types of information from Table 1 have been incorporated in the presentation fragments listed in Table 2. For example, we choose to represent the need for organizational change with a protocol from a management group. In the paragraphs that follow, we shortly describe each presentation fragment and the way it has been produced: 1. Interviews 1-3 was created by letting three teachers play the role of CEO, development manager and sales manager respectively. A fourth teacher was acting as the analyst, asking questions to the interviewees. Fig. 1 shows an image from the resulting interview with the development manager. To save time (principle 3), and partially to make the interviews more authentic (principle 1), neither the analyst nor the interviewees had prepared any statements or questions. Instead of preparing by having a pre-defined script, the interviewees had read the textual description of the case and studied the intended outcome from the student work with assignments 6
related to the interview. For example, the teacher playing the development manager studied the BPMN process diagram that would be the outcome of the student work with one of the assignments. The recording of the interview was done in the university studio, with a professional backdrop and three cameras (left, full scene, and right). All cutting was done in real-time, so no post-processing was necessary. The “analyst” started the interview with a short presentation of the aim of the interview as well as involved persons. Since the teacher playing the role of analyst has extensive experience, he asked the development manager probing questions such as “How is this performed?”, “If this happens, what do you do then?” etc. A central part of the interview was also that the analysts made brief summaries of what was being said, to get confirmations from the interviewee. Introducing these short summaries, besides being a practical technique applied by experienced analysts, also had the benefit of allowing the students to take notes without the need to rewind the video. Each interview lasted between five and seven minutes. The interviews had to be redone 2-3 times until a satisfactory final recording was done. Each interview took about 40 minutes to record, which in total gives about 6 persons-hours for the three interviews, since three persons where engaged in the interview (interviewee, analyst, technician). Before starting the interview, 3 hours were spent on design, for example the number and type of interviews was decided. Table 3. Multi-media fragments usage to provide info needed for completing the project Type of information
Presentation fragment
Company background information
Website
Current state of affairs
Twitter feed, Financial info, Protocol, Interview 3
Facts on products
Website
Working procedures
Interview 1, Interview 2
Facts on systems used
IT-systems in use, Excel sheet 1, Excel sheet 2
Organizational change
Meeting protocol
2. Website of the company AFFE was designed using the content management system WordPress. As any typical company website, the site included pages About us, Customers, Contact us, Product, etc. Most of the background information from the textual description was spread through these pages. The WordPress theme TwentyTen with a simple system of horizontal menus has been used for designing the site. The design took about one hour, while the creation of pages and menus using WordPress took about 3 hours. We used an existing WordPress installation provided by the university, and thus had no direct cost for installation.
7
Fig. 1. The Project site – interview with the game development manager (left)
3. Twitter feed containing customer opinions was created by getting a list of results from searching Twitter on an arbitrary search phrase. The search results were first converted into the PDF format and then edited, so that they represented customers’ opinions and questions on AFFE and its product. Both negative and positive opinions were simulated in the feed, e.g. “the game is good by difficult to learn”, “Oh, no it went down again”. The PDF format was chosen as it took little time (principle 3) to edit the search results using Acrobat Adobe Pro and thus produce a realistic (principle 1) simulation. An alternative could be producing a HTML page. In total the twitter feed took about 2 hours to create. 4. Financial info simulation was created by experimenting with the on-line Swedish service http://www.proff.se/. This service provides basic financial information covering the last three years of any Swedish company. By testing the service on several real companies in the IT sector of the appropriate size, we found a company that corresponded roughly to the state in the affairs of AFFE. The information obtained was then converted to PDF and edited to produce simulated financial information for AFFE. Again, the PDF format was chosen as it took little time (principle 3) to edit the result and thus produce a simulation. In total the financial info took about 2 hours to create. 5. IT systems in use were not simulated; we have chosen three systems of the right type on the Swedish market and provided links to the vendors’ sites where these systems were described: PVCS version management from www.serena.com, Visma accounting system and wages administration system from www.vismaspcs.se. This step was straight-forward and required one hour. 8
6. Excel sheet 1, 2 were simulated by searching Internet for Excel based customer management and downloading available templates, see for example http://www.vertex42.com/ExcelTemplates/crm-template.html. Then, the templates where translated to Swedish and filled with simulated data. To find an example of a sheet took about one hour for each sheet; another hour was spent for translation and adding data. In total this took 4 hours. 7. Protocol containing meeting notes was simulated by reformatting the text already existing in the textual description of the project case from the previous year, see the last row of Table 1. Reformatting consisted of making the text look like a formal protocol; it was done based on the designer’s experience of reading, and, sometimes, writing such protocols. This activity took less than one hour.
5
The Project Website
The multi-media presentation fragments and the project assignments were integrated in a project website [14]. The site lists all sources of information via having links to the fragments listed above, and it lists all assignments, and to each assignment it gives recommendations on what sources to use when completing the assignments, see, Fig. 2. Links to all sources Links to all assignments Title for Assignment D Assignment description
Links to all assignments
Links to sources needed to carry out Assignment D
Fig. 2. The Project site – Description of a task that students need to carry out
Fig. 2 shows an example of an assignment – the assignment with the title: “Describe graphically the as-is business processes of the company in BPMN”. The assignment page also provides links to sources needed to carry out the assignment. The project website has been designed under the content management system WordPress using a theme called “Responsive” that allows several levels of menus, 9
both in the top of the pages and on the sides. The menu system was used to connect presentation fragments to the assignments and arrange the fragments in groups. It took relatively long time to build the project site, 32 hours. However, most of this time (about 24 hours) went into designing the site structure. Now, when the structure is in place, it takes very little time to set up a website for a new project, provided that all presentation fragments are created, and the instructions for the project assignments are written.
6
Evaluation
The project website with multi-media presentation of a business case was used in two course occasions, fall 2013 and fall 2014. To understand how the change in case presentation impacts teaching/learning of modeling skills, a number of surveys have been completed. After the occasion of fall 2013 the following survey evaluations has been completed: 1. A project website evaluation by the students on the issue whether the multi-media presentation of the company had enough information to carry out the project tasks. Most of the students who participated agreed on that the information content of the site was satisfactory. 2. A project website evaluation by the teachers. The teachers agreed that the engagement of the students became higher and the quality of results in the project somewhat increased. They disagreed on other parameters that were related to their work, e.g. their workload for mentoring the project work did not decrease. 3. An evaluation by the students based on comparison with another course that used the textual presentation of the project. The majority of the students agreed that the multi-media presentation of project assignment was to be preferred in all courses that include business/enterprise modeling. 4. Comparative analysis of examination results for years 2012 (textual presentation) and 2013 (multi-media presentation). The result showed that the “tail” of the distribution of lower grades improved for 2013 compared to 2012. This means that the less performing students showed better results after the project site has been introduced (no change for the better performing students were detected). After the occasion of fall 2014 a new evaluation has been conducted: 5. A project website evaluation by the students with the focus on comparative investigation of different media types used in the case presentation. All first four evaluations pointed towards some improvement in learning environment and results. Due to the limited space, we do not present the results of the evaluations 1-4 1, but focus on the latest evaluation, evaluation 5 from the list above, as it is more relevant to the topic of this paper. 1
The results of evaluations 3,4 are to be published separately in [19]. Note that [19] is complementary to this paper, as it does not contain details on the simulation design.
10
When designing the survey for the latest evaluation, we used a combination of parameters from different frameworks, e.g. [15,16], as we failed to find a ready-made framework for our purpose; in addition to the used frameworks we also added a parameter to measure student engagement.. The design process resulted in selecting the following parameters: 1. Usefulness – the degree to which the project site helped to attain the goals set. This parameter corresponds to Perceived Usefulness (PU) of the TAM framework [15]. 2. Completeness – the degree to which the information provided is sufficient for completing the assignments. This parameter corresponds to parameter Completeness from the data model quality framework [16]. 3. Effort – the amount of time it takes for processing information in order to complete assignments. This parameter corresponds to Perceived Ease Of Use (PEOU) of the TAM framework [15]. However in our case measuring this parameter has another purpose than in TAM. Making it too easy to complete the assignments contradicts the learning goals of obtaining modeling skills nearing the level of acting practitioner. The time spent should be long enough but not too long so that the students lost their interest in completing assignments. The latter can be measured through parameter Engagement, see below. 4. Engagement – the degree to which working with the site was deemed interesting. This parameter interplays with the effort parameter, the idea is that if an assignment is interesting, increasing the student’s motivation, the assignment could also be difficult and require an effort to be completed. Based on the four parameters above, we created survey questions to measure them in relation to the whole project website (e.g. overall usefulness), and to the different types of media used for the case presentation (e.g. comparative usefulness). Out of the 210 students working with project assignments 49 responded to the survey. The response rate (23%) is to be considered normal for this type of survey in our department; the regular course evaluation surveys at DSV usually get about a 15-20% response rate. The results are presented in Table 4. The survey was designed to answer two questions: 1. Find out to what degree the project website was suitable as educational material 2. Find out the ways for improvement As far as suitability is concerned, the answers show the following: • Usefulness. The first two questions (Q1, Q2) about overall usefulness show that the students to a very large degree consider that the site helped them learn the subject matter, and understand how an analyst works. Note that in the second question (Q2) regarding the site’s ability to aid the student understand the work analysts do, got a high degree (33%) of students who were undecided. This is quite natural since many students do not have work experience and thus cannot compare it with previous experiences. Several comments related to Q1 pointed out that what helped the student to learn to use models was the site in combination with lectures. • Completeness. Based on Q5, the site was clearly deemed as containing enough information (86%). 11
Table 4. Results of Evaluation 5 Q1 - Overall usefulness (q3) The site helped me to learn to analyze existing organizations and their IT support with the aid of different kinds of models. Disagree 4%
Strongly Disagree 0%
Q2 - Overall usefulness (q4) The site helped me understand the work a business/systems analyst performs. Disagree 10%
Strongly Disagree 0%
Strongly Agree 21%
Undecided 8%
Strongly Agree 14%
Undecided 33% Agree 67%
Q3 - Overall usefulness (q5) If the project site is to be re-designed, what should the purpose of the re-design be? More challenging, realistic and easy 7%
Other 3%
Easier 14%
More challenging 12% More realistic 64%
Q5 - Overall completeness (q1) Did the project web site contain enough information to complete the project tasks? Little too much 2%
Much too much 2%
Not enough 0% Barely enough 10% Enough 86%
12
Agree 43%
Q4 - Comparative usefulness (q8) If we change the project site, which information sources would you like to have more of? More video interviews 29%
More internal documents 20%
More webbased sources 51%
Q6 - Overall effort (q2) In general, was it easy to find information needed to complete the project tasks? Difficult 0%
Very difficult 2%
Very easy 14%
Neither easy nor difficult 37% Easy 47%
Q7 - Comparative effort (q6) Which information source required the MOST work to find information needed to complete the project tasks? All required equal amount of work 36%
Internal documents 23%
Video interviews 30%
Web-based sources 11%
Q8 - Comparative engagement (q7) Which information source was most interesting to work with? All was equally interesting 33% Internal documents 2%
Video interviews 59%
Web-based sources 6%
• Effort. Question Q6 and Q7 shows that 61% of the students thought it was easy or very easy to find the information on the site. As described before, it is not necessarily good that the information is too easy to find, since that would not reflect a realistic working situation. Thus, the site could probably be changed to actually increase the effort needed from the students. This is also reflected in a comment made in the survey, where a student pointed out that it was actually too easy to find relevant information in the video interviews. On the other hand when students needed to choose the information source that comparatively required the most work (Q7), the video interviews was pointed out by 30% of the students as requiring the most work. • Engagement. From the responses on the question about which information source that was most interesting (Q8), 59 % of the students found the video interviews most interesting and 33 % found all sources equally interesting. As far as ways for improvement are concerned, the answers show the following: • From the answers of Q3 and Q4 it can be said that a future re-design targeting usefulness would be to make the site more realistic (64%) with a focus on the “AFFE” company’s simulated web site (51%). • The video interviews was considered the most interesting information source (Q8), at the same time they were considered the most challenging (Q7) - and 29% stated that they would like to have more video interviews in the future (Q4). This combination of challenging and engaging is something to tap into for future revisions of the site. The survey gave us a clear indication of that the site design was successful. During the course the teachers also had the same subjective impression, as will be discussed in the next section.
7
Reflections
As stated in the beginning of the paper we set out to change a IS modeling course to make it more realistic, but we also aimed at doing it by using a low-cost pragmatic approach. Regarding the cost, we spent in total 32 person-hours on re-designing the 13
course and 23 hours on executing/implementing the design. Thus, in total 55 hours were spent on remaking the course from using a text-only representation of the project assignment into a simulation using video, reports and a company website. Even though 55 hours is over a week of full-time work, it can still be said to be low-cost compared to the courses overall budget. When doing the re-design of the course, and when teaching the course we also made several subjective observations about the effects of the re-designed course: The first observation is that the students like the use of several media types, and are subjectively deemed as more engaged in the course. The survey showed that the student thought the usefulness of the project web site was high (see previous section on evaluation). This was also seen when observing the students present and discuss their work. For example, one teacher observed that several groups strongly objected when one group presented the idea that the fictitious “AFFE” company should buy an expensive ERP system. They simply felt that this would ruin the company’s fragile economy without having any positive effect. This was one of several signs of an increased engagement in the project assignment. An observation from the design work was that a part of adding a realistic touch to the information sources was to add layers of information. For example, the simulated protocol from the internal meeting was “decorated” with a formal introduction and signatures. Likewise, in the video interview with the development manager the manager expressed positive opinions on some parts of the development process. In both these examples, the added information was not used by the students in the assignment, but was added to give a feeling of authenticity. It was furthermore observed that some unintended information was conveyed in the video recordings. While the main subject of the video interviews was the description of a business process or the company’s current economic state, the students also interpreted how the interviewees behaved. For example, the sales manager was considered as being somewhat formal and “square” and some groups of students speculated that this could be the culprit of the issues the fictitious company had. The knowledge of different leadership styles and analysis thereof is not part of the current course, but observations like this may be of interest for future courses. Another, positive, unintended effect that was observed during the survey was that one student had problems reading long text because of dyslexia. For this student, using mixed information sources made it easier to grasp the course content. This is one example of how mixing media types may be a way to appeal to a wider range of students.
8
Conclusion
The evaluations of the trial has indicated that pedagogical gains can be made in teaching modeling skills with relative simple and cost effective use of video technology paired with a straight-forward web site. The key to creating the web site has been to have a simulated apprenticeship approach, where the student examines an enterprise based on simulated material in form of information fragments, such as economic in14
formation and protocols. Furthermore the students, as “apprentices”, were able to see a “master” analyst performing interviews. Our approach to using simulation in teaching/learning modeling skills is via simulating apprenticeship. As such, it is complementary to other usages of simulation for the same purpose, e.g. simulation of an object to be modeled, as in case of HyperCase [9]. The latter approach can require considerable costs and can be justified only if the volume of usage of such a simulator is high, which is the case with HeperCase distributed as a book companion. Our approach based on simulation of apprenticeship is a low-cost approach and can be used in, more or less, any course. The research presented in this paper is being conducted as Action Research (AR), i.e. in cycles. There are several ways of representing an AR cycle with the number of phases varying from 4 to 6, dependent on how detailed one wants to present the cycle. We use the version suggested by Kolb for experimental learning style theory [17], which can be represented as four stage learning cycle: Concrete experience Reflective Observation Abstract Conceptualization Active Experimentation Concrete Experience …. We consider that Kolb’s cycle is a good representation not only for student learning, but also for AR in a situation when researchers are also practitioners in the field where the given research project is conducted. In this case, learning is equal to obtaining new knowledge not only for the researchers involved, but also for the community of researchers and practitioners in the discipline. We are currently on the second cycle, having applied the new course design for the second time, and now doing “Reflective Observation”. In the next phase of our research (Abstract Conceptualization) we will investigate means to make the created information fragments reusable, so that several courses can share the same material. A start would be to see if the information fragments developed in the studied ITO course can be labeled in such a manner as to make them useful in another IS course where modeling skill are also developed. For this labeling different ontologies/taxonomies will be tested, including Bloom taxonomy [18], to map the formal intended learning objectives of the IS courses in the department to see which courses that may use the created information fragments. This would give economies of scale when reusing video and textual information fragments. Furthermore, video annotation could be used to make the video interviews more reusable by creating searchable libraries. Acknowledgments. The project was sponsored by Stockholm University’s program “Future Learn”. The authors are grateful to our colleagues Jelena Zdravkovic and Anders Thelemyr who participated in interviews recording, and to the anonymous reviewers whose comments helped to improve the text. The first author is also grateful to Anthony Burden who encouraged him in writing texts related to teaching/learning.
References 1. Bezivin, J., France, R., Gogolla, M., Haugen, O., Taentzer, G., D., V.: Teaching Modeling: Why, When, What? In Ghosh, S., ed. : MODELS 2009 Workshops, LNCS 6002, pp.55–62 (2010)
15
2. Engels, G., Hausmann, J. H., Lohmann, M., Sauer, S.: Teaching UML is Teaching Software Engineering is Teaching Abstraction. In Bruel, J. M., ed. : MoDELS 2005 Workshops, LNCS 3844, pp.306–319 (2006) 3. Fenstermacher, K. D.: If I had a Model, I’d Model in the Morning. In : Proceeding of OOPSLA'04, pp.88-89 (2004) 4. Polanyi, M. S.: Knowing and Being. University of Chicago, Chicago (1969) 5. McCune, V., Hounsell, D.: The development of students' ways of thinking and practising in three final-year biology courses. Higher Education 49(3), 255-289 (2005) 6. Bergin, R., Youngblood, Y., Ayers, M., Boberg, J., Bolander, K., Courteille, O., Dev, P., Hindbeck, H., Stringer, J., Thalme, A., Fors, U.: Interactive simulated patient: experiences with collaborative e-learning in medicine. J Educ. Comput. Res 29(3), 387-400 (2003) 7. Bergin, R. A., Fors, U.: Interactive simulated patient—an advanced tool for student activated learning in medicine and healthcare. Computers & Education 40, 61–376. (2003) 8. Kendall, J., Kendal, K. E., Baskerville, R., Barnes, R. J.: An Empirical Comparison of a Hypertext-Based Systems Analysis Case with Conventional Cases and Role Playing. DATA BASE ADVANCES, 27(1), 58 – 77 (1996) 9. Kendall, J., Kendall, K. E., Schmidt, A., Baskerville, R., Barnes, R. J.: HyperCase: A Hypertext-Based Case for Training Systems Analysts. (Accessed 2013) Available at: http://www.pearsonhighered.com/hypercase/hypercase2.9 10. Kendall, J., Kendall, E.: Systems Analysis and Design 9th edn. Pearson (2013) 11. NIST: Integration definition for function modeling (IDEF0), Draft Federal Information Processing Standards, Publication 183, 1993. (Accessed February 2015) Available at: www.idef.com/downloads/pdf/idef0.pdf 12. OMG: Business Process Model and Notation (BPMN), Version 2.0.2, Object Management Group (OMG), Document formal/2013-12-09, December 2013. (Accessed February 2015) Available at: http://www.omg.org/spec/BPMN/2.0.2/PDF 13. OMG: Business Motivation Model, Version 1.2, Object Management Group (OMG), Document formal/2014-05-01, May 2014. (Accessed February 2015) Available at: http://www.omg.org/spec/BMM/1.2/PDF 14. Bider, I., Perjons, E., Henkel, M., Kowalski, S.: Projektplatsen för ITO 2013. (Accessed 2013) Available at: http://ito2013.blogs.dsv.su.se/ 15. Davis, F.: Perceived usefulness, perceived ease of use, and user acceptance of information technology. MIS quarterly 13(3), 319-340 (1989) 16. Moody, D.: Improving the quality of data models: empirical validation of a quality management framework. Information systems 28(6), 619-650 (2003) 17. Kolb, D.: Experiential learning: Experience as the source of learning and development 1. Prentice-Hall., Englewood Cliffs, NJ, US (1984 ) 18. Bloom, B.: Taxonomy of Educational Objectives, Handbook I: The Cognitive Domain. David McKay Co Inc., New York (1956) 19. Bider, I., Henkel, M., Kowalski, S., Perjons, E.: Technology Enhanced Learning of Modeling Skills in the Field. In : To apear in proceedings of 8th IADIS International Conference on Information systems, Funchal (2015)
16