Available online at www.sciencedirect.com
ScienceDirect Procedia - Social and Behavioral Sciences 197 (2015) 1811 – 1817
7th World Conference on Educational Sciences, (WCES-2015), 05-07 February 2015, Novotel Athens Convention Center, Athens, Greece
Teaching University Physics by using Interactive Science Simulations methods Thanat Krobthonga* a
Faculty of Science and Technology, Suan Sunandha Rajabhat University,1U-thong Nok Rd., Dusit District, Bangkok 10300, Thailand.
Abstract This research aimed to study and compare the achievement of the students of the Faculty of Science and Technology who took the Fundamentals of Physics Course. They were randomized into either the treatment or control group taught by Interactive Science Simulations and the traditional methods, respectively. The arithmetic mean and variance of pretest scores of both groups had no statistically significant difference at a level of .05. The examination of Fundamentals of Physics Course was administered to the samples after the 15-week experiment. Then, the arithmetic mean of the posttest scores of both groups was compared using the ttest. The results revealed that the treatment and control groups’ percentages of arithmetic mean were 63.46 and 52.41, respectively. Meanwhile, the standard deviations of the former and latter groups were 4.94 and 4.47, respectively. Therefore, the treatment group’s achievement in the Fundamentals of Physics Course was significantly higher than the control group at a level of .05. © byby Elsevier Ltd.Ltd. This is an open access article under the CC BY-NC-ND license © 2015 2015The TheAuthors. Authors.Published Published Elsevier (http://creativecommons.org/licenses/by-nc-nd/4.0/). Peer-review under responsibility of Academic World Education and Research Center. Peer-review under responsibility of Academic World Education and Research Center. Keywords:Interactive Science Simulations
1. Introduction Due to the class time limit and the complexity of university-level physics, especially those virtually invisible contents, the students may learn less or slowly or fail to understand them totally. The learning materials or experiments with obvious demonstrations are thus needed for the effective instruction of physics to facilitate the students’ learning and comprehensive understanding of theories. In this regard, the interactive simulations with the presentation of
* Thanat Krobthong. Tel.: +662-160-1143-5; fax: +662-160-1146. E-mail address:
[email protected]
1877-0428 © 2015 The Authors. Published by Elsevier Ltd. This is an open access article under the CC BY-NC-ND license (http://creativecommons.org/licenses/by-nc-nd/4.0/). Peer-review under responsibility of Academic World Education and Research Center. doi:10.1016/j.sbspro.2015.07.240
1812
Thanat Krobthong / Procedia - Social and Behavioral Sciences 197 (2015) 1811 – 1817
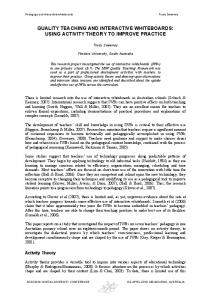
calculation methods may enhance the students’ self-directed study, while the teachers may be able to use them as learning materials. Currently, the creation of the interactive simulations to elucidate the less or non-visible phenomena or experiments becomes possible in the age of computer technology advancement. For example, the Interactive Science Simulations, developed by the University of Colorado at Boulder, involve the use of computer language to create the scientific simulations to run on java and flash platforms. 201 models have been created so far; 93 of them are the physics-related experiments. They are continually developed, user-friendly and available for free download. One can say that the students may probably produce greater achievement given that their teachers integrate the Interactive Science Simulations in the theoretical instructions and experiments. Hence, the researcher is interested to investigate whether the instruction integrated with the Interactive Science Simulations actually enhances the students’ deeper understanding with the expectation that the research results will be beneficial to the physics teachers and students who may have more alternatives as well as to the development of the science and technology-related instructions.
Fig. 1: Photoelectric Effect Interactive Science Simulations. (Source: https://phet.colorado.edu/en/simulation/photoelectric)
2. Objectives 1. To examine the physics instruction integrated with the Interactive Science Simulations. 2. To compare the treatment and control groups’ achievement in the physics course. 3. Perceived Benefits 1. The introduction of new physics instruction integrated with the Interactive Science Simulations . 2. The students’ ability to use the Interactive Science Simulations in learning physics on their own. 4. Methodology 4.1 Population and Sample 4.1.1 Population Students of the Faculty of Science and Technology
Thanat Krobthong / Procedia - Social and Behavioral Sciences 197 (2015) 1811 – 1817
1813
4.1.2 Sample 2 groups of the students of the Faculty of Science and Technology who take the Fundamentals of Physics Course in the Academic Year 2013 were randomly chosen by the researcher using the simple random sampling. In this regard, the students majoring in the Biotechnology Program were chosen in the treatment group taught by the Interactive Science Simulations, while the control group taught in the traditional methods comprised the students with the major of the Informatics Mathematic Program. 5. Variables Independent Variable: Instructional Approach. Dependent Variable: Academic Achievement. 6. Development of Research Tools The research tools were the handouts and examination papers of the Fundamentals of Physics Course, which are used in the pretest and posttest. 7. Conducting of Research The pretest is conducted with the treatment and control groups using the examination papers of the Fundamentals of Physics Course. After the 15-week experiment based on the teaching plan, both groups attend the post-test in which the examination papers of the Fundamentals of Physics Course were also used. 8. Statistical Analysis This is experimental research that studied and compared the achievement of students who took the Fundamentals of Physics Course. They were designated in the treatment and control groups taught by the Interactive Science Simulations and by traditional methods, respectively. The arithmetic mean, standard deviation, variance and t-test were the statistics used in this research for the comparison of the achievement of the two groups. 9. Results The results of this experimental research were as follows: Part 1 provided the results of the analysis of the arithmetic mean and standard deviation of the treatment and control groups’ pretest score. Table 1: Percentage of mean, Percentage of the arithmetic mean and Standard deviation of the pretest score of the treatment and control groups (group 1 and group 2, respectively) Group
n
1
26
14.54
Percentage of arithmetic mean 41.54
2
16
13.31
38.04
S.D. 4.50 4.32
According to the Table 1, the percentage of the arithmetic mean of the treatment and control groups’ pretest score was 41.54 and 38.04, respectively. Meanwhile, the standard deviation of pretest score of the former and latter groups was 4.50 and 4.32, respectively.
1814
Thanat Krobthong / Procedia - Social and Behavioral Sciences 197 (2015) 1811 – 1817
Part 2 provided the results of the analysis of the arithmetic mean, variance and F-test of the treatment and control groups’ pretest score. Table 2: Percentage of arithmetic mean, Variance and F-test of the pretest Score of the treatment and control groups (group 1 and group 2, respectively) Group
n
Variance
1
26
14.54
20.26
2
16
13.31
18.63
F
p
1.09
0.44
*p≤.05
According to Table 2, the variance of the treatment and control groups’ pretest score was tested using F-test. It as found that the deviation of both groups has no statistically significant difference at a level of 0.05. Part 3 provides the results of the analysis of the arithmetic mean, variance and t-test of the treatment and control groups’ pretest score. Table 3: Percentage of arithmetic mean, Variance and t-test of the pretest score of the treatment and control groups (group 1 and group 2, respectively) Group
n
Variance
1
26
14.54
20.26
2
16
13.31
18.63
t
p
0.87
0.39
*p≤.05
According to Table 3, t-test was used in the test of the deviation of the pretest score of the treatment and control groups. It suggested that the arithmetic mean of both groups had no statistically significant difference at a level of 0.05. Part 4 provided the results of the analysis of the arithmetic mean, percentage of arithmetic mean and standard deviation of the treatment and control groups’ post-test score. Table 4: Arithmetic mean, Percentage of arithmetic mean and Standard deviation of the posttest score of the treatment and control groups (group 1 and group 2, respectively) Group
n
1
26
22.21
Percentage of arithmetic mean 63.46
2
16
18.34
52.41
S.D. 4.94 4.47
According to Table 4, the percentage of the arithmetic mean of the treatment and control groups’ posttest score was 63.46 and 52.41, respectively. Meanwhile, the standard deviation of the posttest score of the former and latter groups was 4.94 and 4.47, respectively. Part 5 provided the results of the analysis of the arithmetic mean, variance and t-test of the treatment and control groups’ posttest score.
Thanat Krobthong / Procedia - Social and Behavioral Sciences 197 (2015) 1811 – 1817
1815
Table 5: Arithmetic mean, Variance and t-test of posttest score of the treatment and control groups (group 1 and group 2, respectively)
Group
n
Variance
1
26
22.21
24.44
2
16
18.34
34.08
t
p
2.55*
0.01
*p≤.05
According to Table 5, the difference of the arithmetic mean is tested using t-test. It is found that the arithmetic mean of the treatment group is higher than the one of the control group with a statistically significant difference at a level of 0.5. 10. Conclusions 1. The variance of pretest scores of Suan Sunandha Rajabhat University students in the treatment and control groups was tested using F-test. It was found that the variance of the former and latter groups (Group 1 and Group 2) had no statistically significant difference at a level of 0.05. Likewise, the use of t-test in examining the arithmetic mean of the treatment and control groups’ pretest score also revealed that the arithmetic mean of both groups also had no statistically significant difference at a level of 0.05.
70 60 50 40
Treatment group
30
Control group 20
10 0 n
Mean
Percentage of arithmetic mean
S.D.
Figure 2. Mean, Percentage of arithmetic mean and Standard deviation of achievement pretest scores.
2. The percentage of the arithmetic mean of the posttest scores of 26 students in the treatment group was 63.46, while the arithmetic mean, standard deviation and variance were 22.21, 4.94 and 24.44, respectively. On the other hand, the arithmetic mean of posttest scores of 16 students in the control group was 52.41, while the arithmetic mean, standard deviation and variance were 52.41, 18.34 and 4.47, respectively.
1816
Thanat Krobthong / Procedia - Social and Behavioral Sciences 197 (2015) 1811 – 1817
70 60 50 40 Treatment group
30
Control group 20 10 0 n
Mean
Percentage of arithmetic mean
S.D.
Figure 3. Mean, Percentage of arithmetic mean and Standard deviation of achievement posttest scores.
3. According to the t-test of the treatment and control group’s posttest score, the arithmetic mean of posttest scores of the former group was higher than the one of the latter group with a statistically significant difference at a level of 0.05. 11. Discussions With respect to the pretest scores, the students in the treatment and control groups had quite the same level of basic knowledge of physics. The score distribution was indifferent. However, after 15-week experiment, it was found that the treatment group had higher achievement than the control group with a statistically significant difference at a level of 0.05. This was in line with the proposed presumption. As the students in the treatment group enjoyed higher achievement than their counterparts in the control group, one could argue that the use of the Interactive Science Simulations enhanced the academic performance of Suan Sunandha Rajabhat University students. This finding agreed with the PHET concept claiming that the application of the Interactive Science Simulations may contribute to the students’ better achievement given that it is used together with the lectures, class activities in the laboratory and homework. Its design with few alphabetic characters suits well with a wide range of demands in the physics course (https://phet.colorado.edu/th/research, 2014). Likewise, according to the research conducted by Chanthanee Uttasin, Chanoknan Bang-liang and Anchan Muakngam, the Computer Aided Instruction on nuclear physics, which is relatively similar to the Interactive Science Simulations, also enhances the students’ posttest scores with a statistically significant difference at a level of 0.05. Besides, the study of Tharinee Maneesri also revealed that the researcher-developed Computer Aided Instruction boasts greater efficiency than the determined criteria. In particular, the comparison of pre- and posttest scores using t-test unveiled that the students had higher achievement with astatistically significant difference at a level of 0.05. Additionally, the researcher-developed Computer Aided Instruction on Physics 1 for the Engineers Course in the research of Chanthanee Uttasin, Chanoknan Bang-liang, Charas Boonyathamma and Yuree Worawichaiyan had efficiency in line with the required criteria. The students also achieved higher posttest score when compared to the pretest one with a statistically significant difference at a level of 0.05. Thus, it could be said that several research papers support the use of the Computer-based Learning Materials, Computer Aided Instructions and Computer Simulations in the physics courses or other subjects in order to simplify the relevant lessons for the students’ higher achievement.
Thanat Krobthong / Procedia - Social and Behavioral Sciences 197 (2015) 1811 – 1817
1817
The treatment group’s higher achievement in the Fundamentals of Physics Course when compared to the control group may be the evidence affirming that the use of Computer Simulations enhances the students’ understanding of physics, especially the virtually invisible content (e.g. Photoelectric Effects). In the traditional experiment, it may be difficult or impossible to fully observe the movement of such phenomena leading to the hindrance to the understanding. However, it becomes possible to give the relevant explanations when their movement is ‘paused’ in the Science Simulations. The study related to PHET Simulations (https://phet.colorado.edu/th/research, 2014) revealed that the use of PHET Simulations in the lectures or experiments increased the students’ learning motivation resulting in the enhanced efficiency of the instruction. 12. Suggestions 1. In addition to the tradition lectures, the instruction of physics should also include the experiments and demonstrations using proper learning materials. 2. The technological breakthroughs should be applied to the instruction of physics. 3. Similar research should be conducted in other disciplines such as chemistry, biology and mathematics. 4. Research on the creation and use of Interactive Science Simulations should be conducted. Acknowledgements This research was support by Suan Sunandha Rajabhat University (SSRU). The authors would like to express their gratitude to SSRU students who kindly helped and supported this research. References Bloom, Benjamin S. (1971). Handbook on Formative and Summative Evaluation of Student Learning. New York : McGraw-Hill Book Co. Bransford, J.D., Brown, A. L. And Cocking, R. R. (2000). How People Learn, Brain, Mind, Experience, and School. Washington, D.C.: National Academy Press. Janthanee Autthisin, Chanoknan Banglieng, Anchan Muakngam. (2013). Development of Computer Assisted Instruction on Nuclear Physics, RMUTP Research Journal Special Issue, The 5th Rajamangala University of Technology National Conference. Jones, Childers. (2001). Contemporary College Physics 2001 update (3rd ed.). New York. McGraw-Hill companies, Inc. Kanlaya Vanichbuncha. (2010) Statistics for research. Bangkok: thamsan company limited,108-110. Ministry of education. (2011) Student-centered learning. retrieved from http://www.moe.go.th. Prakong Kannasoot. (1989). Statistics for the behavioral sciences research. Bangkok. Book Center company Dr. Srisa-nga ltd. Puangrat Thaweratana. (1988). Behavioral research methods in political science and social sciences.Bangkok: Jaroenpol press. Tharinee maneesri. (2011) Development of computer assisted instruction in teaching materials of IEG320 probability and statistics for engineers. Sripatum University, Faculty of engineering. Tissana Khemmani. (2010) Science teaching, Knowledge in order to provide an effective learning process. Bangkok: Chulalongkorn University Printing House, Bangkok, Thailand, 141-146. University of Colorado at Boulder. (2013). PhET Interactive Simulations(Online). http://phet.colorado.edu. Young, Freedman. (2004) University Physics with Modern Physics. Pearson Education Indochina Ltd.