Interactive Teaching Applications Using Client-server MATLABTM Environments Mauricio A. Colombo1, María Rosa Hernández1, Jorge E. Gatica2*, Sridhar Ungarala2 1 Departamento de Ingeniería Química – Universidad Nacional de Tucumán Department of Chemical and Biomedical Engineering, Cleveland State University (USA)
2
Abstract. This paper demonstrates how to enhance student learning by means of an approach that combines interactive computer modules, hands-on laboratory activities, and process design through modern analysis tools. Current trends in program accreditation and assessment recommend that engineering majors be exposed to laboratory practices and be trained in planning of experiments, data acquisition, and statistical analysis of experimental data. In addition, engineering programs must ensure that students develop the ability to use techniques, skills and analysis common in modern engineering practice. Experience and curriculum assessment indicate the need for an early introduction of these principles and continuous reinforcement through engineering curricula. In this paper, we propose the development of interactive computer modules (ICMs) for instruction and training in design principles and statistical analysis of experimental data. These internet-based modules are developed using high-end graphics, point-and-click graphical user interfaces, and context-sensitive online help. It is here demonstrated how a popular programming environment: MATLAB, can be efficiently used in the back-end; while its internet interface: the MATLAB web server, can be used as the front-end to effortlessly configure client-server interactions. MATLAB is used throughout most engineering curricula for process simulation and analysis; thus, these modules can also be used to reinforce the use of computer tools for process analysis and design. The case study, a reaction engineering laboratory experiment, selected for this paper demonstrates how similar initiatives can be used to foster collaboration across programs and institutions.
Keywords: MATLAB WebServer, Internet, Interactive Applications
1. Introduction 1.1. Background and Significance The Internet is revolutionizing how information is accessed and shared, as well as how decisions are implemented. The underlying current of this transformation is the ability to rapidly and economically share information. ‘Information’ was originally limited to text but now encompasses images, audio, video, and myriad interactive environments. The Internet provides unprecedented control over information flows. A user can send information or receive information. An action can redirect the information flow, initiate a new information flow or stop a flow. The present trend in industrial automation is to integrate plant level systems with corporate Enterprise Wide Planning (ERP) environment (Chin, 1999a; 1999b) because control action, retrofitting, optimization, and general management and planning are intimately related to each other (Brisk, 1993). Until recently, information was relayed between layers of an enterprise or a process plant, via disjointed communication from archived data. The availability of tools to stream plant and management data to remote users over the Internet removed these restrictions. These tools allow users to manipulate real-world objects from a distance and collect data from remote instrumentation through the Internet. The result is an unprecedented capability to access data and implement decisions via web browsers from anywhere in the world. This technology offers exciting new opportunities ranging from performing surgery remotely to control of a petroleum refinery at a distance. *
To whom all correspondence should be addressed. Address: 455 Stilwell Hall - 2121 Euclid Avenue, Cleveland, Ohio 44115-2214 E-mail:
[email protected]
1
It can then be anticipated that remote instrumentation will have a profound impact on engineering education. Consider the Reactor Design and Process Control courses (both with significant laboratory components), which are core requirements in most Chemical Engineering curricula. The laboratory component provides a hands-on opportunity for students to apply concepts learned in the classroom, design and conduct experiments, identify and solve problems, and use modern engineering tools. Despite their importance, the learning experience in these labs lags behind current trends in Chemical Engineering practice with respect to both technical content and use of contemporary equipment. Significant pedagogical benefits would derive from solving these problems. Students would have access to experiments and training that demonstrate Chemical Engineering practice in process industry they are likely to enter upon graduation. Benefits include exposure to modern equipment and the incorporation of faculty research into the curriculum. Unlike experiments in the Unit Operations labs, which focus on learning centered on individual pieces of equipment, laboratory education in reaction engineering and process control must aim to provide experience of plant operations from a larger perspective. However, only a handful of schools have such industrial capabilities for undergraduate education (for example the Process Simulation and Control Center at Michigan Tech). The Internet can bridge this gap to bring contemporary engineering practices into the undergraduate control lab, which is a major dimension in current Engineering Accreditation Criteria. Remote access to this instrumentation and controllers via the Internet can readily and inexpensively simulate an industrial environment.
1.2. Relationship with Current Knowledge Relevant among recent activity are Web-labs at the University of Illinois (Bruce et al., 1997), Virtual Labs at the University of South Florida (Joseph et al., 2002), Remote Dynamical Systems Laboratory at Stevens Institute of
Technology
(URL:dynamics.soe.stevens-tech.edu),
the
i-lab
Heatexchanger
located
at
MIT
(URL:heatex.mit.edu), and a LabVIEW based control lab developed at the University of Tennessee (URL:chem.engr.utc.edu). The pedagogical aspects are drawing increasing attention due to the growing trend in Internet based distance education (Forinash and Wisman, 2001). The Accreditation Board of Engineering and Technology (ABET) is currently formulating guidelines for the evaluation of distance laboratory education (Chronicle of Higher Education 2002). There is a concomitant need for prototype installations and data on student comfort, motivation, learning and perceptions useful for pedagogical evaluation.
2. Description of the Application The experiments selected to illustrate this approach draw from three major Chemical Engineering courses: Chemical Engineering Junior Laboratory (Junior, Fall term), Chemical Reactor Design (Junior, Spring term), and Chemical Engineering Process Control (Senior, Fall term). These experiments complement existing laboratory activities in these courses. Extension to two other major Chemical Engineering courses is anticipated. This paper outlines several stages in the implementation of this approach. Some of those stages are fully developed, while others are at their developmental phase.
2
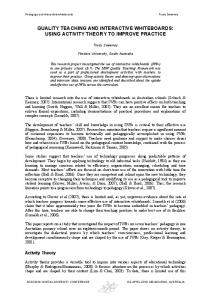
The basic experiment comprises the analysis, operation and control of chemically reacting flows. A reactor control and operation setting allows monitoring and remote adjustment of two independent feeding (reactant) lines, mixing efficiency of the reactor, reactor performance (reactant conversion), and control parameters. A Data Logging Unit converts the data into a digital signal, this signal is then processed in MatLAB environment, and a graphical user interface provides a real-time process monitoring. Students at remote locations will be able to assess the process performance and act on the different operating/control settings to meet a desired performance. Cameras will provide real-time view of the major experiment components (reactor, feeding tanks, control, and operating potentiometers). A bi-molecular, mildly exothermic, liquid-phase chemical reaction is run under low reversibility conditions. This ensures that possible limiting reactant conversions span over a wide range. The reactor (cf. Figure 1) consists of a 1-liter stirred tank reactor with separate controllers for two peristaltic pumps and a mechanical stirrer. The stirrer speed is correlated to the effective reactor volume via residence-time distribution experiments. The pumps settings are also calibrated to volumetric flow rates. The reactor unit is interfaced with a data acquisition that records pump settings, stirrer setting, temperature, and reactor concentrations (via a correlation between electrical conductivity and concentrations). Two independent control loops act on solenoid valves controlling the inlet flow rates of two reactants.
Fig. 1. Reactor Service Unit showing a Stirred-Tank Reactor and Data Acquisition Unit (adapted from Armfield)
The experiment is used to illustrate several aspects pertaining to planning and conducting experiments in engineering laboratories: (1) calibration curves are used to demonstrate experimental errors and significant figures, (2) mixing experiments are used to demonstrate error propagation and system identification, (3) reaction experiments are used to demonstrate integral and differential kinetic analysis, (4) flow and control experiments can be used to demonstrate dynamics and control tuning. These experiments are planned to be integrated under a typical assignment where students are required to control the reactants inlet flow rates to achieve a particular goal, namely a given reactant conversion or production rate. Students must adjust the model parameters according to the settings they select. Open-loop response and classical control theory (Ziegler-Nichols, for instance) are to be used to adjust the controllers. The experiment is then run with these parameters and results are compared against predictions. The Experimental data can be analyzed on-line, or be downloaded for processing in a local computer.
3
3. MATLAB and the MATLAB Web Server The MATLAB Web Server provides a front-end for MATLAB, a popular programming and simulation environment (cf. http://www.mathworks.com). MATLAB Web Server provides for a practical interface which enables users (clients) to access simulations running in a remote MATLAB environment (server). The results produced by these applications are displayed through hypertext transfer protocol (HTTP) via a web browser. Since MATLAB includes powerful numerical and graphical routines, very sophisticated models can be efficiently solved and the results be displayed in user-friendly graphical formats. The flow of information for a typical MATLAB Web Server application is shown in in Figure 2 (adapted from Pester and Ismailov).
Fig. 2. Flow of information in a typical MATLAB Web Server Client-Server implementation
Typically the client (student) invokes, via his browser, an HTML document from a HTTP daemon (HTTPD). A graphical user interface (GUI) enables the student to select a set of parameters describing a particular “whatif” scenario. Upon executing the data transfer, the HTTPD transfers the client-defined parameters to “matweb” (an application residing in the Common Gateway Interface, CGI, of the server). Matweb “interacts” with the MATLAB Web Server through internal protocol. The MATLAB application is executed within the server and its results are returned to matweb as an html document with text and graphical elements (cf. example shown in Figure 3).
4
Fig. 3. Example of Client-Server Application using the MATLAB Web Server environment
The integration of numerical analysis in engineering curricula has gradually become more important. Today’s industrial, R&D, and academic environments rely more heavily on computer simulations. Although analytical methods are useful to provide estimates and identify trends, thorough understanding of realistic systems requires computer simulations. These scenarios propose a duality, difficult to resolve in teaching environments. One can provide “black-box” modules, where students experiment with parameters and understand their implications on the process performance. On the other hand, only by writing code can a student understand the limitations or suitability of a given method or approach. A school of thought that is gaining momentum (cf. Peskin, M.E. Computing in Science and Engineering, 5(6), pp. 92-97, 2003) proposes to solve this dilemma by introducing a hierarchical structure in programming assignments. One can assign students to write a small function or subroutine that carries a small task in the numerical or statistical analysis, and then “compile” their sub-program within a larger program that implements the solution and includes a sophisticated GUI for result visualization. MATLAB release 13 provides resources for mixed-language programs as well as supports JAVA classes (cf. http://java.sun.com/docs/books/jls/), which makes it suitable for both efficient numerical calculations and secure internet-based applications. One of the advantages of the MATLAB Web Server implementation is that clients (users) can use MATLAB applications without requiring the installation of MATLAB in their computer. In addition, MATLAB applications delivered through the MATLAB Web Server are independent from the operating system used on the server side. Furthermore, since these applications are delivered through standard HTTP protocol, interaction is possible not only through web browsers but also from other applications that implement this protocol (e.g. JAVA applets and Active X controls). One of the main disadvantages of the MATLAB Web Server is that applications are extremely taxing on the hardware. MATLAB is an interpreted language, and therefore it is significantly slower than traditional compiled languages as FORTRAN or C. This shortcoming can today be overcome with fast processors.
5
4. Illustrative Example The interactive application has several distinct phases. The students are presented with the picture of the equipment shown in Figure 1. The picture is actually an image map where students can click to read about the specifications of each component, or select a given experiment. Let us illustrate the calibration experiment. In this experiment the objective is to obtain calibration curves for the two peristaltic pumps. This objective must be achieved within pre-specified time and number of experiments constraints: students are required not to perform more than 20 runs to calibrate both pumps. These runs must completed within 2 hours and each setting selected must be repeated at least once. The calibration is carried out using a “bucket and stop-watch” approach, where each setting can be run for 1, 2, or 5 minutes. The fluids are collected in graduated cylinders of 20, 50, 100, 250, or 500 mL with ten graduations each. In other words, a maximum of ten settings can be tested for each pump. Calibration measurements from a given hypothetical experimental design are depicted in Figure 4.
Flow rate, mL/min
100 Experimental Data
80 60 40 20 0 20
40
60 % Setting,
80
100
Fig. 4. Calibration Measurements
Next the students are presented with different choices to correlate flow rates with percentage setting of the potentiometer. Here they can select the order of the polynomial as well as if they want to re-center the data or not. The results are then reported including the standard error. Results for linear and quadratic correlations (using re-centering or not) are presented in Table 1.
6
Table 1. Correlation results for (Fig.5) calibration measurements
Linear a b Quadratic a b c
Coefficient 47.6 1.01 Coefficient 46.5 1.01 1.4E-03
Error 1.2 0.04 Error 1.7 0.04 1.6E-03
% 2% 4% % 4% 4% 114%
The results are also displayed graphically (cf. Figure 5) including the confidence intervals (95% for the example illustrated in Fig. 5).
Flow rate, mL/min
100 Experimental Data Linear Quadratic
80 60 40 20 0 20
40
60 % Setting,
80
100
Fig. 5. Calibration data and Correlations
The students are then required to define the correlations they would adopt for the pump being calibrated. They need to select the degree of correlation selected and enter the coefficients (and errors) with the proper number of significant figures. If the incorrect number of significant figures is “reported,” the students are required to re-enter the results. This procedure is repeated for the second pump, and the proper correlations adopted. The next step is to correlate the stirrer speed with the degree of mixing. This results used in conjunction with the calibration equations enable students to determine the effective volume (and its error) for a given stirrer setting. The process is completed with the kinetic determinations. As a result, the students would have a fully characterized reaction system. The next assignment is to select the settings to achieve a given degree of conversion, and the best start-up approach to minimize the transients. All the results can be verified experimentally, by controlling the unit either manually or remotely. Alternative applications would control exercises. These exercises would use the model identified above and controller settings determined using traditional or trial-and-error methods. 7
5. Summary and Conclusions A set of experiments have been formulated demonstrating elementary statistical principles associated with data acquisition and analysis. Concepts such as error propagation and experimental design become apparent by comparison between predicted and experimental behavior for a non-linear system. Access through the internet provides a first hand exposure to concepts of automation and remote control. While local students can verify their calculations and predictions by operating the unit manually, student at remote locations can be exposed to the same experiment and experience without the capital cost involved in establishing the actual experiment. Indeed, the development of remote monitoring capabilities to engineering laboratories can efficiently address both the concerns of maintaining a relevant curriculum and the associated costs. Such capability will have a profound impact on engineering laboratory education by making the experiments more relevant. Abeline or Internet2 broadband project, of which CSU is a partner, makes the possibility of adding video and sound to this experience an ever more exciting proposition. In addition, “wired” labs can be accessed by students away from campus and across institutions thereby facilitating multi-user infrastructure and avoiding duplication of resources.
References Brisk, M.L. (1993). Process Control: Theories and Profits. IFAC World Congress, Sydney, Australia. Chin, K. (1999a). Make the Data Connection across the Enterprise. Chem. Eng., (May). Chin, K. (1999b). Track Data Points by the Million. Chem. Eng., (August). Bruce, B., Carragher, B., Damon, B., Dawson, M, Eurell, J., Gregoryand, D., Lauterbur, P., Marjanovic, M., Mason-Fossum, B., Morris, H., Potter, C., and Thakkar, U. (1997). Chickscope: An Interactive MRI Classroom Curriculum Innovation for k-12. Comp. Edu., 73. Joseph, B., Ying, C.M., and Srinivasgupta, D. (2002). A laboratory to supplement courses in process control. Chem. Eng. Edu., 36. Forinash, P. and Wisman, L. (2001). The viability of distance education science laboratories. T. H. E. J., 29:38. Chronicle of Higher Education (2002), February 1:2002. Johnson, D.W., Johnson, R.T., and Smith, K.A. (1991). Active Learning: Cooperation in Classroom Learning. Interaction Book Company, Edina, MN. Pester, A., and Ismailov, R. (2002) Interactive Applications in Teaching with the MATLAB Web Server. (Carinthia Tech Institute) http://sim.cti.ac.at/wsdemos/doc/Using_Matlab_Webserver.pdf Wankat, P.C., and Oreovicz, F.S. (1993). Teaching Engineering. McGraw Hill, New York.
Acknowledgments The authors want to acknowledge the support of the participant institutions under an International Academic Exchange Programs subscribed by Cleveland State University (USA) and the Universidad Nacional de Tucumán (Argentina). 8